 Duplex
2008 W Jefferson St · Louisville, KY
Flood risk 1/10 · Minimal
- FEMA flood zone
- X (unshaded)
- Chance of flooding over 30 yrs
- 0.0%
- Est. flood insurance / yr
- $473 – $860
Fire risk 1/10 · Minimal
- Est. fire insurance / yr
- $839 – $1,559
Heat risk 5/10 · Moderate
- Hot days now (above 105°F)
- 7 days/yr
- Hot days in 30 yrs
- 20 days/yr
Wind risk 2/10 · Minimal
- Chance of severe wind over 30 yrs
- 1.0%
Air-quality risk 2/10 · Minimal
- Unhealthy air days now
- 1 days/yr
- Unhealthy air days in 30 yrs
- 2 days/yr
Risk factors via First Street. Map © Google.
Why this score? — see what drove the B- grade
The composite is a weighted blend of 9 inputs, each scored 0–100. Each bar is that input's sub-score; the figure is the points it added to the 100-point composite (weight × sub-score).
- Cash flow +30.0/30.0
- 1% rule +10.0/10.0
- DSCR +10.0/10.0
- ARV discount +7.5/15.0
- Rent growth +3.4/5.0
- Livability +3.2/5.0
- Condition / age +2.5/5.0
- Schools +2.3/10.0
- Appreciation +0.0/10.0
$199,000
🖨 Deal sheet (PDF) 📄 Offer letter ✓ Due diligence
Multi-family units
County records classify this as Multi-Family (5+ Unit). Listing-text estimate: 2 units. estimate disagrees with records
5+ unit building — per-unit beds/baths from public records are typically unavailable; the breakdown below (if shown) is an estimate from the listing text.
Listing remarks
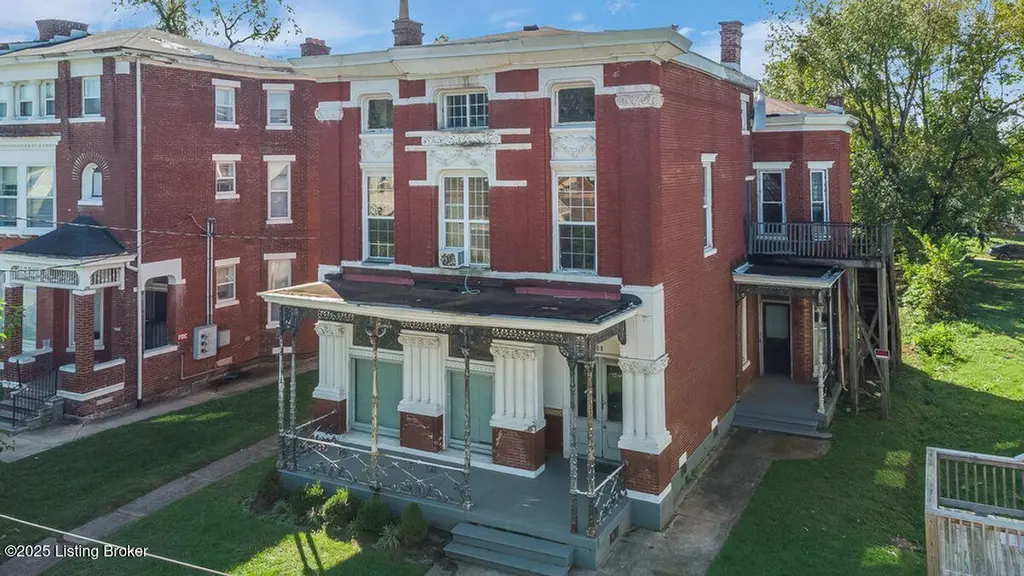
Spacious Victorian 3 Story multi family bldg. Iron decorated porch. Gorgeous fireplaces. 1 unit currently occupied. 1 unit not fully finished-no cabinets or furnace.
Key facts
- Built 1865
- Listed 78 days
Property features AI
Finance
- Other: Building area reported by appraiser; Building area total approximately 4,591 (source: appraiser); Living area reported as 5,446
- Financial info: Multi-unit property (total units by level: first 1, second 2, third 1)
- HOA & community: No association fee
Exterior
- Parking: No covered parking
- Utilities: Electricity connected; Owner pays water and sewer; tenants pay cable, electric, and gas
- Home design: Architectural style: Other; Built in 1865
- Construction: Concrete and brick construction; Shingle roof
- Exterior features: No exterior amenities listed
Interior
- Kitchen: First level: kitchen with range and refrigerator; Second level: two kitchens each with range and refrigerator
- Bedrooms: Total of 6 bedrooms; Third level: 1 bedroom; Second level: 2 bedrooms; First level: 3 bedrooms
- Bathrooms: Third level: 1 full bath; Second level: 2 full baths and 2 partial baths; First level: 1 full bath
- Heating & cooling: Heating: Electric and Natural Gas; Three furnaces; Cooling: Central air with three HVAC units
- Interior features: Multi-unit building with separate meters
- Laundry & utility: First level laundry area
Neighborhood map
What this means for you Summary
Snapshot
- This is a 2 × 3-bed/?-bath units multifamily listed at $199k.
Deal economics
- At list price, monthly cash flow is $1k ($12k/yr) — positive. Per door: $521/mo.
- The deal already cash-flows at list — no discount required.
- Meets the 1% rule at list price ($3k rent vs $199k).
- Recommended offer: $187k (6.0% below list) — sets the bar for market timing.
- Cap rate 12.6% vs local median 5.0% in Louisville — top-decile yield for the area; either an underpriced asset or a hidden risk that comps aren't pricing in. Stress-test before assuming the spread holds.
Location & tenants
- Location reads 63/100 on livability (#333 in KY) — a middle-class / working-renter tenant base. Strengths: cost of living A+, housing A+; Watch: employment C-, health & safety D+, schools D-.
- Jefferson County (urban): math 19% / reading 35% proficiency, ranked #121 of 165 in KY (top 73%) — low school quality limits family demand, transient renter base, plan for 1-2y turnover.
- Market conditions: Rents rising (+3.7%/yr); 115 active listings in the ZIP; lower-income renter base — watch delinquency; 2,836 units permitted in Jefferson County in 2024 (1,558 in 5+ unit buildings).
- At $3,030/mo this rent would consume 118% of the median local household income ($31k/yr) (locally 1603% of renters already pay >50% of income on rent) — very limited rent-growth headroom before tenants either downsize or default.
Forward outlook
- Local home prices are declining (-3.0%/yr); year-one equity from $1k of loan paydown is wiped out by about $6k of value loss. Plan a longer hold.
- Jefferson County population projected at +13% by 2050 — modest demand growth; plan on rents tracking national, not racing it.
- At projected returns (-3.0% appreciation + 3.7% rent growth), your $56k cash investment doubles in ~6 years — after that, you're playing with house money.
Negotiation context
- It's been on market 79 days — a 6% lower offer ($187k) is reasonable based on typical stale-listing flexibility.
- 9 sale attempts since 27y ago; this cycle's ask has dropped $26k (12%) from the opening price — seller is motivated, your offer sets the floor, not the list.
- Current owner paid $70k; list at $199k implies a 184% gain — meaningful room to come down on a strong offer.
Risks & watch-outs
- Watch-outs: built in 1865 — expect roof / HVAC / electrical / plumbing capex.
- Climate carrying-cost: extreme-heat days projected 7→20/yr by 2055 (HVAC capex compounding) — expect insurance premiums to compound above CPI over the hold.
Questions for the listing agent
- It's been on market 79 days. Have you received any prior offers? Is the seller open to a 6% concession, seller financing, or rate buy-down credit?
- Can we see the unit-by-unit rent roll, current vacancy, and any below-market leases? What's the average tenancy length?
- What capital expenditures (roof, boiler, parking lot, exteriors) have been made in the last 5 years, and what's planned in the next 2?
- Built in 1865 — when were the roof, HVAC, electrical panel, plumbing, and water heater last replaced?
- Why hasn't it sold? Are there any deal-killer items the seller is aware of (foundation, flood, title, zoning, code violations)?
- Is there a deadline driving the sale (1031 exchange, divorce, estate, relocation)? That informs how much negotiation room exists.
- Schools are D-rated, which usually means shorter tenancies and higher turnover. Who's the typical renter profile here, and what's been the actual vacancy rate?
- Crime grade is F in this area — have there been break-ins, vandalism, or insurance claims at this property in the last 3 years? What carrier currently insures it and at what premium?
- What's the average days-on-market for RENTAL listings here right now (not sales)? A rising rental-DOM trend means longer vacancies and softer asking-rent achievability than the comps imply.
- What's the recent tenant-quality profile in this submarket — average credit score on applications, eviction rate, late-payment / NSF rate, and stable-employment percentage? A property-management company in the area should have these aggregated.
- How much new apartment / multifamily construction is in the pipeline within 1–3 miles? Heavy new supply (>2% of stock underway) typically softens rents 12–24 months out; light construction supports rent growth.
Investment metrics
- 1% rule
- 1.52% ✓
- Cap rate
- 12.57%
- Cash-on-cash
- 22.42%
- DSCR
- 2.00
- GRM
- 5.5
CMA / ARV
No comps found within radius.
Projected returns pro-forma
-3.0% appreciation · 3.73% rent growth · sell at horizon
- IRR
- 16.1%
- Equity multiple
- 1.65×
- Total profit
- $36,336
- Equity at exit
- $29,672
- IRR
- 25.2%
- Equity multiple
- 3.27×
- Total profit
- $126,489
- Equity at exit
- $17,206
Cash invested: $55,720 (down + closing). Projections, not guarantees.
Landlord ↔ Tenant lean methodology
- Overall (STATE)
- 83 Strongly Landlord-Friendly
- State Kentucky
- 83 Strongly Landlord-Friendly · R+16
- County
- — inherits STATE
- City
- — inherits STATE
ZIP-level market 40203
- Home prices YoY
- -13.8%
- Rents YoY
- 3.7%
- Active inventory
- 115
- Price-to-rent
- 10.9×
Monthly cashflow live
- Estimated rent
- $3,030 medium interval (Pro) →
- Mortgage (P&I)
- −$1,044
- Tax from tax record
- −$226 /mo · $2,713/yr
- Insurance
- −$83
- HOA
- −$0
- Vacancy / Maint / Mgmt
- −$636
- Net cashflow
- $1,041
Break-even live
Sensitivity live
| Price | -10% $1,154 | -5% $1,097 | +0% $1,041 | +5% $985 | +10% $928 |
|---|---|---|---|---|---|
| Rent | -10% $802 | -5% $921 | +0% $1,041 | +5% $1,161 | +10% $1,280 |
| Rate | -1.0pp $1,141 | -0.5pp $1,092 | base $1,041 | +0.5pp $990 | +1.0pp $937 |
2-unit breakdown (identical units grouped — click to expand)
| Units | Beds | Baths | Est. rent |
|---|---|---|---|
| 2× units | 3 | — | $3,030 |
| #1 | 3 | — | $1,515 |
| #2 | 3 | — | $1,515 |
| Total (2 units) | $3,030 | ||
UW: 25.0% down · 7.5% · 30yr · 1.5% tax · 5.0% vac · 8.0% maint · 8.0% mgmt
Financing live
Cash to close
- Down payment
- $49,750
- Closing costs
- $5,970
- Reserves months
- —
- Total cash needed
- —
Loan-product check · same deal, 3 products live
Conventional
25% down · 7.5% · 30yr
- Down + closing
- —
- Monthly P&I
- —
- Monthly cashflow
- —
- DSCR
- —
- Eligible?
- —
Personal DTI + credit; lowest rate.
DSCR
20% down · 8.5% · 30yr
- Down + closing
- —
- Monthly P&I
- —
- Monthly cashflow
- —
- DSCR
- —
- Eligible?
- —
No personal income docs; deal must DSCR.
Hard money
10% down · 12.0% · 12mo
- Down + closing
- —
- Monthly P&I
- —
- Monthly cashflow
- —
- DSCR
- —
- Eligible?
- —
Short-term bridge; refi at stabilization.
Listing history 37 events
-
2026-06-21days on market $199,000 Active 79 DOM
-
2026-06-18days on market $199,000 Active 76 DOM
-
2026-06-17days on market $199,000 Active 75 DOM
-
2026-06-16days on market $199,000 Active 74 DOM
-
2026-06-15days on market $199,000 Active 73 DOM
-
2026-06-13days on market $199,000 Active 71 DOM
-
2026-06-10days on market $199,000 Active 68 DOM
-
2026-06-09days on market $199,000 Active 67 DOM
-
2026-06-08days on market $199,000 Active 66 DOM
-
2026-06-07days on market $199,000 Active 65 DOM
-
2026-06-03days on market $199,000 Active 61 DOM
-
2026-06-02days on market $199,000 Active 60 DOM
-
2026-06-01days on market $199,000 Active 59 DOM
-
2026-05-31days on market $199,000 Active 58 DOM
-
2026-05-01price $199,000
-
2026-04-03$225,000 Active
-
2026-04-01historical
-
2026-03-08price $225,000
-
2025-10-01$250,000 Active
-
2023-10-02status Pending
-
2023-10-02historical
-
2023-09-20historical Active Under Contract
-
2023-09-20status Active
-
2023-09-20status Pending
-
2023-07-18status Active
-
2023-07-15status Pending
-
2023-07-07$235,000 Active
-
2023-06-30historical
-
2023-03-17price $235,000
-
2023-03-17$250,000 Active
-
2023-03-16historical
-
2022-12-17status Active
-
2022-11-29historical Active Under Contract
-
2022-09-22status Pending
-
2022-09-16$250,000 Active
-
1999-11-18soldstatus $70,000
-
1999-05-10$79,000
ⓘ Source: listings_history table (triggers on properties + properties_extension) + one-shot
backfill from property_details.listing_events for pre-trigger history.
Tax reassessment forecast KY · Resets to sale price
- Current annual tax
- $2,713 · $226/mo
- Projected year-2 tax
- $2,713 · $226/mo
- Expected delta
- $0/yr ($0/mo · 0.0%)
ⓘ Screening estimate from a state-policy table — verify with the county assessor before closing.
Climate risk First Street
- Flood 1/10 Low FEMA zone X (unshaded) · 0% chance over 30 yrs
- Wildfire 1/10 Low
- Heat 5/10 Major 7 d/yr ≥105°F today · 20 d/yr by 30 yrs out
- Wind 2/10 Low 100% chance of damaging wind over 30 yrs
- Air quality 2/10 Low 1 unhealthy d/yr today · 2 by 30 yrs out
Nearby sold comps map
Loading sold comps map…
Walkable amenities ~0.75 mi
Loading nearby amenities…
Taxation est. · year 1
- Rental income
- $36,360
- − Mortgage interest
- −$11,147
- − Property taxes
- −$2,713
- − Insurance
- −$995
- − Repairs & maintenance
- −$2,909
- − Management
- −$2,909
- − Depreciation
- −$5,789
- Taxable income
- $9,898
- Est. tax owed @ 24.0%
- −$2,376
- After-tax cash flow
- $10,118/yr
For passive investors: Depreciation is non-cash, so a rental often shows a tax loss while cash-flowing — sheltering income. Rental losses are passive: they offset passive income freely, and up to $25,000/yr can offset ordinary (W-2) income if you actively participate and your MAGI is under $100k (phasing out to $0 by $150k); unused losses carry forward. On sale, claimed depreciation is recaptured at up to 25%, and gains may owe capital-gains tax (a 1031 exchange can defer both). Figures are a year-1 estimate at your 24.0% rate — not tax advice; consult a CPA.
Schools (NCES district)
- District
- Jefferson County
- NCES district ID
- 2102990
- Math proficiency
- 19% ▼ -17.00%
- Reading proficiency
- 35% ▼ -11.00%
- Median HH income
- $47,885
- Composite
- 23.45/100
- National rank
- #7884
- State rank
- #121 of 165 in KY
Livability — Louisville
- Score
- 63/100
- State rank
- #333
- US rank
- #15887
Category grades
Schools grade is shown separately in the Schools card above.
Census & demographics
- Census place
- Louisville, KY
- County
- Jefferson County · 790,184 people
- City population
- 769,292
- Metro
- Louisville/Jefferson County, KY-IN
- Population (ZIP)
- 17,742
- Household income
- $30,794
- Rent vs Own
- Severe rent burden
- 1603.0
Population outlook (Jefferson County) Hauer SSP2
- Today (2025)
- 823,112 people
- By 2030
- 849,343 · +3.2%
- By 2040
- 895,696 · +8.8%
- By 2050
- 933,630 · +13.4%
- By 2075
- 1,028,262 · +24.9%
- By 2100
- 1,072,675 · +30.3%
Race, ethnicity, and origin ACS 2023
- Neighborhood character
- Diverse neighborhood (Simpson 0.56)
- Race & ethnicity
- Black 49% White 44% Two or more races 4% Hispanic / Latino 3%
- Common ancestry
- Slovak 2% Lithuanian 2% Romanian 1%
- Foreign-born
- 3% · Canada
- Languages at home
- 97% English-only · Spanish 2%
Political lean MEDSL · Jefferson
- 2024 margin
- D (+16.6) · D 57.4% · R 40.9% · Other 1.7%
- 2008→2024 swing
- +4.5pp toward D · 2008: 12.0pp · 2024: 16.6pp
- All cycles
- 2024: D+16.6 2020: D+20.1 2016: D+13.3 2012: D+11.1 2008: D+12.0
Not yet ingested
- Civics
- —
Market trends
- HPI YoY
- ▼ -64.74%
- Current HPI
- 405.1872
- Rent YoY
- ▲ 3.73%
- Metro
- Louisville/Jefferson County, KY-IN
- State GDP YoY
- ▲ 1.81%
- F500 in state
- 4
Industry mix (Fortune 500 HQ in KY)
| Industry | F500 HQs | Revenue |
|---|---|---|
| Healthcare | 1 | $118B |
|
||
| Food / Beverage | 1 | $7B |
|
||
Price history
+151.9% since first listed23 events — show timeline
- 2026-05-01 Price Changed $199,000 Metro Search MLS
- 2026-04-03 Listed $225,000 Metro Search MLS
- 2026-04-01 Listing Removed — Metro Search MLS
- 2026-03-08 Price Changed $225,000 Metro Search MLS
- 2025-10-01 Listed $250,000 Metro Search MLS
- 2023-10-02 Pending — Metro Search MLS
- 2023-10-02 Listing Removed — Metro Search MLS
- 2023-09-20 Contingent — Metro Search MLS
- 2023-09-20 Relisted — Metro Search MLS
- 2023-09-20 Pending — Metro Search MLS
- 2023-07-18 Relisted — Metro Search MLS
- 2023-07-15 Pending — Metro Search MLS
- 2023-07-07 Listed $235,000 Metro Search MLS
- 2023-06-30 Listing Removed — Metro Search MLS
- 2023-03-17 Listed $250,000 Metro Search MLS
- 2023-03-17 Price Changed $235,000 Metro Search MLS
- 2023-03-16 Listing Removed — Metro Search MLS
- 2022-12-17 Relisted — Metro Search MLS
- 2022-11-29 Contingent — Metro Search MLS
- 2022-09-22 Pending — Metro Search MLS
- 2022-09-16 Listed $250,000 Metro Search MLS
- 1999-11-18 Sold (MLS) $70,000 Metro Search MLS
- 1999-05-10 Listed $79,000 Metro Search MLS
Property tax history
+6.5%/yrLatest (2025): $2,713 · -1.9% YoY. Source: county tax records.
Cash-flow waterfall
monthlySold comps — $/sqft
last 12 mo · ≤1 miLoading sold comps…