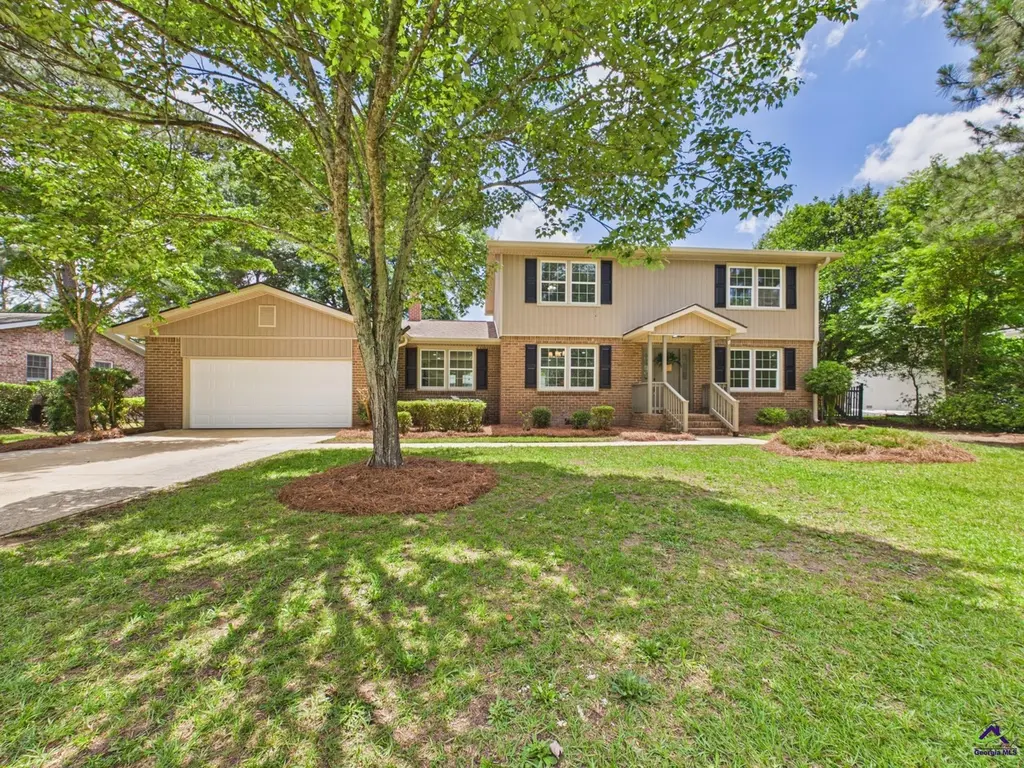
1011 Country Club Rd · Perry, GA
Flood risk 1/10 · Minimal
- FEMA flood zone
- X (unshaded)
- Chance of flooding over 30 yrs
- 0.0%
- Est. flood insurance / yr
- $507 – $1,088
Fire risk 2/10 · Minimal
- Est. fire insurance / yr
- $963 – $1,789
Heat risk 7/10 · Major
- Hot days now (above 109°F)
- 7 days/yr
- Hot days in 30 yrs
- 18 days/yr
Wind risk 8/10 · Major
- Chance of severe wind over 30 yrs
- 80.0%
Air-quality risk 2/10 · Minimal
- Unhealthy air days now
- 2 days/yr
- Unhealthy air days in 30 yrs
- 2 days/yr
Risk factors via First Street. Map © Google.
Why this score? — see what drove the D- grade
The composite is a weighted blend of 9 inputs, each scored 0–100. Each bar is that input's sub-score; the figure is the points it added to the 100-point composite (weight × sub-score).
- Cash flow +14.6/30.0
- ARV discount +5.4/15.0
- DSCR +4.4/10.0
- Schools +3.9/10.0
- Livability +3.4/5.0
- 1% rule +2.9/10.0
- Rent growth +2.5/5.0
- Condition / age +2.5/5.0
- Appreciation +0.0/10.0
$339,900
🖨 Deal sheet 📄 Offer letter ✓ Due diligence
Listing remarks MLS
This spacious one-owner Colonial style home with more than 2200 sq. ft. features 4 bedrooms, 3 baths, formal living and dining areas as well as large den with fireplace. Exterior is brick & new vinyl siding for low maintenance. Some renovations started, but needs some cosmetic repairs and improvements. Great location, close to Perry Country Club. 3 Ton 13 Seer Trane package gas/electric installed in November 2013. Roof replaced in October 2010. Taxes for 2015 - $1939.79
Key facts
- Double vanity
- Walk-in tile shower
- Storage shed
Tags
Property features AI
Finance
- Other: Located in Country Club Estates subdivision
Exterior
- Parking: Attached garage with 2 covered parking spaces (2 total garage spaces)
- Utilities: Public water; Public sewer
- Home design: Single-family residence; Residential property
- Construction: Above-grade finished living area reported (2,272)
- Exterior features: Patio; Privacy fencing; Workshop on the property
Interior
- Kitchen: Electric range; Oven; Dishwasher
- Flooring: Carpet; Vinyl
- Bathrooms: Three full bathrooms
- Heating & cooling: Central heating; Central air conditioning
- Interior features: Fireplace (1); Crawl space basement
Neighborhood map
What this means for you Summary
Snapshot
- This is a 4-bed/3.0-bath single-family listed at $340k.
Deal economics
- At list price, monthly cash flow is $79 ($948/yr) — positive.
- The deal already cash-flows at list — no discount required.
- To meet the 1% rule (rent ≥ 1% of price), the offer needs to be $268k (21.1% below list).
- Recommended offer: $268k (21.1% below list) — sets the bar for 1% rule.
- Cap rate 6.6% vs local median 4.5% in Perry — top-decile yield for the area; either an underpriced asset or a hidden risk that comps aren't pricing in. Stress-test before assuming the spread holds.
Location & tenants
- Location reads 68/100 on livability (#149 in GA) — a middle-class / working-renter tenant base. Strengths: cost of living A+, housing A+, crime B+; Watch: amenities F, commute F, health & safety F.
- Houston County (urban): math 43% / reading 46% proficiency, ranked #23 of 174 in GA (top 13%) — families likely to look elsewhere, expect single-tenant / working-renter base with shorter leases.
- Zoned schools: Morningside Elementary School (math 32% / reading 32%, grade F, #582 of 1,228 statewide, top 50%, 503 students, 84% FRL); Perry Middle School (math 53% / reading 51%, grade C+, #60 of 470 statewide, top 13%, 1,070 students, 51% FRL); Perry High School (math 31% / reading 39%, grade F, #84 of 424 statewide, top 20%, 1,478 students, 48% FRL) — zoned schools average 61% FRL vs 46% district-wide (15 pts higher); higher-poverty schools than district average — tighter screening recommended.
- Market conditions: 466 active listings in the ZIP; 7 comparable units currently listed for rent nearby; rentals at typical pace (median 21d on market — plan ~3-4 weeks tenant-placement turnaround); 1,545 units permitted in Houston County in 2024 (336 in 5+ unit buildings).
- This rent runs 43% of the median local income ($75k/yr) — at the standard rent-burdened threshold; future hikes will face affordability resistance.
Forward outlook
- Local home prices are declining (-3.0%/yr); year-one equity from $2k of loan paydown is wiped out by about $10k of value loss. Plan a longer hold.
- Houston County population projected at +22% by 2050 — long-run rental-demand tailwind backs the buy-and-hold thesis.
Negotiation context
- It's been on market 19 days — a 2% lower offer ($335k) is reasonable based on typical stale-listing flexibility.
- 2 sale attempts since 10y ago with the ask held roughly flat each time — persistent listings suggest the price (not the market) is what's stuck; bring a comps-based counter.
- Current owner paid $115k; list at $340k implies a 196% gain — meaningful room to come down on a strong offer.
Risks & watch-outs
- Climate carrying-cost: severe wind risk, 80% chance of damaging wind over 30y; extreme-heat days projected 7→18/yr by 2055 (HVAC capex compounding) — expect insurance premiums to compound above CPI over the hold.
Questions for the listing agent
- Built in 1973 — when were the roof, HVAC, electrical panel, plumbing, and water heater last replaced?
- Is there a deadline driving the sale (1031 exchange, divorce, estate, relocation)? That informs how much negotiation room exists.
- The area grade is low — what's the realistic commute time and amenity access for the typical tenant pool here? Any planned neighborhood developments (good or bad) we should know about?
- What's the average days-on-market for RENTAL listings here right now (not sales)? A rising rental-DOM trend means longer vacancies and softer asking-rent achievability than the comps imply.
- What's the recent tenant-quality profile in this submarket — average credit score on applications, eviction rate, late-payment / NSF rate, and stable-employment percentage? A property-management company in the area should have these aggregated.
- How much new for-sale + rental construction is in the pipeline within 1–3 miles? Heavy new supply typically softens prices + rents 12–24 months out; constrained supply supports both.
Investment metrics
- 1% rule
- 0.79% ✗
- Cap rate
- 6.57%
- Cash-on-cash
- 1.00%
- DSCR
- 1.04
- GRM
- 10.6
CMA / ARV
- ARV (on-the-fly)
- $324,896
- Comps found
- 12
Show comp detail 12 sales within ~0.75 mi
| Address | Dist | Beds/Ba | Sqft | Sold | Price | $/sf | Match |
|---|---|---|---|---|---|---|---|
| 1739 Houston Lake Rd | 0.15mi | 3/2.0 (-1) | 2,163 (-5%) | 4mo | $177,000 | $82 | 73 |
| 312 Bridgehampton Way | 0.36mi | 4/2.0 | 2,154 (-5%) | 5mo | $285,000 | $132 | 67 |
| 112 Bainbridge Ln | 0.26mi | 4/2.5 | 2,531 (+11%) | 3mo | $410,000 | $162 | 65 |
| 1015 Country Club Rd | 0.05mi | 3/2.5 (-1) | 2,576 (+13%) | 8mo | $347,000 | $135 | 62 |
| 1339 Grant St | 0.45mi | 5/2.0 (+1) | 2,220 (-2%) | 8mo | $235,000 | $106 | 60 |
| 1009 N Davis Dr | 0.22mi | 3/2.0 (-1) | 2,017 (-11%) | 5mo | $260,000 | $129 | 58 |
| 223 Idle Pines Dr | 0.36mi | 4/2.5 | 2,534 (+12%) | 5mo | $405,000 | $160 | 58 |
| 648 Encore Dr #84 | 0.74mi | 4/3.0 | 2,172 (-4%) | 1mo | $317,865 | $146 | 58 |
| 412 Legacy Park Dr | 0.73mi | 4/3.0 | 2,170 (-4%) | 6mo | $310,000 | $143 | 54 |
| 1152 Lovely Ln | 0.72mi | 4/2.0 | 2,180 (-4%) | 6mo | $215,000 | $99 | 51 |
| 1202 Fairway Dr | 0.63mi | 3/2.0 (-1) | 2,040 (-10%) | 9mo | $318,000 | $156 | 37 |
| 1202 Fairway Dr | 0.63mi | 3/2.0 (-1) | 2,040 (-10%) | 9mo | $318,000 | $156 | 37 |
Match score weights: distance 35% · size 25% · config 20% · recency 20%. Top-matched comps best support the ARV.
Projected returns pro-forma
-3.0% appreciation · 3.0% rent growth · sell at horizon
- IRR
- -14.8%
- Equity multiple
- 0.47×
- Total profit
- $-50,196
- Equity at exit
- $50,680
- IRR
- -6.2%
- Equity multiple
- 0.60×
- Total profit
- $-37,838
- Equity at exit
- $29,388
Cash invested: $95,172 (down + closing). Projections, not guarantees.
Landlord ↔ Tenant lean methodology
- Overall (STATE)
- 90 Strongly Landlord-Friendly
- State Georgia
- 90 Strongly Landlord-Friendly · R+3
- County
- — inherits STATE
- City
- — inherits STATE
ZIP-level market 31069
- Active inventory
- 466
- Price-to-rent
- 10.6×
Monthly cashflow live
- Estimated rent
- $2,682 high interval (Pro) →
- Mortgage (P&I)
- −$1,782
- Tax from tax record
- −$116 /mo · $1,388/yr
- Insurance
- −$142
- HOA
- −$0
- Vacancy / Maint / Mgmt
- −$563
- Net cashflow
- $79
Break-even live
UW: 25.0% down · 7.5% · 30yr · 1.5% tax · 5.0% vac · 8.0% maint · 8.0% mgmt
Financing live
Cash to close
- Down payment
- $84,975
- Closing costs
- $10,197
- Reserves months
- —
- Total cash needed
- —
Loan-product check · same deal, 3 products live
Conventional
25% down · 7.5% · 30yr
- Down + closing
- —
- Monthly P&I
- —
- Monthly cashflow
- —
- DSCR
- —
- Eligible?
- —
Personal DTI + credit; lowest rate.
DSCR
20% down · 8.5% · 30yr
- Down + closing
- —
- Monthly P&I
- —
- Monthly cashflow
- —
- DSCR
- —
- Eligible?
- —
No personal income docs; deal must DSCR.
Hard money
10% down · 12.0% · 12mo
- Down + closing
- —
- Monthly P&I
- —
- Monthly cashflow
- —
- DSCR
- —
- Eligible?
- —
Short-term bridge; refi at stabilization.
Rent comps 7 comps
| Address | Beds | Baths | Sqft | Rent | $/sqft | DOM | Units | Dist |
|---|---|---|---|---|---|---|---|---|
| 1726 Greenwood Cir Perry, GA | 3.0 | 2.0 | 1647 | $3,490 | $2.12 | 43d | 1 | 0.10mi |
| 1726 Greenwood Cir Perry, GA | 3.0 | 2.0 | 1647 | $3,490 | $2.12 | 20d | 1 | 0.11mi |
| 1739 Houston Lake Rd Perry, GA | 3.0 | 2.0 | 2163 | $1,895 | $0.88 | 43d | 1 | 0.13mi |
| 1115 Kingston Rd Perry, GA | 4.0 | 3.0 | 1740 | $2,000 | $1.15 | 20d | 1 | 0.75mi |
| 111 Judy Kay Way Perry, GA | 3.0 | 2.0 | 1759 | $2,000 | $1.14 | 20d | 1 | 0.93mi |
| 1215 Macon Rd Perry, GA | 3.0 | 2.5 | 1768 | $1,700 | $0.96 | 13d | 1 | 1.06mi |
| 215 Rainsong Trl Perry, GA | 4.0 | 2.0 | 1836 | $2,450 | $1.33 | 20d | 1 | 1.06mi |
Listing history 19 events
-
2026-06-19days on market $339,900 Active 19 DOM
-
2026-06-18days on market $339,900 Active 18 DOM
-
2026-06-17days on market $339,900 Active 17 DOM
-
2026-06-16days on market $339,900 Active 16 DOM
-
2026-06-15days on market $339,900 Active 15 DOM
-
2026-06-14days on market $339,900 Active 13 DOM
-
2026-06-13statusdays on market $339,900 Active 12 DOM
-
2026-06-10pricestatusdays on market $339,900 Price Change 10 DOM
-
2026-06-09days on market $349,900 New 9 DOM
-
2026-06-08days on market $349,900 New 8 DOM
-
2026-06-07days on market $349,900 New 7 DOM
-
2026-06-05days on market $349,900 New 4 DOM
-
2026-06-03days on market $349,900 New 3 DOM
-
2026-06-02days on market $349,900 New 2 DOM
-
2026-06-01remarks 699-char remark
-
2026-06-01statusdays on market $349,900 New 1 DOM
-
2026-05-31days on market $349,900 Active 2 DOM
-
2026-05-30remarks 693-char remark
-
2026-05-30$349,900 Active 1 DOM
ⓘ Source: listings_history table (triggers on properties + properties_extension) + one-shot
backfill from property_details.listing_events for pre-trigger history.
Tax reassessment forecast GA · Resets to sale price
- Current annual tax
- $1,388 · $116/mo
- Projected year-2 tax
- $3,127 · $261/mo
- Expected delta
- +$1,739/yr (+$145/mo · 125.4%)
ⓘ Screening estimate from a state-policy table — verify with the county assessor before closing.
Climate risk First Street
- Flood 1/10 Low FEMA zone X (unshaded) · 0% chance over 30 yrs
- Wildfire 2/10 Low
- Heat 7/10 Severe 7 d/yr ≥109°F today · 18 d/yr by 30 yrs out
- Wind 8/10 Severe 80% chance of damaging wind over 30 yrs
- Air quality 2/10 Low 2 unhealthy d/yr today · 2 by 30 yrs out
Nearby sold comps map
Loading sold comps map…
Walkable amenities ~0.75 mi
Loading nearby amenities…
Taxation est. · year 1
- Rental income
- $32,183
- − Mortgage interest
- −$19,040
- − Property taxes
- −$1,388
- − Insurance
- −$1,700
- − Repairs & maintenance
- −$2,575
- − Management
- −$2,575
- − Depreciation
- −$9,888
- Taxable loss
- −$4,981
- Est. tax savings @ 24.0%
- +$1,195
- After-tax cash flow
- $2,143/yr
For passive investors: Depreciation is non-cash, so a rental often shows a tax loss while cash-flowing — sheltering income. Rental losses are passive: they offset passive income freely, and up to $25,000/yr can offset ordinary (W-2) income if you actively participate and your MAGI is under $100k (phasing out to $0 by $150k); unused losses carry forward. On sale, claimed depreciation is recaptured at up to 25%, and gains may owe capital-gains tax (a 1031 exchange can defer both). Figures are a year-1 estimate at your 24.0% rate — not tax advice; consult a CPA.
Schools (NCES district)
- District
- Houston County
- NCES district ID
- 1302880
- Math proficiency
- 43% ▼ -7.00%
- Reading proficiency
- 46% ▼ -2.00%
- Median HH income
- $54,823
- Composite
- 38.68/100
- National rank
- #4144
- State rank
- #23 of 174 in GA
Livability — Perry
- Score
- 68/100
- State rank
- #149
- US rank
- #9757
Category grades
Schools grade is shown separately in the Schools card above.
Census & demographics
- Census place
- Perry, GA
- County
- Houston County · 157,321 people
- City population
- 22,953
- Metro
- Warner Robins, GA
- Population (ZIP)
- 22,953
- Household income
- $74,501
- Rent vs Own
- Severe rent burden
- 666.0
Population outlook (Houston County) Hauer SSP2
- Today (2025)
- 169,502 people
- By 2030
- 178,486 · +5.3%
- By 2040
- 194,642 · +14.8%
- By 2050
- 207,119 · +22.2%
- By 2075
- 231,480 · +36.6%
- By 2100
- 235,034 · +38.7%
Race, ethnicity, and origin ACS 2023
- Neighborhood character
- Majority White (64%)
- Race & ethnicity
- White 64% Black 24% Hispanic / Latino 4% Asian 3% Two or more races 3%
- Common ancestry
- Slovak 2% Romanian 1% Lithuanian 1%
- Foreign-born
- 4% · Canada, South Korea
- Languages at home
- 96% English-only · Spanish 2% Chinese 1%
Political lean MEDSL · Houston
- 2024 margin
- R (+11.3) · D 44.0% · R 55.3%
- 2008→2024 swing
- +8.9pp toward D · 2008: -20.2pp · 2024: -11.3pp
- All cycles
- 2024: R+11.3 2020: R+12.4 2016: R+21.6 2012: R+20.7 2008: R+20.2
Not yet ingested
- Civics
- —
Market trends
- HPI YoY
- ▼ -162.01%
- Current HPI
- 240.9327
- Rent YoY
- —
- Metro
- Warner Robins, GA
- State GDP YoY
- ▲ 2.66%
- F500 in state
- 28
Industry mix (Fortune 500 HQ in GA)
| Industry | F500 HQs | Revenue |
|---|---|---|
| Paper / Packaging | 2 | $29B |
|
||
| Retail | 1 | $160B |
|
||
| Transportation / Logistics | 1 | $91B |
|
||
| Airlines | 1 | $62B |
|
||
| Consumer Goods | 1 | $47B |
|
||
| Utilities | 1 | $25B |
|
||
Price history
+249.9% since first listed6 events — show timeline
- 2026-05-29 Listed $349,900 CGMLS
- 2017-02-10 Sold (Public Records) $115,000 Public Records
- 2017-02-08 Sold (MLS) $115,000 CGMLS
- 2016-11-03 Listed $124,900 CGMLS
- 1973-12-17 Sold (Public Records) $39,500 Public Records
- 1971-09-17 Sold (Public Records) $100,000 Public Records
Property tax history
+3.1%/yrLatest (2025): $1,388 · +10.3% YoY. Source: county tax records.
Cash-flow waterfall
monthlySold comps — $/sqft
last 12 mo · ≤1 miLoading sold comps…