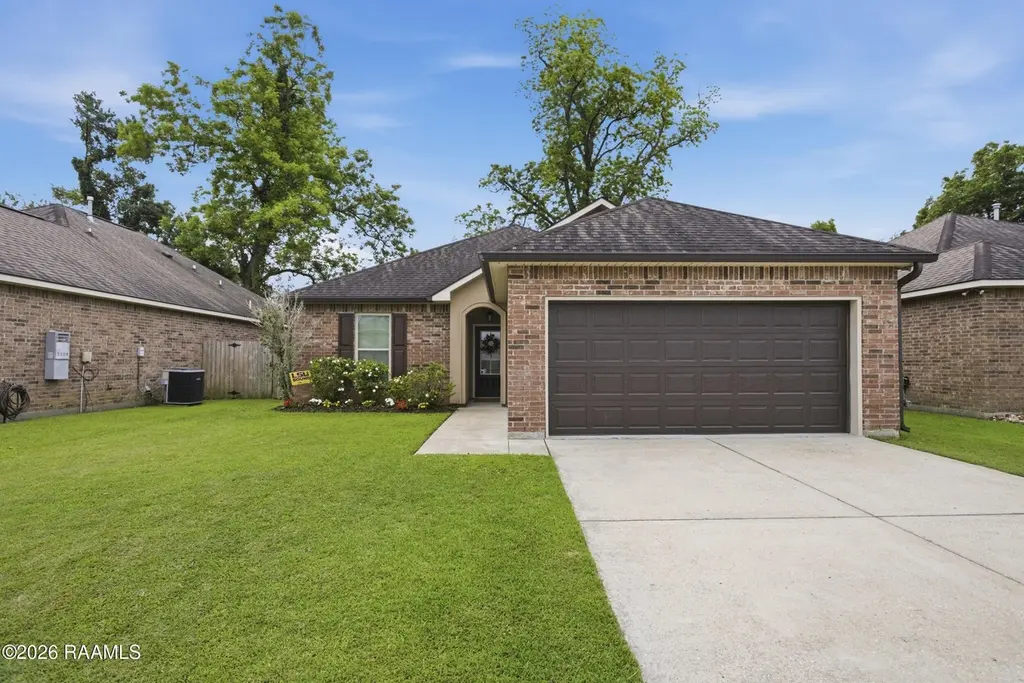
211 Moss Bluff Dr · Carencro, LA
Flood risk 1/10 · Minimal
- FEMA flood zone
- X (unshaded)
- Chance of flooding over 30 yrs
- 0.0%
- Est. flood insurance / yr
- $507 – $1,088
Fire risk 3/10 · Minor
- Est. fire insurance / yr
- $1,269 – $2,357
Heat risk 8/10 · Major
- Hot days now (above 108°F)
- 7 days/yr
- Hot days in 30 yrs
- 19 days/yr
Wind risk 9/10 · Severe
- Chance of severe wind over 30 yrs
- 99.0%
Air-quality risk 2/10 · Minimal
- Unhealthy air days now
- 1 days/yr
- Unhealthy air days in 30 yrs
- 1 days/yr
Risk factors via First Street. Map © Google.
Why this score? — see what drove the D- grade
The composite is a weighted blend of 9 inputs, each scored 0–100. Each bar is that input's sub-score; the figure is the points it added to the 100-point composite (weight × sub-score).
- ARV discount +11.3/15.0
- Cash flow +10.2/30.0
- Schools +3.6/10.0
- Livability +3.5/5.0
- DSCR +2.9/10.0
- 1% rule +2.5/10.0
- Rent growth +2.5/5.0
- Condition / age +2.5/5.0
- Appreciation +0.0/10.0
$220,000
🖨 Deal sheet 📄 Offer letter ✓ Due diligence
Listing remarks MLS
Welcome home to this beautifully maintained property offering 3 bedrooms, 2 bathrooms, and 1,456 square feet of thoughtfully designed living space. Featuring a desirable open, split floorplan, this home delivers functionality for comfortable everyday living.Step inside to a warm and inviting interior with wood flooring in the living area, ceramic tile in all wet spaces and entryways, and carpet in the bedrooms. The kitchen and bathrooms are finished with 3CM slab granite countertops, creating a clean and timeless look that complements the open layout, perfect for entertaining. The spacious primary suite includes a large walk-in closet and double vanities, offering a practical and comfortable retreat. Energy-efficient features such as double insulated windows, a tankless gas water heater, radiant barrier roof decking, and an insulated garage door help maximize efficiency and keep utility costs down.Step outside to enjoy a spacious, fully fenced backyard that's perfect for entertaining, pets, or simply unwinding at the end of the day.Situated in a welcoming community with amenities including a neighborhood pool and park, this home offers quick access to I-49 along with nearby shopping and dining. Thoughtfully designed and move-in ready, this home has features buyers are looking for without the wait of new construction.
Key facts
- 5,662 sq ft lot
- 2 garage spots
- Community pool
Neighborhood map
What this means for you Summary
Snapshot
- This is a 3-bed/2.0-bath single-family listed at $220k.
Deal economics
- At list price, monthly cash flow is $-125 ($-2k/yr) — negative.
- To cash-flow at today's rent, offer at most $198k (10.1% below list).
- To meet the 1% rule (rent ≥ 1% of price), the offer needs to be $165k (25.0% below list).
- Recommended offer: $165k (25.0% below list) — sets the bar for 1% rule.
Location & tenants
- Location reads 69/100 on livability (#65 in LA) — a middle-class / working-renter tenant base. Strengths: cost of living A+, housing A+, health & safety A+; Watch: schools C-, employment C-, crime D.
- Lafayette Parish (urban): math 38% / reading 46% proficiency, ranked #19 of 98 in LA (top 19%) — families likely to look elsewhere, expect single-tenant / working-renter base with shorter leases.
- Market conditions: 324 active listings in the ZIP; 3 comparable units currently listed for rent nearby; rentals lingering (median 44d on market — plan ~5-8 weeks vacancy on turnover, expect pricing pressure); 67% of comp listings sitting > 30 days — soft ceiling on asking rent; 1,585 units permitted in Lafayette Parish in 2024 (10 in 5+ unit buildings).
- This rent runs 31% of the median local income ($64k/yr) — at the standard rent-burdened threshold; future hikes will face affordability resistance.
Forward outlook
- Local home prices are declining (-3.0%/yr); year-one equity from $2k of loan paydown is wiped out by about $7k of value loss. Plan a longer hold.
- Lafayette County population projected at +34% by 2050 — long-run rental-demand tailwind backs the buy-and-hold thesis.
Negotiation context
- It's been on market 42 days — a 3% lower offer ($213k) is reasonable based on typical stale-listing flexibility.
- 2 sale attempts since 10y ago with the ask held roughly flat each time — persistent listings suggest the price (not the market) is what's stuck; bring a comps-based counter.
- Current owner paid $173k; 27% above their basis — modest negotiation headroom, anchor on the comps not their cost.
Risks & watch-outs
- Climate carrying-cost: severe wind risk, 99% chance of damaging wind over 30y; extreme-heat days projected 7→19/yr by 2055 (HVAC capex compounding) — expect insurance premiums to compound above CPI over the hold.
Questions for the listing agent
- What do current leases actually rent for vs. the listed asking? Can we see a recent rent roll and the last 12 months of T-12 income?
- It's been on market 42 days. Have you received any prior offers? Is the seller open to a 25% concession, seller financing, or rate buy-down credit?
- What does the HOA fee cover, when was the last increase, and are there any pending special assessments or reserve-fund shortfalls?
- Is there a deadline driving the sale (1031 exchange, divorce, estate, relocation)? That informs how much negotiation room exists.
- Crime grade is D in this area — have there been break-ins, vandalism, or insurance claims at this property in the last 3 years? What carrier currently insures it and at what premium?
- The area grade is low — what's the realistic commute time and amenity access for the typical tenant pool here? Any planned neighborhood developments (good or bad) we should know about?
- What's the average days-on-market for RENTAL listings here right now (not sales)? A rising rental-DOM trend means longer vacancies and softer asking-rent achievability than the comps imply.
- What's the recent tenant-quality profile in this submarket — average credit score on applications, eviction rate, late-payment / NSF rate, and stable-employment percentage? A property-management company in the area should have these aggregated.
- How much new for-sale + rental construction is in the pipeline within 1–3 miles? Heavy new supply typically softens prices + rents 12–24 months out; constrained supply supports both.
Investment metrics
- 1% rule
- 0.75% ✗
- Cap rate
- 5.61%
- Cash-on-cash
- -2.44%
- DSCR
- 0.89
- GRM
- 11.1
CMA / ARV
- ARV (median comp)
- $240,291
- List price
- $220,000
- Delta
- -8.44%
- Verdict
- FAIR
- Comps
- 20 within 1.0 mi
Show comp detail 12 sales within ~0.75 mi
| Address | Dist | Beds/Ba | Sqft | Sold | Price | $/sf | Match |
|---|---|---|---|---|---|---|---|
| 221 Burndap Way | 0.45mi | 3/2.0 | 1,495 (+1%) | 4mo | $219,500 | $147 | 75 |
| 532 Elwick Dr | 0.50mi | 3/2.0 | 1,495 (+1%) | 6mo | $221,000 | $148 | 70 |
| 526 Elwick Dr | 0.48mi | 3/2.0 | 1,463 (-2%) | 7mo | $220,000 | $150 | 70 |
| 115 Wickham St | 0.59mi | 3/2.0 | 1,463 (-2%) | 7mo | $223,840 | $153 | 64 |
| 319 Elwick Dr | 0.16mi | 3/2.0 | 1,689 (+14%) | 7mo | $215,000 | $127 | 63 |
| 208 Peppercorn Way | 0.64mi | 4/2.0 (+1) | 1,487 (+0%) | 4mo | $230,135 | $155 | 62 |
| 503 Schooner Bay Dr | 0.50mi | 3/2.0 | 1,616 (+9%) | 6mo | $234,500 | $145 | 57 |
| 218 Wickham St | 0.50mi | 3/2.0 | 1,689 (+14%) | 1mo | $240,813 | $143 | 53 |
| 224 Burndap Way | 0.49mi | 3/2.0 | 1,657 (+12%) | 6mo | $232,000 | $140 | 53 |
| 109 Wickham St | 0.65mi | 3/2.0 | 1,613 (+9%) | 6mo | $232,355 | $144 | 50 |
| 214 Naval St | 0.50mi | 3/2.0 | 1,689 (+14%) | 7mo | $241,705 | $143 | 48 |
| 106 Wickham St | 0.66mi | 3/2.0 | 1,689 (+14%) | 5mo | $239,350 | $142 | 42 |
Match score weights: distance 35% · size 25% · config 20% · recency 20%. Top-matched comps best support the ARV.
Projected returns pro-forma
-3.0% appreciation · 3.0% rent growth · sell at horizon
- IRR
- -20.4%
- Equity multiple
- 0.29×
- Total profit
- $-43,667
- Equity at exit
- $32,803
- IRR
- -13.5%
- Equity multiple
- 0.21×
- Total profit
- $-48,436
- Equity at exit
- $19,022
Cash invested: $61,600 (down + closing). Projections, not guarantees.
Landlord ↔ Tenant lean methodology
- Overall (STATE)
- 90 Strongly Landlord-Friendly
- State Louisiana
- 90 Strongly Landlord-Friendly · R+12
- County
- — inherits STATE
- City
- — inherits STATE
ZIP-level market 70507
- Home prices YoY
- -20.6%
- Active inventory
- 324
- Price-to-rent
- 11.1×
Monthly cashflow live
- Estimated rent
- $1,650 medium interval (Pro) →
- Mortgage (P&I)
- −$1,154
- Tax from tax record
- −$143 /mo · $1,721/yr
- Insurance
- −$92
- HOA
- −$40
- Vacancy / Maint / Mgmt
- −$346
- Net cashflow
- $-125
Break-even live
UW: 25.0% down · 7.5% · 30yr · 1.5% tax · 5.0% vac · 8.0% maint · 8.0% mgmt
Financing live
Cash to close
- Down payment
- $55,000
- Closing costs
- $6,600
- Reserves months
- —
- Total cash needed
- —
Loan-product check · same deal, 3 products live
Conventional
25% down · 7.5% · 30yr
- Down + closing
- —
- Monthly P&I
- —
- Monthly cashflow
- —
- DSCR
- —
- Eligible?
- —
Personal DTI + credit; lowest rate.
DSCR
20% down · 8.5% · 30yr
- Down + closing
- —
- Monthly P&I
- —
- Monthly cashflow
- —
- DSCR
- —
- Eligible?
- —
No personal income docs; deal must DSCR.
Hard money
10% down · 12.0% · 12mo
- Down + closing
- —
- Monthly P&I
- —
- Monthly cashflow
- —
- DSCR
- —
- Eligible?
- —
Short-term bridge; refi at stabilization.
Rent comps 3 comps
| Address | Beds | Baths | Sqft | Rent | $/sqft | DOM | Units | Dist |
|---|---|---|---|---|---|---|---|---|
| 417 Elwick Dr Lafayette, LA | 3.0 | 2.0 | 1463 | $1,650 | $1.13 | 20d | 1 | 0.35mi |
| 107 Trinidad Cir Lafayette, LA | 3.0 | 2.0 | 1197 | $1,150 | $0.96 | 43d | 1 | 0.89mi |
| 301 Nottingham Cir Lafayette, LA | 3.0 | 2.5 | 1833 | $1,600 | $0.87 | 43d | 1 | 1.38mi |
HOA detail
- Monthly dues
- $40 · $480/yr
- Likely covers
- watergaspool
Listing history 19 events
-
2026-06-18days on market $220,000 Active 42 DOM
-
2026-06-17days on market $220,000 Active 41 DOM
-
2026-06-16days on market $220,000 Active 40 DOM
-
2026-06-15days on market $220,000 Active 39 DOM
-
2026-06-14days on market $220,000 Active 37 DOM
-
2026-06-13days on market $220,000 Active 36 DOM
-
2026-06-10days on market $220,000 Active 34 DOM
-
2026-06-09days on market $220,000 Active 33 DOM
-
2026-06-08days on market $220,000 Active 32 DOM
-
2026-06-07days on market $220,000 Active 31 DOM
-
2026-06-05days on market $220,000 Active 28 DOM
-
2026-06-03days on market $220,000 Active 27 DOM
-
2026-06-02days on market $220,000 Active 26 DOM
-
2026-06-01days on market $220,000 Active 25 DOM
-
2026-05-31days on market $220,000 Active 24 DOM
-
2026-05-30days on market $220,000 Active 23 DOM
-
2026-05-08$220,000 Active 1338-char remark
Show marketing remark (1338 chars)
Welcome home to this beautifully maintained property offering 3 bedrooms, 2 bathrooms, and 1,456 square feet of thoughtfully designed living space. Featuring a desirable open, split floorplan, this home delivers functionality for comfortable everyday living.Step inside to a warm and inviting interior with wood flooring in the living area, ceramic tile in all wet spaces and entryways, and carpet in the bedrooms. The kitchen and bathrooms are finished with 3CM slab granite countertops, creating a clean and timeless look that complements the open layout, perfect for entertaining. The spacious primary suite includes a large walk-in closet and double vanities, offering a practical and comfortable retreat. Energy-efficient features such as double insulated windows, a tankless gas water heater, radiant barrier roof decking, and an insulated garage door help maximize efficiency and keep utility costs down.Step outside to enjoy a spacious, fully fenced backyard that's perfect for entertaining, pets, or simply unwinding at the end of the day.Situated in a welcoming community with amenities including a neighborhood pool and park, this home offers quick access to I-49 along with nearby shopping and dining. Thoughtfully designed and move-in ready, this home has features buyers are looking for without the wait of new construction.
-
2016-05-09soldstatus $172,900 689-char remark
Show marketing remark (689 chars)
BRAND NEW CONSTRUCTION AND ENERGY SMART HOME! DSLD HOMES' PLYMOUTH II B PLANOFFERS A SPACIOUS 3 BEDROOM, 2 FULL BATH OPEN FLOOR PLAN. SPECIAL FEATURES INCLUDE: WOOD FLOORS IN LIVING ROOM& CERAMIC TILE IN ALL WET AREAS AND ENTRYWAYS,CARPET IN BEDROOMS, 3CM SLAB GRANITE COUNTERTOPS IN KITCHEN ANDBATHS, FRIGIDAIRE APPLIANCES TO INCLUDE: MICRO-WAVE, DISHWASHER AND ELECTRIC RANGE/OVEN, LARGE WALK-IN CLOSET & DOUBLE VANITY IN MASTER BATHROOM, OIL RUBBED BRONZE LIGHTING AND PLUMBING FIXTURES, INSULATED GARAGE DOOR, TANKLESS GAS WATER HEATER, RADIANT BARRIER DECKING IN ATTIC, LOW E-3 DOUBLE INSULATED WINDOWS, SOD &LANDSCAPING, MAILBOX AND MUCH MORE. COMPLETION: EARLY MAY 2016!
-
2016-02-09$172,900 689-char remark
Show marketing remark (689 chars)
BRAND NEW CONSTRUCTION AND ENERGY SMART HOME! DSLD HOMES' PLYMOUTH II B PLANOFFERS A SPACIOUS 3 BEDROOM, 2 FULL BATH OPEN FLOOR PLAN. SPECIAL FEATURES INCLUDE: WOOD FLOORS IN LIVING ROOM& CERAMIC TILE IN ALL WET AREAS AND ENTRYWAYS,CARPET IN BEDROOMS, 3CM SLAB GRANITE COUNTERTOPS IN KITCHEN ANDBATHS, FRIGIDAIRE APPLIANCES TO INCLUDE: MICRO-WAVE, DISHWASHER AND ELECTRIC RANGE/OVEN, LARGE WALK-IN CLOSET & DOUBLE VANITY IN MASTER BATHROOM, OIL RUBBED BRONZE LIGHTING AND PLUMBING FIXTURES, INSULATED GARAGE DOOR, TANKLESS GAS WATER HEATER, RADIANT BARRIER DECKING IN ATTIC, LOW E-3 DOUBLE INSULATED WINDOWS, SOD &LANDSCAPING, MAILBOX AND MUCH MORE. COMPLETION: EARLY MAY 2016!
ⓘ Source: listings_history table (triggers on properties + properties_extension) + one-shot
backfill from property_details.listing_events for pre-trigger history.
Tax reassessment forecast LA · Resets to sale price
- Current annual tax
- $1,721 · $143/mo
- Projected year-2 tax
- $1,721 · $143/mo
- Expected delta
- $0/yr ($0/mo · 0.0%)
ⓘ Screening estimate from a state-policy table — verify with the county assessor before closing.
Climate risk First Street
- Flood 1/10 Low FEMA zone X (unshaded) · 0% chance over 30 yrs
- Wildfire 3/10 Moderate
- Heat 8/10 Severe 7 d/yr ≥108°F today · 19 d/yr by 30 yrs out
- Wind 9/10 Extreme 99% chance of damaging wind over 30 yrs
- Air quality 2/10 Low 1 unhealthy d/yr today · 1 by 30 yrs out
Nearby sold comps map
Loading sold comps map…
Walkable amenities ~0.75 mi
Loading nearby amenities…
Taxation est. · year 1
- Rental income
- $19,799
- − Mortgage interest
- −$12,323
- − Property taxes
- −$1,721
- − Insurance
- −$1,100
- − Repairs & maintenance
- −$1,584
- − Management
- −$1,584
- − HOA
- −$480
- − Depreciation
- −$6,400
- Taxable loss
- −$5,394
- Est. tax savings @ 24.0%
- +$1,295
- After-tax cash flow
- $-210/yr
For passive investors: Depreciation is non-cash, so a rental often shows a tax loss while cash-flowing — sheltering income. Rental losses are passive: they offset passive income freely, and up to $25,000/yr can offset ordinary (W-2) income if you actively participate and your MAGI is under $100k (phasing out to $0 by $150k); unused losses carry forward. On sale, claimed depreciation is recaptured at up to 25%, and gains may owe capital-gains tax (a 1031 exchange can defer both). Figures are a year-1 estimate at your 24.0% rate — not tax advice; consult a CPA.
Schools (NCES district)
- District
- Lafayette Parish
- NCES district ID
- 2200870
- Math proficiency
- 38% ▼ -32.00%
- Reading proficiency
- 46% ▼ -24.00%
- Median HH income
- $50,238
- Composite
- 36.15/100
- National rank
- #4741
- State rank
- #19 of 98 in LA
Livability — Carencro
- Score
- 69/100
- State rank
- #65
- US rank
- #8277
Category grades
Schools grade is shown separately in the Schools card above.
Census & demographics
- Census place
- Carencro, LA
- County
- Lafayette Parish · 207,544 people
- City population
- 20,134
- Metro
- Lafayette, LA
- Population (ZIP)
- 20,096
- Household income
- $64,049
- Rent vs Own
- Severe rent burden
- 503.0
Population outlook (Lafayette County) Hauer SSP2
- Today (2025)
- 280,930 people
- By 2030
- 301,092 · +7.2%
- By 2040
- 339,456 · +20.8%
- By 2050
- 375,156 · +33.5%
- By 2075
- 451,672 · +60.8%
- By 2100
- 497,203 · +77.0%
Race, ethnicity, and origin ACS 2023
- Neighborhood character
- Diverse neighborhood (Simpson 0.57)
- Race & ethnicity
- Black 47% White 45% Two or more races 6% Hispanic / Latino 3%
- Common ancestry
- Lithuanian 15%
- Foreign-born
- 2% · Canada
- Languages at home
- 94% English-only · French/Haitian/Cajun 4% Spanish 2%
Political lean MEDSL · Lafayette
- 2024 margin
- Solid R (+31.4) · D 33.5% · R 64.8% · Other 1.7%
- 2008→2024 swing
- -0.1pp no change · 2008: -31.3pp · 2024: -31.4pp
- All cycles
- 2024: R+31.4 2020: R+28.7 2016: R+33.6 2012: R+33.7 2008: R+31.3
Not yet ingested
- Civics
- —
Market trends
- HPI YoY
- ▼ -40.84%
- Current HPI
- 156.889
- Rent YoY
- —
- Metro
- Lafayette, LA
- State GDP YoY
- ▲ 3.29%
- F500 in state
- 10
Industry mix (Fortune 500 HQ in LA)
| Industry | F500 HQs | Revenue |
|---|---|---|
| Telecommunications | 2 | $23B |
|
||
| Utilities | 1 | $12B |
|
||
| Wholesale / Distribution | 1 | $5B |
|
||
| Advertising | 1 | $2B |
|
||
Price history
+27.2% since first listed3 events — show timeline
- 2026-05-08 Listed $220,000 AcadianaMLS
- 2016-05-09 Sold (MLS) $172,900 AcadianaMLS
- 2016-02-09 Listed $172,900 AcadianaMLS
Property tax history
+10.3%/yrLatest (2025): $1,721 · -1.3% YoY. Source: county tax records.
Cash-flow waterfall
monthlySold comps — $/sqft
last 12 mo · ≤1 miLoading sold comps…