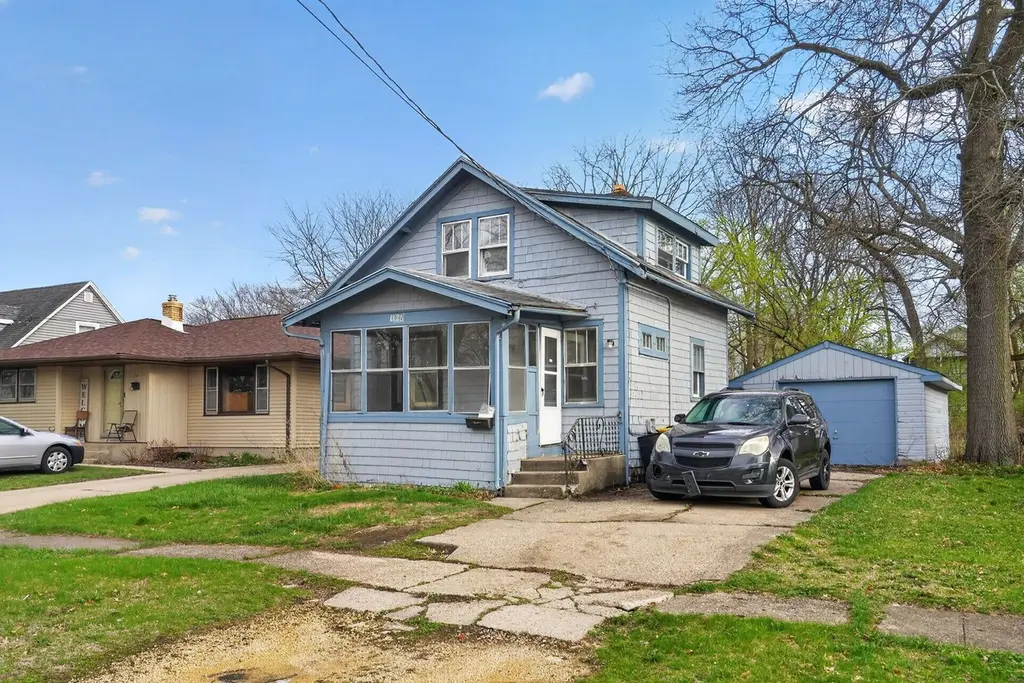
1126 Ashland Ave · Rockford, IL
Flood risk 1/10 · Minimal
- FEMA flood zone
- X (unshaded)
- Chance of flooding over 30 yrs
- 0.0%
- Est. flood insurance / yr
- $473 – $860
Fire risk 1/10 · Minimal
- Est. fire insurance / yr
- $804 – $1,492
Heat risk 2/10 · Minimal
- Hot days now (above 102°F)
- 7 days/yr
- Hot days in 30 yrs
- 15 days/yr
Wind risk 2/10 · Minimal
- Chance of severe wind over 30 yrs
- —
Air-quality risk 2/10 · Minimal
- Unhealthy air days now
- 1 days/yr
- Unhealthy air days in 30 yrs
- 2 days/yr
Risk factors via First Street. Map © Google.
Why this score? — see what drove the B grade
The composite is a weighted blend of 9 inputs, each scored 0–100. Each bar is that input's sub-score; the figure is the points it added to the 100-point composite (weight × sub-score).
- Cash flow +30.0/30.0
- ARV discount +11.7/15.0
- 1% rule +10.0/10.0
- DSCR +10.0/10.0
- Livability +3.1/5.0
- Rent growth +2.5/5.0
- Condition / age +2.5/5.0
- Schools +1.2/10.0
- Appreciation +0.0/10.0
$61,500
🖨 Deal sheet 📄 Offer letter ✓ Due diligence
Listing remarks MLS
Opportunity awaits at 1126 Ashland Ave! This classic 1.5-story home offers solid bones, timeless character, and a spacious layout ready for its next chapter. Featuring a bright main level with open living and dining areas, this home provides a great foundation to create your ideal space. The property includes generously sized bedrooms, a functional kitchen layout, full basement, enclosed front porch, and a detached garage. The large backyard offers plenty of room for outdoor enjoyment, expansion, or future improvements. This home will require repairs, updates, and overall improvement, and is priced accordingly to reflect the work needed. Ideal for buyers looking to build equity, renovate to their own style, or take on a project with strong upside potential. Conveniently located near schools, shopping, and major roadways, this property presents a great opportunity for those ready to bring their vision to life.
Key facts
- Large backyard
- Full basement
- Enclosed front porch
Tags
Neighborhood map
What this means for you Summary
Snapshot
- This is a 2-bed/1.0-bath single-family listed at $62k.
Deal economics
- At list price, monthly cash flow is $572 ($7k/yr) — positive.
- The deal already cash-flows at list — no discount required.
- Meets the 1% rule at list price ($1k rent vs $62k).
- Recommended offer: $60k (3.0% below list) — sets the bar for market timing.
- Cap rate 17.5% vs local median 6.1% in Rockford — top-decile yield for the area; either an underpriced asset or a hidden risk that comps aren't pricing in. Stress-test before assuming the spread holds.
Location & tenants
- Location reads 62/100 on livability (#876 in IL) — a middle-class / working-renter tenant base. Strengths: cost of living A+, housing A+, health & safety A+; Watch: schools F, crime F, amenities F.
- Rockford SD 205 (urban): math 12% / reading 16% proficiency, ranked #533 of 620 in IL (top 86%) — low school quality limits family demand, transient renter base, plan for 1-2y turnover; 73% free/reduced lunch — lower-income household profile, screen leases tightly.
- Market conditions: 76 active listings in the ZIP; 28 comparable units currently listed for rent nearby; rentals at typical pace (median 21d on market — plan ~3-4 weeks tenant-placement turnaround); 46% of comp listings sitting > 30 days — soft ceiling on asking rent; 285 units permitted in Winnebago County in 2024 (0 in 5+ unit buildings).
- This rent runs 33% of the median local income ($46k/yr) — at the standard rent-burdened threshold; future hikes will face affordability resistance.
Forward outlook
- Local home prices are declining (-3.0%/yr); year-one equity from $425 of loan paydown is wiped out by about $2k of value loss. Plan a longer hold.
- Winnebago County population projected at -20% by 2050 — secular population decline; favor cash flow + early exit over multi-decade hold.
- At projected returns (-3.0% appreciation + 3.0% rent growth), your $17k cash investment doubles in ~3 years — after that, you're playing with house money.
Negotiation context
- It's been on market 59 days — a 3% lower offer ($60k) is reasonable based on typical stale-listing flexibility.
- 3 sale attempts since 6y ago; this cycle's ask has dropped $24k (28%) from the opening price — seller is motivated, your offer sets the floor, not the list.
- Current owner paid $21k; list at $62k implies a 193% gain — meaningful room to come down on a strong offer.
Risks & watch-outs
- Watch-outs: built in 1926 — expect roof / HVAC / electrical / plumbing capex.
Questions for the listing agent
- It's been on market 59 days. Have you received any prior offers? Is the seller open to a 3% concession, seller financing, or rate buy-down credit?
- Built in 1926 — when were the roof, HVAC, electrical panel, plumbing, and water heater last replaced?
- Is there a deadline driving the sale (1031 exchange, divorce, estate, relocation)? That informs how much negotiation room exists.
- Schools are F-rated, which usually means shorter tenancies and higher turnover. Who's the typical renter profile here, and what's been the actual vacancy rate?
- Crime grade is F in this area — have there been break-ins, vandalism, or insurance claims at this property in the last 3 years? What carrier currently insures it and at what premium?
- What's the average days-on-market for RENTAL listings here right now (not sales)? A rising rental-DOM trend means longer vacancies and softer asking-rent achievability than the comps imply.
- What's the recent tenant-quality profile in this submarket — average credit score on applications, eviction rate, late-payment / NSF rate, and stable-employment percentage? A property-management company in the area should have these aggregated.
- How much new for-sale + rental construction is in the pipeline within 1–3 miles? Heavy new supply typically softens prices + rents 12–24 months out; constrained supply supports both.
Investment metrics
- 1% rule
- 2.03% ✓
- Cap rate
- 17.45%
- Cash-on-cash
- 39.86%
- DSCR
- 2.77
- GRM
- 4.1
CMA / ARV
- ARV (median comp)
- $67,784
- List price
- $61,500
- Delta
- -9.27%
- Verdict
- FAIR
- Comps
- 20 within 1.0 mi
Show comp detail 12 sales within ~0.75 mi
| Address | Dist | Beds/Ba | Sqft | Sold | Price | $/sf | Match |
|---|---|---|---|---|---|---|---|
| 902 N Horsman St | 0.51mi | 3/1.0 (+1) | 1,008 (-1%) | 0mo | $35,000 | $35 | 69 |
| 2828 Ridgeway Ave | 0.69mi | 2/1.0 | 1,009 (-1%) | 7mo | $90,000 | $89 | 60 |
| 444 Forest Ave | 0.27mi | 3/1.5 (+1) | 875 (-14%) | 5mo | $44,000 | $50 | 53 |
| 1619 Evergreen St | 0.58mi | 2/1.0 | 1,116 (+9%) | 8mo | $61,500 | $55 | 50 |
| 920 Oakley Ave | 0.41mi | 3/2.0 (+1) | 900 (-12%) | 3mo | $128,000 | $142 | 50 |
| 3529 Blackstone Ave | 0.70mi | 2/1.0 | 925 (-9%) | 3mo | $36,000 | $39 | 49 |
| 1611 N Horsman St | 0.61mi | 2/1.5 | 1,114 (+9%) | 7mo | $123,750 | $111 | 48 |
| 3208 Liberty Dr | 0.52mi | 3/1.0 (+1) | 1,148 (+12%) | 4mo | $123,000 | $107 | 46 |
| 2903 Yonge St | 0.57mi | 3/1.0 (+1) | 1,116 (+9%) | 11mo | $108,500 | $97 | 43 |
| 2928 Ridgeway Ave | 0.66mi | 3/1.0 (+1) | 936 (-8%) | 10mo | $119,900 | $128 | 42 |
| 2103 Sherman Ave | 0.69mi | 3/2.0 (+1) | 1,068 (+5%) | 12mo | $145,000 | $136 | 41 |
| 1029 Woodlawn Ave | 0.65mi | 3/1.0 (+1) | 1,121 (+10%) | 11mo | $70,666 | $63 | 39 |
Match score weights: distance 35% · size 25% · config 20% · recency 20%. Top-matched comps best support the ARV.
Projected returns pro-forma
-3.0% appreciation · 3.0% rent growth · sell at horizon
- IRR
- 36.2%
- Equity multiple
- 2.54×
- Total profit
- $26,475
- Equity at exit
- $9,170
- IRR
- 42.9%
- Equity multiple
- 5.07×
- Total profit
- $70,016
- Equity at exit
- $5,317
Cash invested: $17,220 (down + closing). Projections, not guarantees.
Landlord ↔ Tenant lean methodology
- Overall (STATE)
- 43 Moderately Tenant-Leaning
- State Illinois
- 43 Moderately Tenant-Leaning · D+7
- County
- — inherits STATE
- City
- — inherits STATE
ZIP-level market 61101
- Home prices YoY
- -25.4%
- Active inventory
- 76
- Price-to-rent
- 4.1×
Monthly cashflow live
- Estimated rent
- $1,251 high interval (Pro) →
- Mortgage (P&I)
- −$323
- Tax from tax record
- −$68 /mo · $820/yr
- Insurance
- −$26
- HOA
- −$0
- Vacancy / Maint / Mgmt
- −$263
- Net cashflow
- $572
Break-even live
UW: 25.0% down · 7.5% · 30yr · 1.5% tax · 5.0% vac · 8.0% maint · 8.0% mgmt
Financing live
Cash to close
- Down payment
- $15,375
- Closing costs
- $1,845
- Reserves months
- —
- Total cash needed
- —
Loan-product check · same deal, 3 products live
Conventional
25% down · 7.5% · 30yr
- Down + closing
- —
- Monthly P&I
- —
- Monthly cashflow
- —
- DSCR
- —
- Eligible?
- —
Personal DTI + credit; lowest rate.
DSCR
20% down · 8.5% · 30yr
- Down + closing
- —
- Monthly P&I
- —
- Monthly cashflow
- —
- DSCR
- —
- Eligible?
- —
No personal income docs; deal must DSCR.
Hard money
10% down · 12.0% · 12mo
- Down + closing
- —
- Monthly P&I
- —
- Monthly cashflow
- —
- DSCR
- —
- Eligible?
- —
Short-term bridge; refi at stabilization.
Rent comps 28 comps
| Address | Beds | Baths | Sqft | Rent | $/sqft | DOM | Units | Dist |
|---|---|---|---|---|---|---|---|---|
| 912 Furman St Rockford, IL | 2.0 | 1.0 | 1000 | $1,300 | $1.30 | 13d | 1 | 0.25mi |
| 418 Orchard Park Rockford, IL | 3.0 | 1.0 | 1232 | $1,500 | $1.22 | 13d | 1 | 0.37mi |
| 1510 School St Unit 1 Rockford, IL | 3.0 | 1.5 | 1400 | $1,200 | $0.86 | 43d | 1 | 0.38mi |
| 1116 Irving Ave Unit 1116-301 Rockford, IL | 2.0 | 1.0 | 800 | $950 | $1.19 | 21d | 1 | 0.42mi |
| 1617 Vermont St Rockford, IL | 2.0 | 1.0 | 1375 | $1,325 | $0.96 | 43d | 1 | 0.42mi |
| 1614 Pauline Ave Rockford, IL | 2.0 | 1.0 | 956 | $1,400 | $1.46 | 43d | 1 | 0.53mi |
| 924 N Sunset Ave Rockford, IL | 2.0 | 1.0 | 725 | $1,050 | $1.45 | 13d | 1 | 0.57mi |
| 2422 Benderwirt Ave Unit 2422-1 Rockford, IL | 2.0 | 1.0 | 1150 | $1,025 | $0.89 | 43d | 1 | 0.65mi |
| 2011 School St Rockford, IL | 3.0 | 1.0 | 950 | $1,500 | $1.58 | 43d | 1 | 0.65mi |
| 2305 School St Unit 2305-7 Rockford, IL | 2.0 | 1.0 | 875 | $995 | $1.14 | 43d | 1 | 0.83mi |
| 2330 Kilburn Ave Rockford, IL | 2.0–3.0 | 1.0–2.0 | 950 | $999 | $1.05 | 13d | 1 | 0.87mi |
| 1826 Green St Rockford, IL | 2.0 | 1.0 | 1000 | $1,300 | $1.30 | 21d | 1 | 0.94mi |
| 2008 Auburn St Unit 2008-1E Rockford, IL | 1.0 | 1.0 | 850 | $925 | $1.09 | 21d | 1 | 0.97mi |
| 2403 Elm St Rockford, IL | 2.0 | 1.0 | 1373 | $1,400 | $1.02 | 13d | 1 | 1.03mi |
| 2403 Elm St Rockford, IL | 2.0 | 1.0 | 1373 | $1,400 | $1.02 | 43d | 1 | 1.03mi |
| 920 N Church St Rockford, IL | 2.0 | 1.0 | 750 | $1,295 | $1.73 | 13d | 4 | 1.04mi |
| 1904 Auburn St Unit 1904-2 Rockford, IL | 1.0 | 1.0 | 700 | $950 | $1.36 | 44d | 1 | 1.04mi |
| 922 N Church St Rockford, IL | 2.0 | 2.0 | 1150 | $1,450 | $1.26 | 43d | 1 | 1.05mi |
| 1904 Auburn St Unit 1904-4 Rockford, IL | 2.0 | 1.0 | 800 | $1,050 | $1.31 | 43d | 1 | 1.05mi |
| 939 N Church St Unit 939-9 Rockford, IL | 1.0 | 1.0 | 750 | $925 | $1.23 | 43d | 1 | 1.10mi |
| 901 N Horace Ave Rockford, IL | 3.0 | 2.0 | 1400 | $1,700 | $1.21 | 13d | 1 | 1.12mi |
| 2315 Green St Rockford, IL | 3.0 | 1.0 | 1290 | $1,600 | $1.24 | 43d | 1 | 1.12mi |
| 929 N Main St Rockford, IL | 1.0 | 1.0 | 662 | $999 | $1.51 | 13d | 1 | 1.15mi |
| 913 N Main St Rockford, IL | 2.0 | 1.0–2.0 | 1050 | $2,300 | $2.19 | 21d | 1 | 1.17mi |
| 226 S Main St Rockford, IL | 1.0 | 1.0 | 1066 | $1,560 | $1.46 | 13d | 3 | 1.19mi |
| 203 Carlton Ter Rockford, IL | 2.0 | 1.0 | 900 | $1,250 | $1.39 | 21d | 1 | 1.22mi |
| 1121 N Church St Rockford, IL | 2.0 | 1.0 | 900 | $1,200 | $1.33 | 21d | 1 | 1.22mi |
| 1401 N Court St Rockford, IL | 2.0 | 1.0 | 850 | $950 | $1.12 | 43d | 1 | 1.24mi |
Listing history 28 events
-
2026-06-19days on market $61,500 Active 59 DOM
-
2026-06-18days on market $61,500 Active 58 DOM
-
2026-06-17days on market $61,500 Active 57 DOM
-
2026-06-17price $61,500 Active 56 DOM
-
2026-06-16days on market $67,500 Active 56 DOM
-
2026-06-15days on market $67,500 Active 55 DOM
-
2026-06-14days on market $67,500 Active 53 DOM
-
2026-06-13days on market $67,500 Active 52 DOM
-
2026-06-10days on market $67,500 Active 50 DOM
-
2026-06-09days on market $67,500 Active 49 DOM
-
2026-06-08days on market $67,500 Active 48 DOM
-
2026-06-07days on market $67,500 Active 47 DOM
-
2026-06-03days on market $67,500 Active 43 DOM
-
2026-06-02days on market $67,500 Active 42 DOM
-
2026-06-01days on market $67,500 Active 41 DOM
-
2026-05-31days on market $67,500 Active 40 DOM
-
2026-05-30days on market $67,500 Active 39 DOM
-
2026-05-12price $69,900 922-char remark
Show marketing remark (922 chars)
Opportunity awaits at 1126 Ashland Ave! This classic 1.5-story home offers solid bones, timeless character, and a spacious layout ready for its next chapter. Featuring a bright main level with open living and dining areas, this home provides a great foundation to create your ideal space. The property includes generously sized bedrooms, a functional kitchen layout, full basement, enclosed front porch, and a detached garage. The large backyard offers plenty of room for outdoor enjoyment, expansion, or future improvements. This home will require repairs, updates, and overall improvement, and is priced accordingly to reflect the work needed. Ideal for buyers looking to build equity, renovate to their own style, or take on a project with strong upside potential. Conveniently located near schools, shopping, and major roadways, this property presents a great opportunity for those ready to bring their vision to life.
-
2026-05-04price $75,000 922-char remark
Show marketing remark (922 chars)
Opportunity awaits at 1126 Ashland Ave! This classic 1.5-story home offers solid bones, timeless character, and a spacious layout ready for its next chapter. Featuring a bright main level with open living and dining areas, this home provides a great foundation to create your ideal space. The property includes generously sized bedrooms, a functional kitchen layout, full basement, enclosed front porch, and a detached garage. The large backyard offers plenty of room for outdoor enjoyment, expansion, or future improvements. This home will require repairs, updates, and overall improvement, and is priced accordingly to reflect the work needed. Ideal for buyers looking to build equity, renovate to their own style, or take on a project with strong upside potential. Conveniently located near schools, shopping, and major roadways, this property presents a great opportunity for those ready to bring their vision to life.
-
2026-04-21$85,000 Active 922-char remark
Show marketing remark (922 chars)
Opportunity awaits at 1126 Ashland Ave! This classic 1.5-story home offers solid bones, timeless character, and a spacious layout ready for its next chapter. Featuring a bright main level with open living and dining areas, this home provides a great foundation to create your ideal space. The property includes generously sized bedrooms, a functional kitchen layout, full basement, enclosed front porch, and a detached garage. The large backyard offers plenty of room for outdoor enjoyment, expansion, or future improvements. This home will require repairs, updates, and overall improvement, and is priced accordingly to reflect the work needed. Ideal for buyers looking to build equity, renovate to their own style, or take on a project with strong upside potential. Conveniently located near schools, shopping, and major roadways, this property presents a great opportunity for those ready to bring their vision to life.
-
2020-12-14soldstatus $21,000 Closed Sale 217-char remark
Show marketing remark (217 chars)
A cute smaller 2 bedroom 1 bath home with a garage on a 210 foot deep lot on a quiet dead-end street. Enclosed front porch, full basement, available with immediate possession. Has almost always been rented. Sold AS-IS
-
2020-12-14soldstatus $21,000
Show marketing remark (217 chars)
A cute smaller 2 bedroom 1 bath home with a garage on a 210 foot deep lot on a quiet dead-end street. Enclosed front porch, full basement, available with immediate possession. Has almost always been rented. Sold AS-IS
-
2020-12-07status Pending 217-char remark
Show marketing remark (217 chars)
A cute smaller 2 bedroom 1 bath home with a garage on a 210 foot deep lot on a quiet dead-end street. Enclosed front porch, full basement, available with immediate possession. Has almost always been rented. Sold AS-IS
-
2020-10-27price $24,500 217-char remark
Show marketing remark (217 chars)
A cute smaller 2 bedroom 1 bath home with a garage on a 210 foot deep lot on a quiet dead-end street. Enclosed front porch, full basement, available with immediate possession. Has almost always been rented. Sold AS-IS
-
2020-09-23$26,500 New 217-char remark
Show marketing remark (217 chars)
A cute smaller 2 bedroom 1 bath home with a garage on a 210 foot deep lot on a quiet dead-end street. Enclosed front porch, full basement, available with immediate possession. Has almost always been rented. Sold AS-IS
-
2020-09-23$24,500
Show marketing remark (217 chars)
A cute smaller 2 bedroom 1 bath home with a garage on a 210 foot deep lot on a quiet dead-end street. Enclosed front porch, full basement, available with immediate possession. Has almost always been rented. Sold AS-IS
-
2000-04-11soldstatus $10,000
-
1992-07-09soldstatus $9,000
ⓘ Source: listings_history table (triggers on properties + properties_extension) + one-shot
backfill from property_details.listing_events for pre-trigger history.
Tax reassessment forecast IL · Partial reset (capped growth)
- Current annual tax
- $820 · $68/mo
- Projected year-2 tax
- $1,108 · $92/mo
- Expected delta
- +$288/yr (+$24/mo · 35.2%)
ⓘ Screening estimate from a state-policy table — verify with the county assessor before closing.
Climate risk First Street
- Flood 1/10 Low FEMA zone X (unshaded) · 0% chance over 30 yrs
- Wildfire 1/10 Low
- Heat 2/10 Low 7 d/yr ≥102°F today · 15 d/yr by 30 yrs out
- Wind 2/10 Low
- Air quality 2/10 Low 1 unhealthy d/yr today · 2 by 30 yrs out
Nearby sold comps map
Loading sold comps map…
Walkable amenities ~0.75 mi
Loading nearby amenities…
Taxation est. · year 1
- Rental income
- $15,013
- − Mortgage interest
- −$3,445
- − Property taxes
- −$820
- − Insurance
- −$308
- − Repairs & maintenance
- −$1,201
- − Management
- −$1,201
- − Depreciation
- −$1,789
- Taxable income
- $6,250
- Est. tax owed @ 24.0%
- −$1,500
- After-tax cash flow
- $5,363/yr
For passive investors: Depreciation is non-cash, so a rental often shows a tax loss while cash-flowing — sheltering income. Rental losses are passive: they offset passive income freely, and up to $25,000/yr can offset ordinary (W-2) income if you actively participate and your MAGI is under $100k (phasing out to $0 by $150k); unused losses carry forward. On sale, claimed depreciation is recaptured at up to 25%, and gains may owe capital-gains tax (a 1031 exchange can defer both). Figures are a year-1 estimate at your 24.0% rate — not tax advice; consult a CPA.
Schools (NCES district)
- District
- Rockford SD 205
- NCES district ID
- 1734510
- Math proficiency
- 12% ▼ -2.00%
- Reading proficiency
- 16% ▼ -3.00%
- Median HH income
- $42,533
- Composite
- 12.21/100
- National rank
- #9649
- State rank
- #533 of 620 in IL
Livability — Rockford
- Score
- 62/100
- State rank
- #876
- US rank
- #17035
Category grades
Schools grade is shown separately in the Schools card above.
Census & demographics
- Census place
- Rockford, IL
- County
- Winnebago County · 147,297 people
- City population
- 147,297
- Metro
- Rockford, IL
- Population (ZIP)
- 19,318
- Household income
- $46,163
- Rent vs Own
- Severe rent burden
- 1170.0
Population outlook (Winnebago County) Hauer SSP2
- Today (2025)
- 271,080 people
- By 2030
- 260,684 · -3.8%
- By 2040
- 238,405 · -12.1%
- By 2050
- 216,129 · -20.3%
- By 2075
- 172,882 · -36.2%
- By 2100
- 135,336 · -50.1%
Race, ethnicity, and origin ACS 2023
- Neighborhood character
- Diverse neighborhood (Simpson 0.66)
- Race & ethnicity
- White 44% Black 34% Hispanic / Latino 16% Two or more races 8% Asian 1%
- Hispanic origin (detail)
- Mexican 14% Puerto Rican 1%
- Common ancestry
- Romanian 3% Italian 2% Portuguese 2%
- Foreign-born
- 9% · Canada
- Languages at home
- 84% English-only · Spanish 13% Other Indo-European 1% Russian/Polish/Slavic 1%
Political lean MEDSL · Winnebago
- 2024 margin
- Toss-up / Even · D 49.5% · R 49.0% · Other 1.5%
- 2008→2024 swing
- -12.2pp toward R · 2008: 12.8pp · 2024: 0.6pp
- All cycles
- 2024: D+0.6 2020: D+2.5 2016: R+1.2 2012: D+5.7 2008: D+12.8
Not yet ingested
- Civics
- —
Market trends
- HPI YoY
- ▼ -69.58%
- Current HPI
- 204.8946
- Rent YoY
- —
- Metro
- Rockford, IL
- State GDP YoY
- ▲ 1.59%
- F500 in state
- 60
Industry mix (Fortune 500 HQ in IL)
| Industry | F500 HQs | Revenue |
|---|---|---|
| Insurance | 4 | $201B |
|
||
| Consumer Goods | 4 | $87B |
|
||
| Industrial Machinery | 3 | $64B |
|
||
| Healthcare | 2 | $55B |
|
||
| Retail / Pharmacy | 1 | $148B |
|
||
| Agriculture / Food | 1 | $86B |
|
||
Price history
+676.7% since first listed11 events — show timeline
- 2026-05-12 Price Changed $69,900 MRED as Distributed by MLS Grid
- 2026-05-04 Price Changed $75,000 MRED as Distributed by MLS Grid
- 2026-04-21 Listed $85,000 MRED as Distributed by MLS Grid
- 2020-12-14 Sold (MLS) $21,000 MRED as Distributed by MLS Grid
- 2020-12-14 Sold (MLS) $21,000 NWIAR
- 2020-12-07 Pending — MRED as Distributed by MLS Grid
- 2020-10-27 Price Changed $24,500 MRED as Distributed by MLS Grid
- 2020-09-23 Listed $26,500 MRED as Distributed by MLS Grid
- 2020-09-23 Listed $24,500 NWIAR
- 2000-04-11 Sold (Public Records) $10,000 Public Records
- 1992-07-09 Sold (Public Records) $9,000 Public Records
Property tax history
-0.7%/yrLatest (2024): $820 · +3.5% YoY. Source: county tax records.
Cash-flow waterfall
monthlySold comps — $/sqft
last 12 mo · ≤1 miLoading sold comps…