2400 Bethany Church Rd · Princeton, KY
Flood risk 1/10 · Minimal
- FEMA flood zone
- X (unshaded)
- Chance of flooding over 30 yrs
- 0.0%
- Est. flood insurance / yr
- $473 – $860
Fire risk 3/10 · Minor
- Est. fire insurance / yr
- $839 – $1,559
Heat risk 5/10 · Moderate
- Hot days now (above 108°F)
- 7 days/yr
- Hot days in 30 yrs
- 20 days/yr
Wind risk 3/10 · Minor
- Chance of severe wind over 30 yrs
- 6.0%
Air-quality risk 1/10 · Minimal
- Unhealthy air days now
- 0 days/yr
- Unhealthy air days in 30 yrs
- 0 days/yr
Risk factors via First Street. Map © Google.
Why this score? — see what drove the B- grade
The composite is a weighted blend of 9 inputs, each scored 0–100. Each bar is that input's sub-score; the figure is the points it added to the 100-point composite (weight × sub-score).
- Cash flow +30.0/30.0
- 1% rule +10.0/10.0
- DSCR +10.0/10.0
- ARV discount +7.5/15.0
- Livability +3.8/5.0
- Schools +2.8/10.0
- Rent growth +2.5/5.0
- Condition / age +2.5/5.0
- Appreciation +0.0/10.0
$70,000
🖨 Deal sheet 📄 Offer letter ✓ Due diligence
Listing remarks MLS
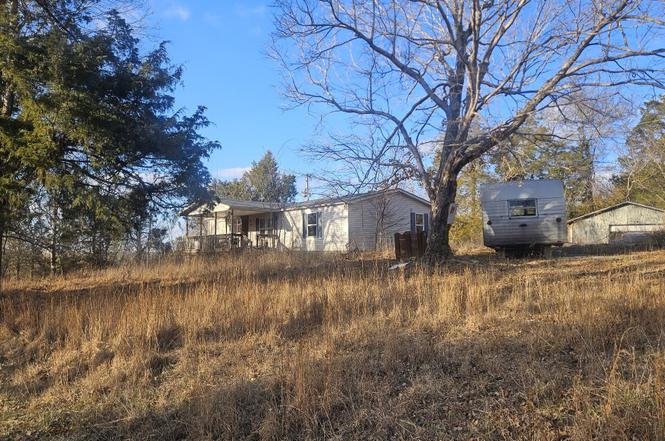
Opportunity awaits! This 0.38 acre rural property offers a country setting with utilities available at the road. The existing double-wide manufactured home is being sold as-is and could be renovated, repurposed, or removed to make way for a new build. Whether you're an investor, builder, or looking for an affordable homesite, this property offers flexibility and potential in a quiet location just outside Princeton.
Key facts
- Utilities available
- Quiet location
- 0.38 acre lot
Tags
Property features AI
Finance
- Financial info: Annual tax amount listed (not included per instructions)
- HOA & community: Pets allowed
Exterior
- Parking: No covered parking listed; No designated parking total listed
- Utilities: Electric service available; Private water; Private sewer
- Home design: Residential mobile home; One story
- Construction: Aluminum siding; Year built listed as approximate
- Exterior features: Private water source; Private sewer; Utilities: electricity available, water available; Lot approximately 0.38 acres
Interior
- Kitchen: No appliances listed
- Bedrooms: 3 bedrooms (all on the main level)
- Flooring: Laminate
- Bathrooms: 2 full bathrooms
- Heating & cooling: Electric heating; Central air conditioning
- Interior features: Laminate flooring; No basement
- Laundry & utility: No laundry appliances listed
Neighborhood map
What this means for you Summary
Snapshot
- This is a 3-bed/2.0-bath other listed at $70k.
Deal economics
- At list price, monthly cash flow is $542 ($7k/yr) — positive.
- The deal already cash-flows at list — no discount required.
- Meets the 1% rule at list price ($1k rent vs $70k).
- Recommended offer: $64k (9.0% below list) — sets the bar for market timing.
- Cap rate 15.6% vs local median 5.8% in Princeton — top-decile yield for the area; either an underpriced asset or a hidden risk that comps aren't pricing in. Stress-test before assuming the spread holds.
Location & tenants
- Location reads 76/100 on livability (#88 in KY, #3,490 nationally) — a middle-class / working-renter tenant base. Strengths: crime A+, cost of living A+, health & safety A+; Watch: employment D+, commute F.
- Caldwell County (rural): math 28% / reading 39% proficiency, ranked #78 of 165 in KY (top 47%) — families likely to look elsewhere, expect single-tenant / working-renter base with shorter leases.
- Zoned schools: Caldwell County Elementary School (math 30% / reading 36%, grade F, #338 of 676 statewide, top 50%, 403 students, 56% FRL); Caldwell County High School (math 32% / reading 37%, grade F, #76 of 254 statewide, top 34%, 544 students, 43% FRL) — zoned schools at 50% FRL track the district average.
- Market conditions: 55 active listings in the ZIP.
Forward outlook
- Local home prices are declining (-3.0%/yr); year-one equity from $484 of loan paydown is wiped out by about $2k of value loss. Plan a longer hold.
- Caldwell County population projected at -13% by 2050 — secular population decline; favor cash flow + early exit over multi-decade hold.
- At projected returns (-3.0% appreciation + 3.0% rent growth), your $20k cash investment doubles in ~4 years — after that, you're playing with house money.
Negotiation context
- It's been on market 111 days — a 9% lower offer ($64k) is reasonable based on typical stale-listing flexibility.
- 2 sale attempts with the ask held roughly flat each time — persistent listings suggest the price (not the market) is what's stuck; bring a comps-based counter.
- Current owner paid $50k; 40% above their basis — modest negotiation headroom, anchor on the comps not their cost.
Risks & watch-outs
- Climate carrying-cost: extreme-heat days projected 7→20/yr by 2055 (HVAC capex compounding) — expect insurance premiums to compound above CPI over the hold.
Questions for the listing agent
- It's been on market 111 days. Have you received any prior offers? Is the seller open to a 9% concession, seller financing, or rate buy-down credit?
- Why hasn't it sold? Are there any deal-killer items the seller is aware of (foundation, flood, title, zoning, code violations)?
- Is there a deadline driving the sale (1031 exchange, divorce, estate, relocation)? That informs how much negotiation room exists.
- Schools are D-rated, which usually means shorter tenancies and higher turnover. Who's the typical renter profile here, and what's been the actual vacancy rate?
- What's the average days-on-market for RENTAL listings here right now (not sales)? A rising rental-DOM trend means longer vacancies and softer asking-rent achievability than the comps imply.
- What's the recent tenant-quality profile in this submarket — average credit score on applications, eviction rate, late-payment / NSF rate, and stable-employment percentage? A property-management company in the area should have these aggregated.
- How much new for-sale + rental construction is in the pipeline within 1–3 miles? Heavy new supply typically softens prices + rents 12–24 months out; constrained supply supports both.
Investment metrics
- 1% rule
- 1.73% ✓
- Cap rate
- 15.58%
- Cash-on-cash
- 33.17%
- DSCR
- 2.48
- GRM
- 4.8
CMA / ARV
No comps found within radius.
Projected returns pro-forma
-3.0% appreciation · 3.0% rent growth · sell at horizon
- IRR
- 28.3%
- Equity multiple
- 2.18×
- Total profit
- $23,138
- Equity at exit
- $10,437
- IRR
- 35.8%
- Equity multiple
- 4.29×
- Total profit
- $64,479
- Equity at exit
- $6,052
Cash invested: $19,600 (down + closing). Projections, not guarantees.
Landlord ↔ Tenant lean methodology
- Overall (STATE)
- 83 Strongly Landlord-Friendly
- State Kentucky
- 83 Strongly Landlord-Friendly · R+16
- County
- — inherits STATE
- City
- — inherits STATE
ZIP-level market 42445
- Home prices YoY
- -7.9%
- Active inventory
- 55
- Price-to-rent
- 4.8×
Monthly cashflow live
- Estimated rent
- $1,209 medium interval (Pro) →
- Mortgage (P&I)
- −$367
- Tax from tax record
- −$17 /mo · $203/yr
- Insurance
- −$29
- HOA
- −$0
- Vacancy / Maint / Mgmt
- −$254
- Net cashflow
- $542
Break-even live
UW: 25.0% down · 7.5% · 30yr · 1.5% tax · 5.0% vac · 8.0% maint · 8.0% mgmt
Financing live
Cash to close
- Down payment
- $17,500
- Closing costs
- $2,100
- Reserves months
- —
- Total cash needed
- —
Loan-product check · same deal, 3 products live
Conventional
25% down · 7.5% · 30yr
- Down + closing
- —
- Monthly P&I
- —
- Monthly cashflow
- —
- DSCR
- —
- Eligible?
- —
Personal DTI + credit; lowest rate.
DSCR
20% down · 8.5% · 30yr
- Down + closing
- —
- Monthly P&I
- —
- Monthly cashflow
- —
- DSCR
- —
- Eligible?
- —
No personal income docs; deal must DSCR.
Hard money
10% down · 12.0% · 12mo
- Down + closing
- —
- Monthly P&I
- —
- Monthly cashflow
- —
- DSCR
- —
- Eligible?
- —
Short-term bridge; refi at stabilization.
Listing history 19 events
-
2026-06-18days on market $70,000 Active 111 DOM
-
2026-06-17days on market $70,000 Active 110 DOM
-
2026-06-16days on market $70,000 Active 109 DOM
-
2026-06-15days on market $70,000 Active 108 DOM
-
2026-06-13days on market $70,000 Active 106 DOM
-
2026-06-12days on market $70,000 Active 105 DOM
-
2026-06-09days on market $70,000 Active 102 DOM
-
2026-06-08days on market $70,000 Active 101 DOM
-
2026-06-07days on market $70,000 Active 100 DOM
-
2026-06-07days on market $70,000 Active 99 DOM
-
2026-06-04days on market $70,000 Active 96 DOM
-
2026-06-02days on market $70,000 Active 95 DOM
-
2026-06-01days on market $70,000 Active 94 DOM
-
2026-05-31days on market $70,000 Active 93 DOM
-
2026-05-31days on market $70,000 Active 92 DOM
-
2026-02-27$70,000 Active
-
2026-02-24$70,000 Active 418-char remark
Show marketing remark (418 chars)
Opportunity awaits! This 0.38 acre rural property offers a country setting with utilities available at the road. The existing double-wide manufactured home is being sold as-is and could be renovated, repurposed, or removed to make way for a new build. Whether you're an investor, builder, or looking for an affordable homesite, this property offers flexibility and potential in a quiet location just outside Princeton.
-
2015-04-08soldstatus $50,000
-
2000-09-01soldstatus $30,000
ⓘ Source: listings_history table (triggers on properties + properties_extension) + one-shot
backfill from property_details.listing_events for pre-trigger history.
Tax reassessment forecast KY · Resets to sale price
- Current annual tax
- $203 · $17/mo
- Projected year-2 tax
- $602 · $50/mo
- Expected delta
- +$399/yr (+$33/mo · 196.9%)
ⓘ Screening estimate from a state-policy table — verify with the county assessor before closing.
Climate risk First Street
- Flood 1/10 Low FEMA zone X (unshaded) · 0% chance over 30 yrs
- Wildfire 3/10 Moderate
- Heat 5/10 Major 7 d/yr ≥108°F today · 20 d/yr by 30 yrs out
- Wind 3/10 Moderate 6% chance of damaging wind over 30 yrs
- Air quality 1/10 Low 0 unhealthy d/yr today · 0 by 30 yrs out
Nearby sold comps map
Loading sold comps map…
Walkable amenities ~0.75 mi
Loading nearby amenities…
Taxation est. · year 1
- Rental income
- $14,505
- − Mortgage interest
- −$3,921
- − Property taxes
- −$203
- − Insurance
- −$350
- − Repairs & maintenance
- −$1,160
- − Management
- −$1,160
- − Depreciation
- −$2,036
- Taxable income
- $5,674
- Est. tax owed @ 24.0%
- −$1,362
- After-tax cash flow
- $5,140/yr
For passive investors: Depreciation is non-cash, so a rental often shows a tax loss while cash-flowing — sheltering income. Rental losses are passive: they offset passive income freely, and up to $25,000/yr can offset ordinary (W-2) income if you actively participate and your MAGI is under $100k (phasing out to $0 by $150k); unused losses carry forward. On sale, claimed depreciation is recaptured at up to 25%, and gains may owe capital-gains tax (a 1031 exchange can defer both). Figures are a year-1 estimate at your 24.0% rate — not tax advice; consult a CPA.
Schools (NCES district)
- District
- Caldwell County
- NCES district ID
- 2100840
- Math proficiency
- 28% ▼ -29.00%
- Reading proficiency
- 39% ▼ -19.00%
- Median HH income
- $40,080
- Composite
- 28.12/100
- National rank
- #6819
- State rank
- #78 of 165 in KY
Livability — Princeton
- Score
- 76/100
- State rank
- #88
- US rank
- #3490
Category grades
Schools grade is shown separately in the Schools card above.
Census & demographics
- Population (ZIP)
- 10,371
Population outlook (Caldwell County) Hauer SSP2
- Today (2025)
- 12,100 people
- By 2030
- 11,739 · -3.0%
- By 2040
- 11,088 · -8.4%
- By 2050
- 10,543 · -12.9%
- By 2075
- 9,406 · -22.3%
- By 2100
- 8,084 · -33.2%
Race, ethnicity, and origin ACS 2023
- Neighborhood character
- Predominantly White (88%)
- Race & ethnicity
- White 88% Black 6% Hispanic / Latino 3% Two or more races 3%
- Common ancestry
- Italian 3% Serbian 1% Slovak 1%
- Foreign-born
- 3% · Canada
- Languages at home
- 97% English-only · Spanish 2% German/W. Germanic 1%
Political lean MEDSL · Caldwell
- 2024 margin
- Solid R (+58.2) · D 20.3% · R 78.5% · Other 1.2%
- 2008→2024 swing
- -31.6pp toward R · 2008: -26.7pp · 2024: -58.2pp
- All cycles
- 2024: R+58.2 2020: R+54.0 2016: R+54.4 2012: R+35.0 2008: R+26.7
Not yet ingested
- Civics
- —
Market trends
- HPI YoY
- ▼ -20.07%
- Current HPI
- 232.7067
- Rent YoY
- —
- Metro
- —
- State GDP YoY
- ▲ 1.81%
- F500 in state
- 4
Industry mix (Fortune 500 HQ in KY)
| Industry | F500 HQs | Revenue |
|---|---|---|
| Healthcare | 1 | $118B |
|
||
| Food / Beverage | 1 | $7B |
|
||
Price history
+133.3% since first listed4 events — show timeline
- 2026-02-27 Listed $70,000 REALTRACS as Distributed by MLS Grid
- 2026-02-24 Listed $70,000 HCTCBOR
- 2015-04-08 Sold (Public Records) $50,000 Public Records
- 2000-09-01 Sold (Public Records) $30,000 Public Records
Property tax history
-5.9%/yrLatest (2025): $203 · -50.2% YoY. Source: county tax records.
Cash-flow waterfall
monthlySold comps — $/sqft
last 12 mo · ≤1 miLoading sold comps…