 5-Plex
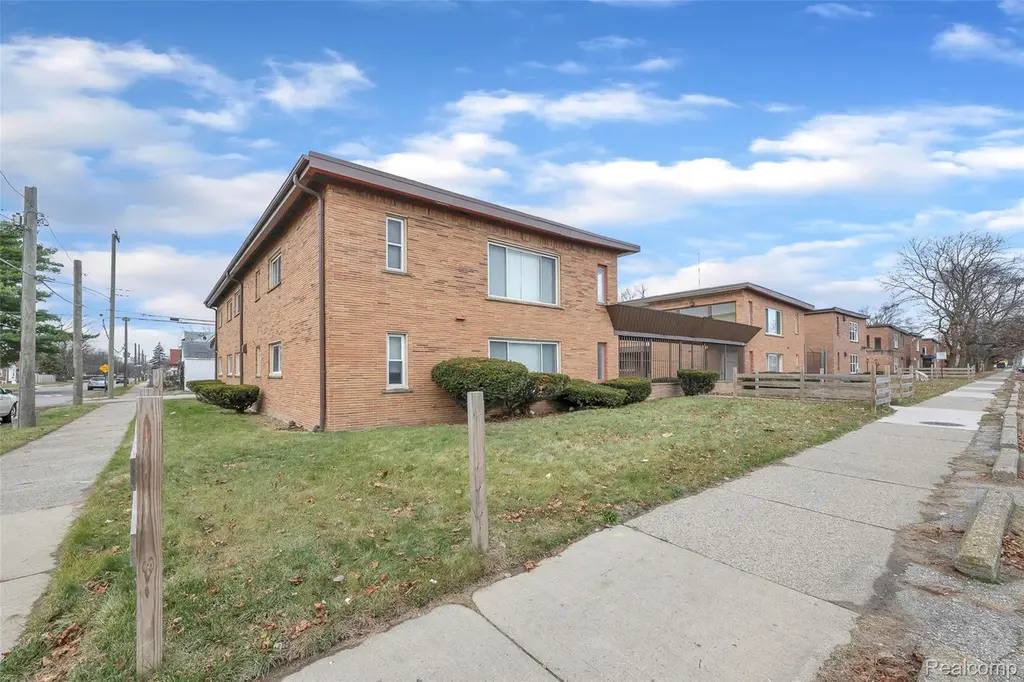
16701 Greenfield Rd · Detroit, MI
Flood risk 1/10 · Minimal
- FEMA flood zone
- X (unshaded)
- Chance of flooding over 30 yrs
- 0.0%
- Est. flood insurance / yr
- $473 – $860
Fire risk 1/10 · Minimal
- Est. fire insurance / yr
- $784 – $1,456
Heat risk 3/10 · Minor
- Hot days now (above 98°F)
- 7 days/yr
- Hot days in 30 yrs
- 15 days/yr
Wind risk 2/10 · Minimal
- Chance of severe wind over 30 yrs
- —
Air-quality risk 3/10 · Minor
- Unhealthy air days now
- 2 days/yr
- Unhealthy air days in 30 yrs
- 5 days/yr
Risk factors via First Street. Map © Google.
Why this score? — see what drove the B- grade
The composite is a weighted blend of 9 inputs, each scored 0–100. Each bar is that input's sub-score; the figure is the points it added to the 100-point composite (weight × sub-score).
- Cash flow +30.0/30.0
- 1% rule +10.0/10.0
- DSCR +10.0/10.0
- ARV discount +7.5/15.0
- Condition / age +3.8/5.0
- Livability +3.7/5.0
- Rent growth +3.3/5.0
- Schools +1.3/10.0
- Appreciation +0.0/10.0
$456,000
🖨 Deal sheet (PDF) 📄 Offer letter ✓ Due diligence
Multi-family units
County records classify this as Multi-Family (5+ Unit). Listing-text estimate: 5 units. confirmed
5+ unit building — per-unit beds/baths from public records are typically unavailable; the breakdown below (if shown) is an estimate from the listing text.
Listing remarks MLS
PRICED TO SELL. SELLER IS OPEN TO LAND CONTRACT TERMS WITH 30% DOWN. great properties in upcoming Greenfield/ W McNichols community. Many units are already turned with new vinyl floors and kitchens. Boiler and hot water tanks are in great shape. Property is already professionally managed.
Key facts
- 0.31 acre lot
- Built 1954
- Listed 16 days
Property features AI
Finance
- Financial info: Annual tax amount reported
Exterior
- Utilities: Sewer available; Water available
- Home design: Multi-family residential income property; Two stories
- Construction: Brick construction; Brick/mortar foundation; Built on two levels
- Exterior features: Paved road access; Pets allowed (contact for details)
Interior
- Bathrooms: 12 full bathrooms
- Heating & cooling: Natural gas heating; Radiant heating; No cooling
- Interior features: Unfinished basement
Neighborhood map
What this means for you Summary
Snapshot
- This is a 5 × 3-bed/2.4-bath units multifamily listed at $456k. Condition is rated good.
Deal economics
- At list price, monthly cash flow is $3k ($37k/yr) — positive. Per door: $623/mo.
- The deal already cash-flows at list — no discount required.
- Meets the 1% rule at list price ($8k rent vs $456k).
- Recommended offer: $449k (1.5% below list) — sets the bar for market timing.
- Cap rate 14.5% vs local median 10.0% in Detroit — top-decile yield for the area; either an underpriced asset or a hidden risk that comps aren't pricing in. Stress-test before assuming the spread holds.
Location & tenants
- Location reads 73/100 on livability (#218 in MI) — a middle-class / working-renter tenant base. Strengths: amenities A+, commute A+, cost of living A+; Watch: schools F, crime F, employment F.
- Detroit Public Schools Community District (urban): math 10% / reading 24% proficiency, ranked #499 of 540 in MI (top 92%) — low school quality limits family demand, transient renter base, plan for 1-2y turnover; 90% free/reduced lunch — lower-income household profile, screen leases tightly.
- Market conditions: Rents rising (+3.2%/yr); 291 active listings in the ZIP; lower-income renter base — watch delinquency; 2,639 units permitted in Wayne County in 2024 (1,216 in 5+ unit buildings).
- At $7,931/mo this rent would consume 242% of the median local household income ($39k/yr) (locally 3064% of renters already pay >50% of income on rent) — very limited rent-growth headroom before tenants either downsize or default.
Forward outlook
- Local home prices are declining (-3.0%/yr); year-one equity from $3k of loan paydown is wiped out by about $14k of value loss. Plan a longer hold.
- Wayne County population projected at -17% by 2050 — secular population decline; favor cash flow + early exit over multi-decade hold.
- At projected returns (-3.0% appreciation + 3.2% rent growth), your $128k cash investment doubles in ~5 years — after that, you're playing with house money.
Negotiation context
- It's been on market 16 days — a 2% lower offer ($449k) is reasonable based on typical stale-listing flexibility.
- 10 sale attempts since 16y ago with the ask held roughly flat each time — persistent listings suggest the price (not the market) is what's stuck; bring a comps-based counter.
- Current owner paid $77k; list at $456k implies a 492% gain — meaningful room to come down on a strong offer.
Risks & watch-outs
- Watch-outs: built in 1954 — expect roof / HVAC / electrical / plumbing capex.
Questions for the listing agent
- Can we see the unit-by-unit rent roll, current vacancy, and any below-market leases? What's the average tenancy length?
- What capital expenditures (roof, boiler, parking lot, exteriors) have been made in the last 5 years, and what's planned in the next 2?
- Built in 1954 — when were the roof, HVAC, electrical panel, plumbing, and water heater last replaced?
- Is there a deadline driving the sale (1031 exchange, divorce, estate, relocation)? That informs how much negotiation room exists.
- Schools are F-rated, which usually means shorter tenancies and higher turnover. Who's the typical renter profile here, and what's been the actual vacancy rate?
- Crime grade is F in this area — have there been break-ins, vandalism, or insurance claims at this property in the last 3 years? What carrier currently insures it and at what premium?
- What's the average days-on-market for RENTAL listings here right now (not sales)? A rising rental-DOM trend means longer vacancies and softer asking-rent achievability than the comps imply.
- What's the recent tenant-quality profile in this submarket — average credit score on applications, eviction rate, late-payment / NSF rate, and stable-employment percentage? A property-management company in the area should have these aggregated.
- How much new apartment / multifamily construction is in the pipeline within 1–3 miles? Heavy new supply (>2% of stock underway) typically softens rents 12–24 months out; light construction supports rent growth.
Investment metrics
- 1% rule
- 1.74% ✓
- Cap rate
- 14.49%
- Cash-on-cash
- 29.27%
- DSCR
- 2.30
- GRM
- 4.8
CMA / ARV
No comps found within radius.
Projected returns pro-forma
-3.0% appreciation · 3.25% rent growth · sell at horizon
- IRR
- 24.0%
- Equity multiple
- 1.99×
- Total profit
- $126,572
- Equity at exit
- $67,991
- IRR
- 32.0%
- Equity multiple
- 3.93×
- Total profit
- $374,350
- Equity at exit
- $39,427
Cash invested: $127,680 (down + closing). Projections, not guarantees.
Landlord ↔ Tenant lean methodology
- Overall (STATE)
- 62 Landlord-Friendly
- State Michigan
- 62 Landlord-Friendly · EVEN
- County
- — inherits STATE
- City
- — inherits STATE
ZIP-level market 48235
- Rents YoY
- 3.2%
- Active inventory
- 291
- Price-to-rent
- 24.0×
Monthly cashflow live
- Estimated rent
- $7,931 high interval (Pro) →
- Mortgage (P&I)
- −$2,391
- Tax est. 1.5%
- −$570 /mo · $6,840/yr
- Insurance
- −$190
- HOA
- −$0
- Vacancy / Maint / Mgmt
- −$1,666
- Net cashflow
- $3,114
Break-even live
Sensitivity live
| Price | -10% $3,429 | -5% $3,272 | +0% $3,114 | +5% $2,957 | +10% $2,799 |
|---|---|---|---|---|---|
| Rent | -10% $2,488 | -5% $2,801 | +0% $3,114 | +5% $3,427 | +10% $3,741 |
| Rate | -1.0pp $3,344 | -0.5pp $3,230 | base $3,114 | +0.5pp $2,996 | +1.0pp $2,876 |
5-unit breakdown (identical units grouped — click to expand)
| Units | Beds | Baths | Est. rent |
|---|---|---|---|
| 5× units | 3 | 2.4 | $7,930 |
| #1 | 3 | 2.4 | $1,586 |
| #2 | 3 | 2.4 | $1,586 |
| #3 | 3 | 2.4 | $1,586 |
| #4 | 3 | 2.4 | $1,586 |
| #5 | 3 | 2.4 | $1,586 |
| Total (5 units) | $7,931 | ||
UW: 25.0% down · 7.5% · 30yr · 1.5% tax · 5.0% vac · 8.0% maint · 8.0% mgmt
Financing live
Cash to close
- Down payment
- $114,000
- Closing costs
- $13,680
- Reserves months
- —
- Total cash needed
- —
Loan-product check · same deal, 3 products live
Conventional
25% down · 7.5% · 30yr
- Down + closing
- —
- Monthly P&I
- —
- Monthly cashflow
- —
- DSCR
- —
- Eligible?
- —
Personal DTI + credit; lowest rate.
DSCR
20% down · 8.5% · 30yr
- Down + closing
- —
- Monthly P&I
- —
- Monthly cashflow
- —
- DSCR
- —
- Eligible?
- —
No personal income docs; deal must DSCR.
Hard money
10% down · 12.0% · 12mo
- Down + closing
- —
- Monthly P&I
- —
- Monthly cashflow
- —
- DSCR
- —
- Eligible?
- —
Short-term bridge; refi at stabilization.
Listing history 11 events
-
2026-06-21days on market $456,000 Active 16 DOM
-
2026-06-18days on market $456,000 Active 13 DOM
-
2026-06-17days on market $456,000 Active 12 DOM
-
2026-06-16days on market $456,000 Active 11 DOM
-
2026-06-15days on market $456,000 Active 10 DOM
-
2026-06-13days on market $456,000 Active 8 DOM
-
2026-06-13days on market $456,000 Active 7 DOM
-
2026-06-09days on market $456,000 Active 4 DOM
-
2026-06-08days on market $456,000 Active 3 DOM
-
2026-06-07remarks 289-char remark
-
2026-06-07$456,000 Active 2 DOM
ⓘ Source: listings_history table (triggers on properties + properties_extension) + one-shot
backfill from property_details.listing_events for pre-trigger history.
Climate risk First Street
- Flood 1/10 Low FEMA zone X (unshaded) · 0% chance over 30 yrs
- Wildfire 1/10 Low
- Heat 3/10 Moderate 7 d/yr ≥98°F today · 15 d/yr by 30 yrs out
- Wind 2/10 Low
- Air quality 3/10 Moderate 2 unhealthy d/yr today · 5 by 30 yrs out
Nearby sold comps map
Loading sold comps map…
Walkable amenities ~0.75 mi
Loading nearby amenities…
Taxation est. · year 1
- Rental income
- $95,172
- − Mortgage interest
- −$25,543
- − Property taxes
- −$6,840
- − Insurance
- −$2,280
- − Repairs & maintenance
- −$7,614
- − Management
- −$7,614
- − Depreciation
- −$13,265
- Taxable income
- $32,016
- Est. tax owed @ 24.0%
- −$7,684
- After-tax cash flow
- $29,686/yr
For passive investors: Depreciation is non-cash, so a rental often shows a tax loss while cash-flowing — sheltering income. Rental losses are passive: they offset passive income freely, and up to $25,000/yr can offset ordinary (W-2) income if you actively participate and your MAGI is under $100k (phasing out to $0 by $150k); unused losses carry forward. On sale, claimed depreciation is recaptured at up to 25%, and gains may owe capital-gains tax (a 1031 exchange can defer both). Figures are a year-1 estimate at your 24.0% rate — not tax advice; consult a CPA.
Condition & rehab AI · 13 photos
This multi-family property is in good condition with minimal repairs needed. It is already professionally managed and has been updated with new vinyl floors and kitchens, making it a solid investment opportunity.
Value-add opportunities
- Both Painting the exterior and interior walls — Fresh paint enhances curb appeal and interior aesthetics, attracting both buyers and renters.
- Both Landscaping and trimming the yard — A well-maintained yard improves curb appeal and can attract more potential buyers and renters.
Renovation cost estimate screening
Value-add ROI direction
- Both Painting the exterior and interior walls — Fresh paint enhances curb appeal and interior aesthetics, attracting both buyers and renters. ↑
- Both Landscaping and trimming the yard — A well-maintained yard improves curb appeal and can attract more potential buyers and renters. ↑
ⓘ Cost ranges are severity-bucket heuristics (US national rule-of-thumb). Get contractor quotes + a written scope before underwriting a rehab budget.
Schools (NCES district)
- District
- Detroit Public Schools Community District
- NCES district ID
- 2601103
- Math proficiency
- 10% ▼ -2.00%
- Reading proficiency
- 24% ▲ 6.00%
- Median HH income
- $25,815
- Composite
- 13.06/100
- National rank
- #9564
- State rank
- #499 of 540 in MI
Livability — Detroit
- Score
- 73/100
- State rank
- #218
- US rank
- #5427
Category grades
Schools grade is shown separately in the Schools card above.
Census & demographics
- Census place
- Detroit, MI
- County
- Wayne County · 1,562,939 people
- City population
- 572,865
- Metro
- Detroit-Warren-Dearborn, MI
- Population (ZIP)
- 45,600
- Household income
- $39,265
- Rent vs Own
- Severe rent burden
- 3064.0
Population outlook (Wayne County) Hauer SSP2
- Today (2025)
- 1,675,273 people
- By 2030
- 1,620,300 · -3.3%
- By 2040
- 1,502,341 · -10.3%
- By 2050
- 1,384,039 · -17.4%
- By 2075
- 1,124,592 · -32.9%
- By 2100
- 881,193 · -47.4%
Race, ethnicity, and origin ACS 2023
- Neighborhood character
- Predominantly Black (94%)
- Race & ethnicity
- Black 94% White 3% Two or more races 2% Hispanic / Latino 1%
- Foreign-born
- 1% · Canada
- Languages at home
- 98% English-only · Spanish 1%
Political lean MEDSL · Wayne
- 2024 margin
- Strong D (+29.0) · D 62.7% · R 33.7% · Other 3.6%
- 2008→2024 swing
- -20.5pp toward R · 2008: 49.5pp · 2024: 29.0pp
- All cycles
- 2024: D+29.0 2020: D+38.1 2016: D+37.3 2012: D+46.9 2008: D+49.5
Not yet ingested
- Civics
- —
Market trends
- HPI YoY
- ▼ -153.02%
- Current HPI
- 263.6326
- Rent YoY
- ▲ 3.25%
- Metro
- Detroit-Warren-Dearborn, MI
- State GDP YoY
- ▲ 1.37%
- F500 in state
- 28
Industry mix (Fortune 500 HQ in MI)
| Industry | F500 HQs | Revenue |
|---|---|---|
| Automotive Parts | 3 | $48B |
|
||
| Automotive | 2 | $372B |
|
||
| Chemicals | 1 | $45B |
|
||
| Automotive Retail | 1 | $29B |
|
||
| Healthcare / Medical Devices | 1 | $23B |
|
||
| Automotive Technology | 1 | $20B |
|
||
Price history
+314.5% since first listed19 events — show timeline
- 2026-06-05 Listed $456,000 REALCOMP
- 2026-06-05 Listed $456,000 MiRealSource-MiMLS
- 2026-01-16 Rental Removed $820 REALCOMP
- 2025-06-14 Price Changed $820 REALCOMP
- 2025-03-29 Listed for Rent $920 REALCOMP
- 2025-03-25 Rental Removed $920 REALSOURCE
- 2025-02-21 Listed for Rent $920 REALSOURCE
- 2025-02-14 Rental Removed $920 REALCOMP
- 2025-01-17 Listed for Rent $920 REALCOMP
- 2015-05-12 Listing Removed — MiRealSource-MiMLS
- 2015-03-20 Listed $250,000 MiRealSource-MiMLS
- 2014-05-20 Listing Removed — MiRealSource-MiMLS
- 2013-11-20 Listed $204,000 MiRealSource-MiMLS
- 2013-03-19 Listing Removed — MiRealSource-MiMLS
- 2012-02-23 Listed $198,000 MiRealSource-MiMLS
- 2011-12-07 Listing Removed — MiRealSource-MiMLS
- 2011-09-19 Listed $269,900 MiRealSource-MiMLS
- 2011-03-31 Sold (MLS) $77,000 MiRealSource-MiMLS
- 2010-10-27 Listed $110,000 MiRealSource-MiMLS
Cash-flow waterfall
monthlySold comps — $/sqft
last 12 mo · ≤1 miLoading sold comps…