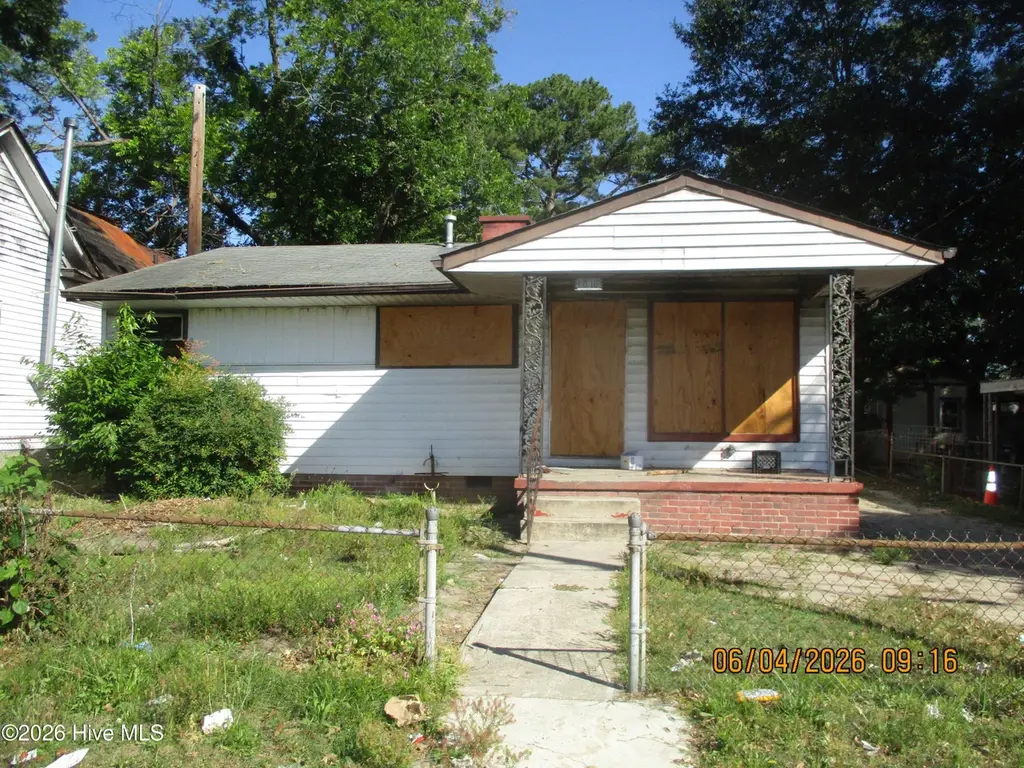
1016 Calvary St · Rocky Mount, NC
Flood risk 1/10 · Minimal
- FEMA flood zone
- X (unshaded)
- Chance of flooding over 30 yrs
- 0.0%
- Est. flood insurance / yr
- $507 – $1,088
Fire risk 3/10 · Minor
- Est. fire insurance / yr
- $906 – $1,684
Heat risk 8/10 · Major
- Hot days now (above 107°F)
- 7 days/yr
- Hot days in 30 yrs
- 16 days/yr
Wind risk 6/10 · Moderate
- Chance of severe wind over 30 yrs
- 73.0%
Air-quality risk 2/10 · Minimal
- Unhealthy air days now
- 1 days/yr
- Unhealthy air days in 30 yrs
- 2 days/yr
Risk factors via First Street. Map © Google.
Why this score? — see what drove the D grade
The composite is a weighted blend of 9 inputs, each scored 0–100. Each bar is that input's sub-score; the figure is the points it added to the 100-point composite (weight × sub-score).
- Cash flow +15.0/30.0
- ARV discount +7.5/15.0
- 1% rule +5.0/10.0
- DSCR +5.0/10.0
- Rent growth +3.9/5.0
- Livability +3.5/5.0
- Condition / age +2.5/5.0
- Schools +2.2/10.0
- Appreciation +0.0/10.0
$22,500
🖨 Deal sheet (PDF) 📄 Offer letter ✓ Due diligence
Listing remarks
Good location and convenient to amenities. Nice size lot with fenced yard and double detached garage/workshop.
Key facts
- Fenced yard
- 7,405 sq ft lot
- 2 garage spots
Tags
Property features AI
Finance
- Other: Residential zoning
Exterior
- Parking: 2 total parking spaces; 2-car garage (garage present); Unpaved parking areas
- Utilities: Public water; Public sewer; Utilities described as 'See Remarks' / none listed
- Home design: Single-family residence; One story, entry level 1
- Construction: Vinyl siding and frame construction; Shingle roof; Built on crawl space
- Exterior features: Front porch; Chain link fencing; Has a view; City street and state road frontage; Lot about 0.17 acres (approx. 50 x 150)
Interior
- Bathrooms: 1 full bathroom
- Heating & cooling: No heating listed; No cooling listed
- Interior features: Crawl space basement; Total of 4 rooms
Neighborhood map
What this means for you Summary
Snapshot
- This is a 2-bed/1.0-bath single-family listed at $22k.
Deal economics
- At list price, monthly cash flow is $720 ($9k/yr) — positive.
- The deal already cash-flows at list — no discount required.
- Meets the 1% rule at list price ($1k rent vs $22k).
- Recommended offer: $22k (1.5% below list) — sets the bar for market timing.
- Cap rate 44.7% vs local median 4.5% in Rocky Mount — top-decile yield for the area; either an underpriced asset or a hidden risk that comps aren't pricing in. Stress-test before assuming the spread holds.
Location & tenants
- Location reads 70/100 on livability (#134 in NC) — a middle-class / working-renter tenant base. Strengths: cost of living A+, housing A+, health & safety A+; Watch: crime F, amenities F, employment F.
- Nash-Rocky Mount Schools (rural): math 20% / reading 32% proficiency, ranked #155 of 178 in NC (top 87%) — low school quality limits family demand, transient renter base, plan for 1-2y turnover.
- Zoned schools: Williford Elementary (201 students, 98% FRL); G R Edwards Middle (math 20% / reading 31%, grade F, #388 of 475 statewide, top 83%, 410 students, 88% FRL); Rocky Mount High (math 27% / reading 36%, grade F, #449 of 535 statewide, top 85%, 1,072 students, 76% FRL) — zoned schools average 87% FRL vs 59% district-wide (28 pts higher); higher-poverty schools than district average — tighter screening recommended.
- Market conditions: Rents rising fast (+5.5%/yr); 175 active listings in the ZIP; 500 units permitted in Nash County in 2024 (0 in 5+ unit buildings).
Forward outlook
- Local home prices are declining (-3.0%/yr); year-one equity from $156 of loan paydown is wiped out by about $675 of value loss. Plan a longer hold.
- Nash County population projected at -12% by 2050 — secular population decline; favor cash flow + early exit over multi-decade hold.
- At projected returns (-3.0% appreciation + 5.5% rent growth), your $6k cash investment doubles in ~1 year — after that, you're playing with house money.
Negotiation context
- It's been on market 16 days — a 2% lower offer ($22k) is reasonable based on typical stale-listing flexibility.
Risks & watch-outs
- Watch-outs: built in 1958 — expect roof / HVAC / electrical / plumbing capex.
- Climate carrying-cost: major wind risk, 73% chance of damaging wind over 30y; extreme-heat days projected 7→16/yr by 2055 (HVAC capex compounding) — expect insurance premiums to compound above CPI over the hold.
Questions for the listing agent
- Built in 1958 — when were the roof, HVAC, electrical panel, plumbing, and water heater last replaced?
- Is there a deadline driving the sale (1031 exchange, divorce, estate, relocation)? That informs how much negotiation room exists.
- Schools are F-rated, which usually means shorter tenancies and higher turnover. Who's the typical renter profile here, and what's been the actual vacancy rate?
- Crime grade is F in this area — have there been break-ins, vandalism, or insurance claims at this property in the last 3 years? What carrier currently insures it and at what premium?
- The area grade is low — what's the realistic commute time and amenity access for the typical tenant pool here? Any planned neighborhood developments (good or bad) we should know about?
- What's the average days-on-market for RENTAL listings here right now (not sales)? A rising rental-DOM trend means longer vacancies and softer asking-rent achievability than the comps imply.
- What's the recent tenant-quality profile in this submarket — average credit score on applications, eviction rate, late-payment / NSF rate, and stable-employment percentage? A property-management company in the area should have these aggregated.
- How much new for-sale + rental construction is in the pipeline within 1–3 miles? Heavy new supply typically softens prices + rents 12–24 months out; constrained supply supports both.
Investment metrics
- 1% rule
- 4.97% ✓
- Cap rate
- 44.67%
- Cash-on-cash
- 137.07%
- DSCR
- 7.10
- GRM
- 1.7
CMA / ARV
- ARV (on-the-fly)
- $53,632
- Comps found
- 9
Show comp detail 9 sales within ~0.75 mi
| Address | Dist | Beds/Ba | Sqft | Sold | Price | $/sf | Match |
|---|---|---|---|---|---|---|---|
| 621 Clyde St | 0.36mi | 2/1.0 | 747 (-11%) | 1mo | $23,000 | $31 | 64 |
| 417 Dexter St | 0.49mi | 2/1.0 | 896 (+7%) | 4mo | $133,900 | $149 | 62 |
| 1600 Aycock St | 0.40mi | 2/1.0 | 933 (+11%) | 2mo | $60,000 | $64 | 61 |
| 1609 Davis St | 0.66mi | 2/1.0 | 816 (-3%) | 11mo | $28,000 | $34 | 56 |
| 309 Saint Paul St | 0.68mi | 2/1.0 | 843 (+1%) | 16mo | $95,000 | $113 | 54 |
| 921 O Berry St | 0.55mi | 2/1.0 | 923 (+10%) | 12mo | $111,500 | $121 | 47 |
| 629 Arrington Ave | 0.31mi | 2/1.0 | 960 (+15%) | 18mo | $27,500 | $29 | 46 |
| 603 Clyde St | 0.39mi | 2/1.0 | 949 (+13%) | 21mo | $35,000 | $37 | 42 |
| 321 Nelson St | 0.58mi | 3/1.0 (+1) | 960 (+15%) | 15mo | $73,500 | $77 | 31 |
Match score weights: distance 35% · size 25% · config 20% · recency 20%. Top-matched comps best support the ARV.
Projected returns pro-forma
-3.0% appreciation · 5.51% rent growth · sell at horizon
- IRR
- —
- Equity multiple
- 8.16×
- Total profit
- $45,105
- Equity at exit
- $3,355
- IRR
- —
- Equity multiple
- 18.60×
- Total profit
- $110,896
- Equity at exit
- $1,945
Cash invested: $6,300 (down + closing). Projections, not guarantees.
Landlord ↔ Tenant lean methodology
- Overall (STATE)
- 85 Strongly Landlord-Friendly
- State North Carolina
- 85 Strongly Landlord-Friendly · R+3
- County
- — inherits STATE
- City
- — inherits STATE
ZIP-level market 27803
- Rents YoY
- 5.5%
- Active inventory
- 175
- Price-to-rent
- 1.7×
Monthly cashflow live
- Estimated rent
- $1,119 medium interval (Pro) →
- Mortgage (P&I)
- −$118
- Tax from tax record
- −$37 /mo · $442/yr
- Insurance
- −$9
- HOA
- −$0
- Vacancy / Maint / Mgmt
- −$235
- Net cashflow
- $720
Break-even live
Sensitivity live
| Price | -10% $732 | -5% $726 | +0% $720 | +5% $713 | +10% $707 |
|---|---|---|---|---|---|
| Rent | -10% $631 | -5% $675 | +0% $720 | +5% $764 | +10% $808 |
| Rate | -1.0pp $731 | -0.5pp $725 | base $720 | +0.5pp $714 | +1.0pp $708 |
UW: 25.0% down · 7.5% · 30yr · 1.5% tax · 5.0% vac · 8.0% maint · 8.0% mgmt
Financing live
Cash to close
- Down payment
- $5,625
- Closing costs
- $675
- Reserves months
- —
- Total cash needed
- —
Loan-product check · same deal, 3 products live
Conventional
25% down · 7.5% · 30yr
- Down + closing
- —
- Monthly P&I
- —
- Monthly cashflow
- —
- DSCR
- —
- Eligible?
- —
Personal DTI + credit; lowest rate.
DSCR
20% down · 8.5% · 30yr
- Down + closing
- —
- Monthly P&I
- —
- Monthly cashflow
- —
- DSCR
- —
- Eligible?
- —
No personal income docs; deal must DSCR.
Hard money
10% down · 12.0% · 12mo
- Down + closing
- —
- Monthly P&I
- —
- Monthly cashflow
- —
- DSCR
- —
- Eligible?
- —
Short-term bridge; refi at stabilization.
Listing history 13 events
-
2026-06-21days on market $22,500 Active 16 DOM
-
2026-06-19days on market $22,500 Active 14 DOM
-
2026-06-18days on market $22,500 Active 13 DOM
-
2026-06-17days on market $22,500 Active 12 DOM
-
2026-06-16days on market $22,500 Active 11 DOM
-
2026-06-15days on market $22,500 Active 10 DOM
-
2026-06-14days on market $22,500 Active 8 DOM
-
2026-06-13days on market $22,500 Active 7 DOM
-
2026-06-10days on market $22,500 Active 5 DOM
-
2026-06-09days on market $22,500 Active 4 DOM
-
2026-06-08days on market $22,500 Active 3 DOM
-
2026-06-07remarks 111-char remark
-
2026-06-07$22,500 Active 2 DOM
ⓘ Source: listings_history table (triggers on properties + properties_extension) + one-shot
backfill from property_details.listing_events for pre-trigger history.
Tax reassessment forecast NC · Resets to sale price
- Current annual tax
- $442 · $37/mo
- Projected year-2 tax
- $442 · $37/mo
- Expected delta
- $0/yr ($0/mo · 0.0%)
ⓘ Screening estimate from a state-policy table — verify with the county assessor before closing.
Climate risk First Street
- Flood 1/10 Low FEMA zone X (unshaded) · 0% chance over 30 yrs
- Wildfire 3/10 Moderate
- Heat 8/10 Severe 7 d/yr ≥107°F today · 16 d/yr by 30 yrs out
- Wind 6/10 Major 73% chance of damaging wind over 30 yrs
- Air quality 2/10 Low 1 unhealthy d/yr today · 2 by 30 yrs out
Nearby sold comps map
Loading sold comps map…
Walkable amenities ~0.75 mi
Loading nearby amenities…
Taxation est. · year 1
- Rental income
- $13,426
- − Mortgage interest
- −$1,260
- − Property taxes
- −$442
- − Insurance
- −$112
- − Repairs & maintenance
- −$1,074
- − Management
- −$1,074
- − Depreciation
- −$655
- Taxable income
- $8,808
- Est. tax owed @ 24.0%
- −$2,114
- After-tax cash flow
- $6,522/yr
For passive investors: Depreciation is non-cash, so a rental often shows a tax loss while cash-flowing — sheltering income. Rental losses are passive: they offset passive income freely, and up to $25,000/yr can offset ordinary (W-2) income if you actively participate and your MAGI is under $100k (phasing out to $0 by $150k); unused losses carry forward. On sale, claimed depreciation is recaptured at up to 25%, and gains may owe capital-gains tax (a 1031 exchange can defer both). Figures are a year-1 estimate at your 24.0% rate — not tax advice; consult a CPA.
Schools (NCES district)
- District
- Nash-Rocky Mount Schools
- NCES district ID
- 3703270
- Math proficiency
- 20% ▼ -3.00%
- Reading proficiency
- 32% ▲ 1.00%
- Median HH income
- $41,553
- Composite
- 22.04/100
- National rank
- #8198
- State rank
- #155 of 178 in NC
Livability — Rocky Mount
- Score
- 70/100
- State rank
- #134
- US rank
- #7692
Category grades
Schools grade is shown separately in the Schools card above.
Census & demographics
- Census place
- Rocky Mount, NC
- County
- Nash County · 50,768 people
- City population
- 70,300
- Metro
- Rocky Mount, NC
- Population (ZIP)
- 20,055
- Household income
- $60,124
- Rent vs Own
- Severe rent burden
- 641.0
Population outlook (Nash County) Hauer SSP2
- Today (2025)
- 91,107 people
- By 2030
- 89,193 · -2.1%
- By 2040
- 84,959 · -6.7%
- By 2050
- 80,517 · -11.6%
- By 2075
- 72,941 · -19.9%
- By 2100
- 63,602 · -30.2%
Race, ethnicity, and origin ACS 2023
- Neighborhood character
- Diverse neighborhood (Simpson 0.60)
- Race & ethnicity
- White 46% Black 44% Two or more races 6% Hispanic / Latino 5% Asian 1%
- Common ancestry
- Iranian 1% Italian 1% Slovak 1%
- Foreign-born
- 3% · Canada
- Languages at home
- 93% English-only · Spanish 5% Arabic 1% Other Indo-European 1%
Political lean MEDSL · Nash
- 2024 margin
- Toss-up / Even · D 48.7% · R 50.5%
- 2008→2024 swing
- -0.4pp no change · 2008: -1.3pp · 2024: -1.8pp
- All cycles
- 2024: R+1.8 2020: D+0.2 2016: R+0.2 2012: D+0.9 2008: R+1.3
Not yet ingested
- Civics
- —
Market trends
- HPI YoY
- ▼ -162.95%
- Current HPI
- 190.0204
- Rent YoY
- ▲ 5.51%
- Metro
- Rocky Mount, NC
- State GDP YoY
- ▲ 3.28%
- F500 in state
- 26
Industry mix (Fortune 500 HQ in NC)
| Industry | F500 HQs | Revenue |
|---|---|---|
| Financial Services | 2 | $213B |
|
||
| Retail | 2 | $95B |
|
||
| Industrial Conglomerate | 1 | $38B |
|
||
| Metals / Steel | 1 | $35B |
|
||
| Utilities | 1 | $30B |
|
||
| Industrial Machinery | 1 | $19B |
|
||
Price history
-55.9% since first listed2 events — show timeline
- 2026-06-04 Listed $22,500 Hive MLS
- 1997-07-16 Sold (Public Records) $51,000 Public Records
Property tax history
+2.4%/yrLatest (2025): $442 · +0.0% YoY. Source: county tax records.
Cash-flow waterfall
monthlySold comps — $/sqft
last 12 mo · ≤1 miLoading sold comps…