3185 S James Rd · Baldwin, MI
Flood risk 1/10 · Minimal
- FEMA flood zone
- —
- Chance of flooding over 30 yrs
- 0.0%
- Est. flood insurance / yr
- —
Fire risk 4/10 · Minor
- Est. fire insurance / yr
- $784 – $1,456
Heat risk 1/10 · Minimal
- Hot days now (above 96°F)
- 7 days/yr
- Hot days in 30 yrs
- 14 days/yr
Wind risk 1/10 · Minimal
- Chance of severe wind over 30 yrs
- —
Air-quality risk 2/10 · Minimal
- Unhealthy air days now
- 1 days/yr
- Unhealthy air days in 30 yrs
- 3 days/yr
Risk factors via First Street. Map © Google.
Why this score? — see what drove the B- grade
The composite is a weighted blend of 9 inputs, each scored 0–100. Each bar is that input's sub-score; the figure is the points it added to the 100-point composite (weight × sub-score).
- Cash flow +30.0/30.0
- 1% rule +10.0/10.0
- DSCR +10.0/10.0
- ARV discount +7.5/15.0
- Livability +3.4/5.0
- Rent growth +2.5/5.0
- Condition / age +2.5/5.0
- Schools +2.3/10.0
- Appreciation +0.0/10.0
$55,000
🖨 Deal sheet 📄 Offer letter ✓ Due diligence
Listing remarks MLS
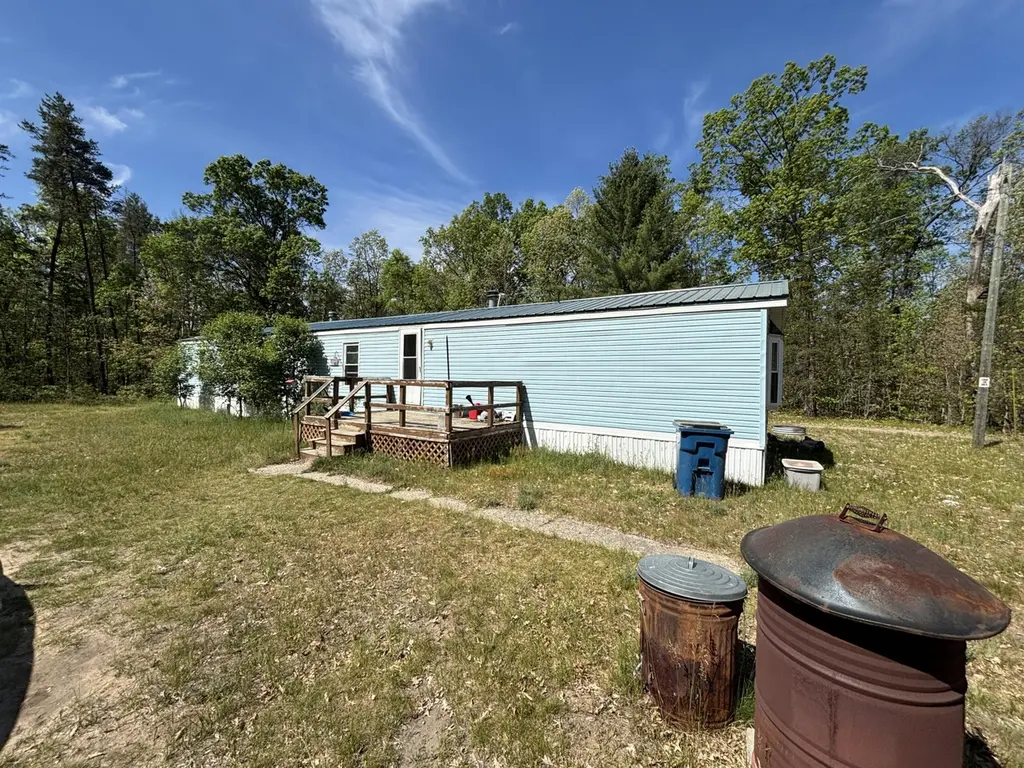
Your Turn-Key Up-North Escape Awaits! This meticulously maintained 3-bedroom, 2-bathroom home sits beautifully on 2.5 wooded, level acres just north of Baldwin. Offered partially furnished, this property is truly move-in ready from day one. Whether you are looking for a peaceful year-round residence or the ultimate weekend basecamp, you will love being minutes from premier public hunting land, staging areas, and ORV/snowmobile riding trails. Plus, beautiful Lake Michigan is just a short 30-minute drive away! The property features easy access via a county-maintained road just off M-37, a handy storage shed for your tools and toys, and plenty of cleared space to build your dream pole barn. Don't wait--schedule your showing today and start enjoying the best of Michigan's natural resources!
Key facts
- 2.5 acre lot
- Built 1994
Property features AI
Exterior
- Utilities: Propane water heater
- Home design: Ranch-style home; Single-story (ranch)
- Construction: Built in 1994; Vinyl siding; Metal roof; Slab foundation
- Exterior features: Recreational lot; Wooded lot; Unimproved road access; Well water
Interior
- Bathrooms: Two full bathrooms
- Heating & cooling: Forced air heating; Has heating
- Interior features: Seven total rooms; Fireplace
Neighborhood map
What this means for you Summary
Snapshot
- This is a 3-bed/1.0-bath single-family listed at $55k.
Deal economics
- At list price, monthly cash flow is $522 ($6k/yr) — positive.
- The deal already cash-flows at list — no discount required.
- Meets the 1% rule at list price ($1k rent vs $55k).
- Cap rate 17.7% vs local median 3.6% in Baldwin — top-decile yield for the area; either an underpriced asset or a hidden risk that comps aren't pricing in. Stress-test before assuming the spread holds.
Location & tenants
- Location reads 68/100 on livability (#360 in MI) — a middle-class / working-renter tenant base. Strengths: cost of living A+, health & safety A+, housing A; Watch: schools F, amenities F, commute F.
- Baldwin Community Schools (rural): math 21% / reading 28% proficiency, ranked #618 of 760 in MI (top 81%) — low school quality limits family demand, transient renter base, plan for 1-2y turnover; 85% free/reduced lunch — lower-income household profile, screen leases tightly.
- Market conditions: 167 active listings in the ZIP; 30 units permitted in Lake County in 2024 (0 in 5+ unit buildings).
Forward outlook
- Local home prices are declining (-3.0%/yr); year-one equity from $380 of loan paydown is wiped out by about $2k of value loss. Plan a longer hold.
- Lake County population projected at -22% by 2050 — secular population decline; favor cash flow + early exit over multi-decade hold.
- At projected returns (-3.0% appreciation + 3.0% rent growth), your $15k cash investment doubles in ~3 years — after that, you're playing with house money.
Negotiation context
- Only 1 days on market — expect competitive offers; lowballing is unlikely to land.
- 8 sale attempts since 4y ago with the ask held roughly flat each time — persistent listings suggest the price (not the market) is what's stuck; bring a comps-based counter.
Questions for the listing agent
- Is there a deadline driving the sale (1031 exchange, divorce, estate, relocation)? That informs how much negotiation room exists.
- Schools are F-rated, which usually means shorter tenancies and higher turnover. Who's the typical renter profile here, and what's been the actual vacancy rate?
- What's the average days-on-market for RENTAL listings here right now (not sales)? A rising rental-DOM trend means longer vacancies and softer asking-rent achievability than the comps imply.
- What's the recent tenant-quality profile in this submarket — average credit score on applications, eviction rate, late-payment / NSF rate, and stable-employment percentage? A property-management company in the area should have these aggregated.
- How much new for-sale + rental construction is in the pipeline within 1–3 miles? Heavy new supply typically softens prices + rents 12–24 months out; constrained supply supports both.
Investment metrics
- 1% rule
- 2.07% ✓
- Cap rate
- 17.68%
- Cash-on-cash
- 40.67%
- DSCR
- 2.81
- GRM
- 4.0
CMA / ARV
- ARV (on-the-fly)
- $150,784
- Comps found
- 1
Show comp detail 1 sale within ~0.75 mi
| Address | Dist | Beds/Ba | Sqft | Sold | Price | $/sf | Match |
|---|---|---|---|---|---|---|---|
| 3147 S Yale Ave | 0.54mi | 3/1.5 | 1,284 (+6%) | 23mo | $159,500 | $124 | 44 |
Match score weights: distance 35% · size 25% · config 20% · recency 20%. Top-matched comps best support the ARV.
Projected returns pro-forma
-3.0% appreciation · 3.0% rent growth · sell at horizon
- IRR
- 37.1%
- Equity multiple
- 2.58×
- Total profit
- $24,346
- Equity at exit
- $8,201
- IRR
- 43.7%
- Equity multiple
- 5.16×
- Total profit
- $64,071
- Equity at exit
- $4,755
Cash invested: $15,400 (down + closing). Projections, not guarantees.
Landlord ↔ Tenant lean methodology
- Overall (STATE)
- 62 Landlord-Friendly
- State Michigan
- 62 Landlord-Friendly · EVEN
- County
- — inherits STATE
- City
- — inherits STATE
ZIP-level market 49304
- Home prices YoY
- -30.4%
- Active inventory
- 167
- Price-to-rent
- 4.0×
Monthly cashflow live
- Estimated rent
- $1,140 medium interval (Pro) →
- Mortgage (P&I)
- −$288
- Tax from tax record
- −$67 /mo · $805/yr
- Insurance
- −$23
- HOA
- −$0
- Vacancy / Maint / Mgmt
- −$239
- Net cashflow
- $522
Break-even live
UW: 25.0% down · 7.5% · 30yr · 1.5% tax · 5.0% vac · 8.0% maint · 8.0% mgmt
Financing live
Cash to close
- Down payment
- $13,750
- Closing costs
- $1,650
- Reserves months
- —
- Total cash needed
- —
Loan-product check · same deal, 3 products live
Conventional
25% down · 7.5% · 30yr
- Down + closing
- —
- Monthly P&I
- —
- Monthly cashflow
- —
- DSCR
- —
- Eligible?
- —
Personal DTI + credit; lowest rate.
DSCR
20% down · 8.5% · 30yr
- Down + closing
- —
- Monthly P&I
- —
- Monthly cashflow
- —
- DSCR
- —
- Eligible?
- —
No personal income docs; deal must DSCR.
Hard money
10% down · 12.0% · 12mo
- Down + closing
- —
- Monthly P&I
- —
- Monthly cashflow
- —
- DSCR
- —
- Eligible?
- —
Short-term bridge; refi at stabilization.
Listing history 2 events
-
2026-06-07remarks 699-char remark
-
2026-06-07$55,000 Pending 1 DOM
ⓘ Source: listings_history table (triggers on properties + properties_extension) + one-shot
backfill from property_details.listing_events for pre-trigger history.
Tax reassessment forecast MI · Partial reset (capped growth)
- Current annual tax
- $805 · $67/mo
- Projected year-2 tax
- $826 · $69/mo
- Expected delta
- +$21/yr (+$2/mo · 2.6%)
ⓘ Screening estimate from a state-policy table — verify with the county assessor before closing.
Climate risk First Street
- Flood 1/10 Low 0% chance over 30 yrs
- Wildfire 4/10 Moderate
- Heat 1/10 Low 7 d/yr ≥96°F today · 14 d/yr by 30 yrs out
- Wind 1/10 Low
- Air quality 2/10 Low 1 unhealthy d/yr today · 3 by 30 yrs out
Nearby sold comps map
Loading sold comps map…
Walkable amenities ~0.75 mi
Loading nearby amenities…
Taxation est. · year 1
- Rental income
- $13,676
- − Mortgage interest
- −$3,081
- − Property taxes
- −$805
- − Insurance
- −$275
- − Repairs & maintenance
- −$1,094
- − Management
- −$1,094
- − Depreciation
- −$1,600
- Taxable income
- $5,727
- Est. tax owed @ 24.0%
- −$1,375
- After-tax cash flow
- $4,889/yr
For passive investors: Depreciation is non-cash, so a rental often shows a tax loss while cash-flowing — sheltering income. Rental losses are passive: they offset passive income freely, and up to $25,000/yr can offset ordinary (W-2) income if you actively participate and your MAGI is under $100k (phasing out to $0 by $150k); unused losses carry forward. On sale, claimed depreciation is recaptured at up to 25%, and gains may owe capital-gains tax (a 1031 exchange can defer both). Figures are a year-1 estimate at your 24.0% rate — not tax advice; consult a CPA.
Schools (NCES district)
- District
- Baldwin Community Schools
- NCES district ID
- 2603810
- Math proficiency
- 21% ▲ 3.00%
- Reading proficiency
- 28% ▼ -2.00%
- Median HH income
- $27,638
- Composite
- 22.56/100
- National rank
- #13447
- State rank
- #618 of 760 in MI
Livability — Baldwin
- Score
- 68/100
- State rank
- #360
- US rank
- #9207
Category grades
Schools grade is shown separately in the Schools card above.
Census & demographics
- Population (ZIP)
- 4,680
Population outlook (Lake County) Hauer SSP2
- Today (2025)
- 10,933 people
- By 2030
- 10,503 · -3.9%
- By 2040
- 9,470 · -13.4%
- By 2050
- 8,526 · -22.0%
- By 2075
- 7,160 · -34.5%
- By 2100
- 5,634 · -48.5%
Race, ethnicity, and origin ACS 2023
- Neighborhood character
- Predominantly White (68%)
- Race & ethnicity
- White 68% Black 12% Hispanic / Latino 11% Two or more races 9% Native American 2%
- Hispanic origin (detail)
- Mexican 6% Puerto Rican 2%
- Common ancestry
- Romanian 5% Iranian 5% Lithuanian 3%
- Foreign-born
- 2% · Canada
- Languages at home
- 95% English-only · Spanish 4% Vietnamese 1%
Political lean MEDSL · Lake
- 2024 margin
- Solid R (+32.2) · D 33.2% · R 65.4% · Other 1.4%
- 2008→2024 swing
- -44.5pp toward R · 2008: 12.3pp · 2024: -32.2pp
- All cycles
- 2024: R+32.2 2020: R+26.2 2016: R+22.9 2012: D+5.0 2008: D+12.3
Not yet ingested
- Civics
- —
Market trends
- HPI YoY
- ▼ -51.01%
- Current HPI
- 116.6025
- Rent YoY
- —
- Metro
- —
- State GDP YoY
- ▲ 1.37%
- F500 in state
- 28
Industry mix (Fortune 500 HQ in MI)
| Industry | F500 HQs | Revenue |
|---|---|---|
| Automotive Parts | 3 | $48B |
|
||
| Automotive | 2 | $372B |
|
||
| Chemicals | 1 | $45B |
|
||
| Automotive Retail | 1 | $29B |
|
||
| Healthcare / Medical Devices | 1 | $23B |
|
||
| Automotive Technology | 1 | $20B |
|
||
Price history
-15.3% since first listed19 events — show timeline
- 2026-06-04 Pending — SW Michigan MLS
- 2026-06-04 Listing Removed — REALCOMP
- 2026-06-04 Listed $55,000 REALCOMP
- 2026-06-04 Listing Removed — MiRealSource-MiMLS
- 2026-06-04 Listed $55,000 MiRealSource-MiMLS
- 2026-06-04 Listed $55,000 SW Michigan MLS
- 2022-10-21 Sold (Public Records) $64,900 Public Records
- 2022-10-21 Sold (MLS) $64,900 SW Michigan MLS
- 2022-10-21 Sold (MLS) $64,900 REALCOMP
- 2022-09-30 Pending — REALCOMP
- 2022-09-30 Pending — SW Michigan MLS
- 2022-09-30 Listing Removed — MiRealSource-MiMLS
- 2022-09-27 Relisted — REALCOMP
- 2022-09-27 Relisted — SW Michigan MLS
- 2022-09-06 Pending — REALCOMP
- 2022-09-06 Pending — SW Michigan MLS
- 2022-07-30 Listed $64,900 SW Michigan MLS
- 2022-07-30 Listed $64,900 MiRealSource-MiMLS
- 2022-07-30 Listed $64,900 REALCOMP
Property tax history
-0.8%/yrLatest (2024): $805 · +4.8% YoY. Source: county tax records.
Cash-flow waterfall
monthlySold comps — $/sqft
last 12 mo · ≤1 miLoading sold comps…