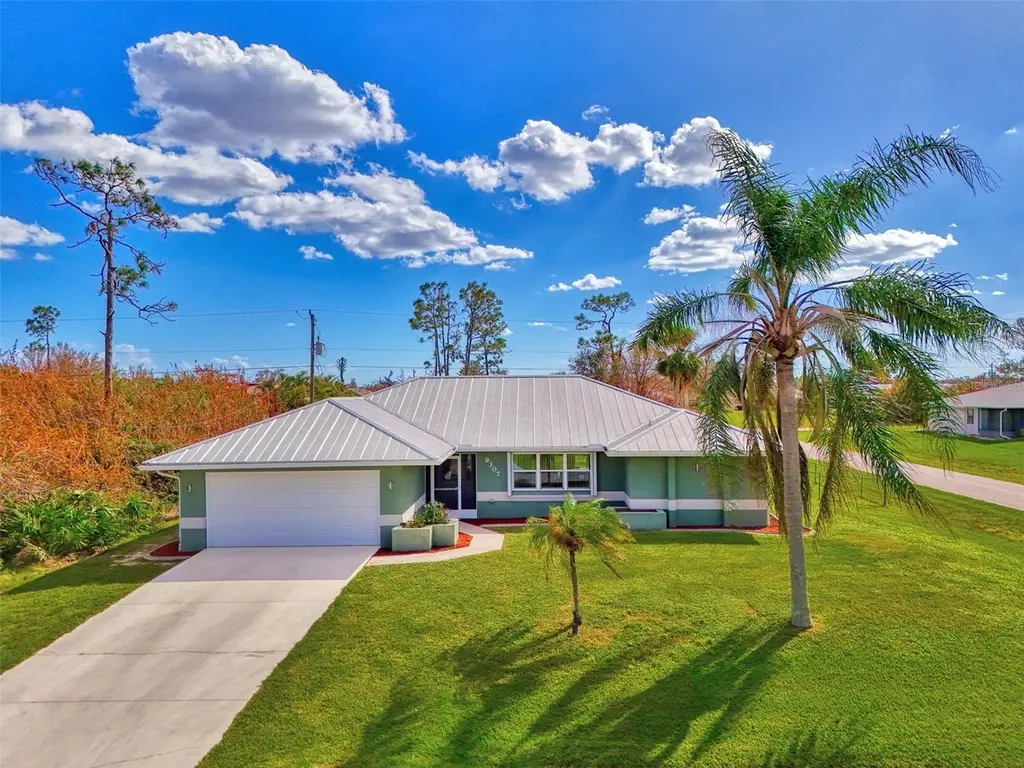
9307 San Bernandino Ave · Englewood, FL
Flood risk 5/10 · Moderate
- FEMA flood zone
- X (unshaded)
- Chance of flooding over 30 yrs
- 0.22%
- Est. flood insurance / yr
- $507 – $1,088
Fire risk 2/10 · Minimal
- Est. fire insurance / yr
- $947 – $1,759
Heat risk 10/10 · Severe
- Hot days now (above 107°F)
- 7 days/yr
- Hot days in 30 yrs
- 30 days/yr
Wind risk 10/10 · Severe
- Chance of severe wind over 30 yrs
- 99.0%
Air-quality risk 2/10 · Minimal
- Unhealthy air days now
- 1 days/yr
- Unhealthy air days in 30 yrs
- 1 days/yr
Risk factors via First Street. Map © Google.
Why this score? — see what drove the D grade
The composite is a weighted blend of 9 inputs, each scored 0–100. Each bar is that input's sub-score; the figure is the points it added to the 100-point composite (weight × sub-score).
- Cash flow +13.7/30.0
- ARV discount +8.5/15.0
- Schools +4.6/10.0
- DSCR +4.1/10.0
- Livability +3.7/5.0
- 1% rule +3.4/10.0
- Rent growth +2.5/5.0
- Condition / age +2.5/5.0
- Appreciation +0.0/10.0
$349,900
🖨 Deal sheet (PDF) 📄 Offer letter ✓ Due diligence
Listing remarks MLS
Plenty of room to roam, both inside and out. This property comes with an additional lot behind property (72X125X95X100), which brings this total property size to over 1/2 acre. With no deed restrictions, there is plenty of room for RV, boat, or a futureswimming pool. The home has been totally updated. Just a few of the great features include new metal roof, new low "E" windows, new accoridan hurricane shutters, new soffit, new gutters, and new fascia. The updated kitchen features all new wood cabinets, solid surface counters, and appliances. The inside laundry room is 16X5 and includes loads of cabinets for extra storage. All 3 bedrooms have large walk-in closets for plenty of storage with built-in storage in the master. The bamboo flooring is totallyunique and adds class to this beautiful home. The french doors with the integrated blinds lead from the breakfast nook, formal dining, and the master bedroom to the 26X10 covered/screened porch. The guest bath has been updated with with a whirlpool tuband custom tile work. The HUGE fenced yard can host a family reunion, football game, or invite the entire church over for a BBQ. The 14X10 outdoor vinyl storage shed with a ramp is great for all your lawn equipment. This exquisite home has also just beenpainted inside and out.
Key facts
- Updated appliances
- Interior laundry
- Updated baths
Tags
Neighborhood map
What this means for you Summary
Snapshot
- This is a 3-bed/2.0-bath single-family listed at $350k.
Deal economics
- At list price, monthly cash flow is $23 ($278/yr) — positive.
- The deal already cash-flows at list — no discount required.
- To meet the 1% rule (rent ≥ 1% of price), the offer needs to be $296k (15.5% below list).
- Recommended offer: $296k (15.5% below list) — sets the bar for 1% rule.
- Cap rate 6.4% vs local median 3.8% in Englewood — top-decile yield for the area; either an underpriced asset or a hidden risk that comps aren't pricing in. Stress-test before assuming the spread holds.
Location & tenants
- Location reads 73/100 on livability (#321 in FL) — a middle-class / working-renter tenant base. Strengths: housing A+, cost of living A, health & safety A; Watch: employment C-, amenities F, commute F.
- Charlotte (suburban): math 54% / reading 54% proficiency, ranked #22 of 73 in FL (top 30%) — acceptable for families but not a draw, mixed tenant base, ~2y average lease.
- Zoned schools: Vineland Elementary School (math 74% / reading 67%, grade A-, #333 of 2,144 statewide, top 16%, 579 students, 45% FRL); L. A. Ainger Middle School (math 65% / reading 53%, grade B, #144 of 571 statewide, top 26%, 720 students, 40% FRL); Lemon Bay High School (math 50% / reading 56%, grade C-, #148 of 667 statewide, top 23%, 1,360 students, 28% FRL) — zoned schools average 38% FRL vs 54% district-wide (16 pts lower); this property's tenant base skews higher-income than the district average.
- Market conditions: Rents soft (-0.1%/yr); 737 active listings in the ZIP; 12 comparable units currently listed for rent nearby; rentals at typical pace (median 23d on market — plan ~3-4 weeks tenant-placement turnaround); 4,585 units permitted in Charlotte County in 2024 (703 in 5+ unit buildings).
- At $2,956/mo this rent would consume 62% of the median local household income ($57k/yr) (locally 329% of renters already pay >50% of income on rent) — very limited rent-growth headroom before tenants either downsize or default.
Forward outlook
- Local home prices are declining (-3.0%/yr); year-one equity from $2k of loan paydown is wiped out by about $10k of value loss. Plan a longer hold.
- Charlotte County population projected at +24% by 2050 — long-run rental-demand tailwind backs the buy-and-hold thesis.
Negotiation context
- Only 9 days on market — expect competitive offers; lowballing is unlikely to land.
- 5 sale attempts since 18y ago; this cycle's ask has dropped $3.15M (90%) from the opening price — seller is motivated, your offer sets the floor, not the list.
- Current owner paid $204k; list at $350k implies a 72% gain — meaningful room to come down on a strong offer.
Risks & watch-outs
- Climate carrying-cost: moderate flood risk; severe wind risk, 99% chance of damaging wind over 30y; extreme-heat days projected 7→30/yr by 2055 (HVAC capex compounding) — expect insurance premiums to compound above CPI over the hold.
Questions for the listing agent
- Is there a deadline driving the sale (1031 exchange, divorce, estate, relocation)? That informs how much negotiation room exists.
- Schools are A-rated — typically a magnet for longer-tenancy family renters. What's the average tenant stay here, and is there a school-zone premium baked into asking?
- The area grade is low — what's the realistic commute time and amenity access for the typical tenant pool here? Any planned neighborhood developments (good or bad) we should know about?
- What's the average days-on-market for RENTAL listings here right now (not sales)? A rising rental-DOM trend means longer vacancies and softer asking-rent achievability than the comps imply.
- What's the recent tenant-quality profile in this submarket — average credit score on applications, eviction rate, late-payment / NSF rate, and stable-employment percentage? A property-management company in the area should have these aggregated.
- How much new for-sale + rental construction is in the pipeline within 1–3 miles? Heavy new supply typically softens prices + rents 12–24 months out; constrained supply supports both.
Investment metrics
- 1% rule
- 0.84% ✗
- Cap rate
- 6.37%
- Cash-on-cash
- 0.28%
- DSCR
- 1.01
- GRM
- 9.9
CMA / ARV
- ARV (on-the-fly)
- $357,960
- Comps found
- 12
Show comp detail 12 sales within ~0.75 mi
| Address | Dist | Beds/Ba | Sqft | Sold | Price | $/sf | Match |
|---|---|---|---|---|---|---|---|
| 9363 Steubenville Ave | 0.16mi | 3/2.0 | 1,985 (+5%) | 6mo | $475,000 | $239 | 79 |
| 9245 Steubenville Ave | 0.17mi | 2/2.0 (-1) | 1,714 (-9%) | 1mo | $305,000 | $178 | 72 |
| 9015 Anita Ave | 0.45mi | 3/2.0 | 1,816 (-4%) | 4mo | $291,000 | $160 | 69 |
| 6778 Greenview Ln | 0.64mi | 3/2.0 | 1,970 (+5%) | 4mo | $385,000 | $195 | 60 |
| 9302 Gulfstream Blvd | 0.42mi | 3/2.0 | 1,690 (-10%) | 5mo | $395,000 | $234 | 59 |
| 6730 Greenview Ln | 0.69mi | 3/2.0 | 1,903 (+1%) | 8mo | $325,000 | $171 | 59 |
| 7048 Inland St | 0.57mi | 3/2.0 | 1,827 (-3%) | 11mo | $290,000 | $159 | 59 |
| 7427 Escondido St | 0.61mi | 3/2.0 | 1,951 (+4%) | 13mo | $438,500 | $225 | 55 |
| 7078 S Lake Dr | 0.75mi | 3/2.0 | 1,949 (+4%) | 6mo | $370,000 | $190 | 54 |
| 6312 Pennell St | 0.68mi | 3/2.0 | 1,637 (-13%) | 6mo | $349,897 | $214 | 42 |
| 10107 Bentley Ave | 0.63mi | 4/2.0 (+1) | 2,133 (+13%) | 12mo | $390,000 | $183 | 33 |
| 10107 Tramore Ave | 0.74mi | 4/4.0 (+1) | 2,106 (+12%) | 1mo | $399,000 | $189 | 32 |
Match score weights: distance 35% · size 25% · config 20% · recency 20%. Top-matched comps best support the ARV.
Projected returns pro-forma
-3.0% appreciation · 0.0% rent growth · sell at horizon
- IRR
- -19.1%
- Equity multiple
- 0.35×
- Total profit
- $-63,905
- Equity at exit
- $52,171
- IRR
- -19.2%
- Equity multiple
- 0.11×
- Total profit
- $-87,310
- Equity at exit
- $30,253
Cash invested: $97,972 (down + closing). Projections, not guarantees.
Landlord ↔ Tenant lean methodology
- Overall (STATE)
- 87 Strongly Landlord-Friendly
- State Florida
- 87 Strongly Landlord-Friendly · R+3
- County
- — inherits STATE
- City
- — inherits STATE
ZIP-level market 34224
- Home prices YoY
- -18.9%
- Rents YoY
- -0.1%
- Active inventory
- 737
- Price-to-rent
- 9.9×
Monthly cashflow live
- Estimated rent
- $2,956 high interval (Pro) →
- Mortgage (P&I)
- −$1,835
- Tax from tax record
- −$332 /mo · $3,979/yr
- Insurance
- −$146
- HOA
- −$0
- Vacancy / Maint / Mgmt
- −$621
- Net cashflow
- $23
Break-even live
Sensitivity live
| Price | -10% $221 | -5% $122 | +0% $23 | +5% $-76 | +10% $-175 |
|---|---|---|---|---|---|
| Rent | -10% $-210 | -5% $-94 | +0% $23 | +5% $140 | +10% $257 |
| Rate | -1.0pp $199 | -0.5pp $112 | base $23 | +0.5pp $-67 | +1.0pp $-160 |
UW: 25.0% down · 7.5% · 30yr · 1.5% tax · 5.0% vac · 8.0% maint · 8.0% mgmt
Financing live
Cash to close
- Down payment
- $87,475
- Closing costs
- $10,497
- Reserves months
- —
- Total cash needed
- —
Loan-product check · same deal, 3 products live
Conventional
25% down · 7.5% · 30yr
- Down + closing
- —
- Monthly P&I
- —
- Monthly cashflow
- —
- DSCR
- —
- Eligible?
- —
Personal DTI + credit; lowest rate.
DSCR
20% down · 8.5% · 30yr
- Down + closing
- —
- Monthly P&I
- —
- Monthly cashflow
- —
- DSCR
- —
- Eligible?
- —
No personal income docs; deal must DSCR.
Hard money
10% down · 12.0% · 12mo
- Down + closing
- —
- Monthly P&I
- —
- Monthly cashflow
- —
- DSCR
- —
- Eligible?
- —
Short-term bridge; refi at stabilization.
Rent comps 12 comps
| Address | Beds | Baths | Sqft | Rent | $/sqft | DOM | Units | Dist |
|---|---|---|---|---|---|---|---|---|
| 9400 New Martinsville Ave Englewood, FL | 3.0 | 2.0 | 1879 | $3,300 | $1.76 | 23d | 1 | 0.15mi |
| 7160 Carlsbad Ter Englewood, FL | 3.0 | 2.0 | 2061 | $4,500 | $2.18 | 23d | 1 | 0.19mi |
| 7344 Brookhaven Ter Englewood, FL | 3.0 | 2.0 | 1594 | $2,095 | $1.31 | 23d | 1 | 0.49mi |
| 10123 Bay Ave Englewood, FL | 3.0 | 2.0 | 2010 | $2,150 | $1.07 | 23d | 1 | 0.66mi |
| 6320 Brookridge St Englewood, FL | 3.0 | 2.0 | 1445 | $5,550 | $3.84 | 23d | 1 | 0.77mi |
| 502 Sunset Rd N Rotonda West, FL | 3.0 | 2.0 | 1636 | $2,100 | $1.28 | 23d | 1 | 0.85mi |
| 8363 Sago Ct Englewood, FL | 2.0 | 2.0 | 1360 | $1,950 | $1.43 | 23d | 1 | 0.90mi |
| 10136 Willmington Blvd Englewood, FL | 3.0 | 2.0 | 1598 | $2,000 | $1.25 | 23d | 1 | 1.24mi |
| 511 Sweetwater Dr Rotonda West, FL | 4.0 | 2.5 | 2160 | $2,200 | $1.02 | 23d | 1 | 1.26mi |
| 7114 Sunnybrook Blvd Englewood, FL | 4.0 | 2.0 | 1636 | $2,297 | $1.40 | 23d | 1 | 1.44mi |
| 8256 Shore Lake Dr Englewood, FL | 3.0 | 3.0 | 2201 | $2,500 | $1.14 | 23d | 1 | 1.46mi |
| 6305 Shaw St Englewood, FL | 3.0 | 2.0 | 1525 | $2,100 | $1.38 | 23d | 1 | 1.48mi |
Listing history 16 events
-
2026-04-22status Pending
-
2026-04-13price $349,900
-
2026-04-13$3,499,000 Active
-
2025-04-21historical
-
2025-02-18price $379,900
-
2024-10-23$399,900 Active
-
2019-05-28soldstatus $203,500
-
2010-02-09soldstatus $164,900
-
2010-02-04soldstatus $174,900 1300-char remark
Show marketing remark (1300 chars)
Plenty of room to roam, both inside and out. This property comes with an additional lot behind property (72X125X95X100), which brings this total property size to over 1/2 acre. With no deed restrictions, there is plenty of room for RV, boat, or a futureswimming pool. The home has been totally updated. Just a few of the great features include new metal roof, new low "E" windows, new accoridan hurricane shutters, new soffit, new gutters, and new fascia. The updated kitchen features all new wood cabinets, solid surface counters, and appliances. The inside laundry room is 16X5 and includes loads of cabinets for extra storage. All 3 bedrooms have large walk-in closets for plenty of storage with built-in storage in the master. The bamboo flooring is totallyunique and adds class to this beautiful home. The french doors with the integrated blinds lead from the breakfast nook, formal dining, and the master bedroom to the 26X10 covered/screened porch. The guest bath has been updated with with a whirlpool tuband custom tile work. The HUGE fenced yard can host a family reunion, football game, or invite the entire church over for a BBQ. The 14X10 outdoor vinyl storage shed with a ramp is great for all your lawn equipment. This exquisite home has also just beenpainted inside and out.
-
2009-07-21$187,900 1300-char remark
Show marketing remark (1300 chars)
Plenty of room to roam, both inside and out. This property comes with an additional lot behind property (72X125X95X100), which brings this total property size to over 1/2 acre. With no deed restrictions, there is plenty of room for RV, boat, or a futureswimming pool. The home has been totally updated. Just a few of the great features include new metal roof, new low "E" windows, new accoridan hurricane shutters, new soffit, new gutters, and new fascia. The updated kitchen features all new wood cabinets, solid surface counters, and appliances. The inside laundry room is 16X5 and includes loads of cabinets for extra storage. All 3 bedrooms have large walk-in closets for plenty of storage with built-in storage in the master. The bamboo flooring is totallyunique and adds class to this beautiful home. The french doors with the integrated blinds lead from the breakfast nook, formal dining, and the master bedroom to the 26X10 covered/screened porch. The guest bath has been updated with with a whirlpool tuband custom tile work. The HUGE fenced yard can host a family reunion, football game, or invite the entire church over for a BBQ. The 14X10 outdoor vinyl storage shed with a ramp is great for all your lawn equipment. This exquisite home has also just beenpainted inside and out.
-
2008-12-24soldstatus $195,000
-
2008-12-19soldstatus $195,000
-
2008-09-19$199,900
-
2008-07-02historical
-
2008-06-17$309,900
-
2002-02-12soldstatus $123,000
ⓘ Source: listings_history table (triggers on properties + properties_extension) + one-shot
backfill from property_details.listing_events for pre-trigger history.
Tax reassessment forecast FL · Resets to sale price
- Current annual tax
- $3,979 · $332/mo
- Projected year-2 tax
- $3,979 · $332/mo
- Expected delta
- $0/yr ($0/mo · 0.0%)
ⓘ Screening estimate from a state-policy table — verify with the county assessor before closing.
Climate risk First Street
- Flood 5/10 Major FEMA zone X (unshaded) · 22% chance over 30 yrs
- Wildfire 2/10 Low
- Heat 10/10 Extreme 7 d/yr ≥107°F today · 30 d/yr by 30 yrs out
- Wind 10/10 Extreme 99% chance of damaging wind over 30 yrs
- Air quality 2/10 Low 1 unhealthy d/yr today · 1 by 30 yrs out
Nearby sold comps map
Loading sold comps map…
Walkable amenities ~0.75 mi
Loading nearby amenities…
Taxation est. · year 1
- Rental income
- $35,476
- − Mortgage interest
- −$19,600
- − Property taxes
- −$3,979
- − Insurance
- −$1,750
- − Repairs & maintenance
- −$2,838
- − Management
- −$2,838
- − Depreciation
- −$10,179
- Taxable loss
- −$5,708
- Est. tax savings @ 24.0%
- +$1,370
- After-tax cash flow
- $1,648/yr
For passive investors: Depreciation is non-cash, so a rental often shows a tax loss while cash-flowing — sheltering income. Rental losses are passive: they offset passive income freely, and up to $25,000/yr can offset ordinary (W-2) income if you actively participate and your MAGI is under $100k (phasing out to $0 by $150k); unused losses carry forward. On sale, claimed depreciation is recaptured at up to 25%, and gains may owe capital-gains tax (a 1031 exchange can defer both). Figures are a year-1 estimate at your 24.0% rate — not tax advice; consult a CPA.
Schools (NCES district)
- District
- Charlotte
- NCES district ID
- 1200240
- Math proficiency
- 54% ▼ -6.00%
- Reading proficiency
- 54% ▼ -1.00%
- Median HH income
- $44,864
- Composite
- 45.62/100
- National rank
- #2586
- State rank
- #22 of 73 in FL
Livability — Englewood
- Score
- 73/100
- State rank
- #321
- US rank
- #5655
Category grades
Schools grade is shown separately in the Schools card above.
Census & demographics
- County
- Charlotte County · 196,994 people
- City population
- 35,420
- Metro
- Punta Gorda, FL
- Population (ZIP)
- 15,536
- Household income
- $57,281
- Rent vs Own
- Severe rent burden
- 329.0
Population outlook (Charlotte County) Hauer SSP2
- Today (2025)
- 198,646 people
- By 2030
- 210,507 · +6.0%
- By 2040
- 230,857 · +16.2%
- By 2050
- 247,148 · +24.4%
- By 2075
- 281,777 · +41.8%
- By 2100
- 293,609 · +47.8%
Race, ethnicity, and origin ACS 2023
- Neighborhood character
- Predominantly White (92%)
- Race & ethnicity
- White 92% Two or more races 5% Hispanic / Latino 3% Asian 1%
- Common ancestry
- Romanian 4% Slovak 4% Lithuanian 4%
- Foreign-born
- 9% · Canada
- Languages at home
- 92% English-only · Other Indo-European 2% Spanish 2% German/W. Germanic 1%
Political lean MEDSL · Charlotte
- 2024 margin
- Solid R (+34.0) · D 32.7% · R 66.7%
- 2008→2024 swing
- -26.7pp toward R · 2008: -7.2pp · 2024: -34.0pp
- All cycles
- 2024: R+34.0 2020: R+26.6 2016: R+27.8 2012: R+14.3 2008: R+7.2
Not yet ingested
- Civics
- —
Market trends
- HPI YoY
- ▼ -75.76%
- Current HPI
- 325.0345
- Rent YoY
- ▼ -0.11%
- Metro
- Punta Gorda, FL
- State GDP YoY
- ▲ 3.28%
- F500 in state
- 36
Industry mix (Fortune 500 HQ in FL)
| Industry | F500 HQs | Revenue |
|---|---|---|
| Industrial Technology | 2 | $29B |
|
||
| Insurance | 2 | $17B |
|
||
| Retail | 1 | $60B |
|
||
| Technology Distribution | 1 | $58B |
|
||
| Homebuilding | 1 | $35B |
|
||
| Technology Manufacturing | 1 | $35B |
|
||
Price history
+184.5% since first listed16 events — show timeline
- 2026-04-22 Pending — Stellar MLS as Distributed by MLS Grid
- 2026-04-13 Price Changed $349,900 Stellar MLS as Distributed by MLS Grid
- 2026-04-13 Listed $3,499,000 Stellar MLS as Distributed by MLS Grid
- 2025-04-21 Listing Removed — Stellar MLS as Distributed by MLS Grid
- 2025-02-18 Price Changed $379,900 Stellar MLS as Distributed by MLS Grid
- 2024-10-23 Listed $399,900 Stellar MLS as Distributed by MLS Grid
- 2019-05-28 Sold (Public Records) $203,500 Public Records
- 2010-02-09 Sold (Public Records) $164,900 Public Records
- 2010-02-04 Sold (MLS) $174,900 Stellar MLS as Distributed by MLS Grid
- 2009-07-21 Listed $187,900 Stellar MLS as Distributed by MLS Grid
- 2008-12-24 Sold (Public Records) $195,000 Public Records
- 2008-12-19 Sold (MLS) $195,000 Stellar MLS as Distributed by MLS Grid
- 2008-09-19 Listed $199,900 Stellar MLS as Distributed by MLS Grid
- 2008-07-02 Listing Removed — Stellar MLS as Distributed by MLS Grid
- 2008-06-17 Listed $309,900 Stellar MLS as Distributed by MLS Grid
- 2002-02-12 Sold (Public Records) $123,000 Public Records
Property tax history
+7.6%/yrLatest (2025): $3,979 · +5.5% YoY. Source: county tax records.
Cash-flow waterfall
monthlySold comps — $/sqft
last 12 mo · ≤1 miLoading sold comps…