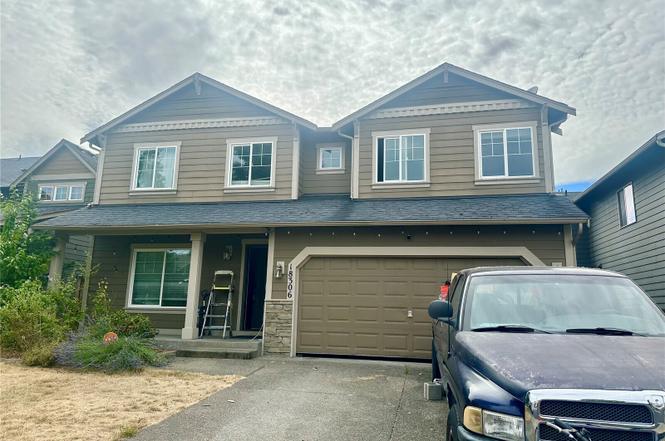
18306 71st Ave E · Frederickson, WA
Flood risk 1/10 · Minimal
- FEMA flood zone
- X (unshaded)
- Chance of flooding over 30 yrs
- 0.0%
- Est. flood insurance / yr
- $507 – $1,088
Fire risk 1/10 · Minimal
- Est. fire insurance / yr
- $604 – $1,122
Heat risk 3/10 · Minor
- Hot days now (above 87°F)
- 7 days/yr
- Hot days in 30 yrs
- 14 days/yr
Wind risk 1/10 · Minimal
- Chance of severe wind over 30 yrs
- —
Air-quality risk 7/10 · Major
- Unhealthy air days now
- 10 days/yr
- Unhealthy air days in 30 yrs
- 10 days/yr
Risk factors via First Street. Map © Google.
Why this score? — see what drove the D+ grade
The composite is a weighted blend of 9 inputs, each scored 0–100. Each bar is that input's sub-score; the figure is the points it added to the 100-point composite (weight × sub-score).
- ARV discount +15.0/15.0
- Cash flow +11.8/30.0
- Schools +4.9/10.0
- Livability +3.7/5.0
- DSCR +3.5/10.0
- 1% rule +3.4/10.0
- Rent growth +3.2/5.0
- Condition / age +2.5/5.0
- Appreciation +0.0/10.0
$433,000
🖨 Deal sheet (PDF) 📄 Offer letter ✓ Due diligence
Listing remarks
Spacious 5 bedroom, 2.5 bath home with endless potential! This property needs some work but offers a fantastic layout and room to make it your own. The open concept kitchen features a walk-in pantry and flows into a cozy living room with a gas fireplace which is perfect for gatherings. The large fully fenced backyard includes a shed, a generous patio area, and plenty of space for gardening, pets, or play. Upstairs, the oversized primary suite boasts a 5-piece bath and walk-in closet. Located near schools, dining, JBLM, Amazon, Boeing and major commuting routes.
Key facts
- Open concept kitchen
- Space for gardening
- Generous patio area
Tags
Neighborhood map
What this means for you Summary
Snapshot
- This is a 5-bed/3.0-bath single-family listed at $433k.
Deal economics
- At list price, monthly cash flow is $-115 ($-1k/yr) — negative.
- To cash-flow at today's rent, offer at most $413k (4.7% below list).
- To meet the 1% rule (rent ≥ 1% of price), the offer needs to be $363k (16.2% below list).
- Recommended offer: $363k (16.2% below list) — sets the bar for 1% rule.
- Cap rate 6.0% vs local median 3.5% in Frederickson — top-decile yield for the area; either an underpriced asset or a hidden risk that comps aren't pricing in. Stress-test before assuming the spread holds.
Location & tenants
- Location reads 73/100 on livability (#197 in WA) — a middle-class / working-renter tenant base. Strengths: employment A+, housing A+, health & safety A+; Watch: crime D+, amenities D-, commute F.
- Bethel School District (suburban): math 47% / reading 59% proficiency, ranked #103 of 291 in WA (top 35%) — acceptable for families but not a draw, mixed tenant base, ~2y average lease.
- Zoned schools: Elk Plain School of Choice (570 students, 39% FRL); Liberty Middle School (936 students, 55% FRL); Graham Kapowsin High School (2,011 students, 49% FRL).
- Market conditions: Rents rising (+2.8%/yr); 285 active listings in the ZIP; 5 comparable units currently listed for rent nearby; rentals leasing fast (median 12d on market — plan ~1-2 weeks tenant-placement turnaround); high-income renter base; 3,209 units permitted in Pierce County in 2024 (1,269 in 5+ unit buildings).
- This rent runs 37% of the median local income ($117k/yr) — at the standard rent-burdened threshold; future hikes will face affordability resistance.
Forward outlook
- Local home prices are declining (-3.0%/yr); year-one equity from $3k of loan paydown is wiped out by about $13k of value loss. Plan a longer hold.
- Pierce County population projected at +26% by 2050 — long-run rental-demand tailwind backs the buy-and-hold thesis.
Negotiation context
- It's been on market 85 days — a 6% lower offer ($407k) is reasonable based on typical stale-listing flexibility.
- 4 sale attempts since 16y ago; this cycle's ask has dropped $92k (18%) from the opening price — seller is motivated, your offer sets the floor, not the list.
Questions for the listing agent
- What do current leases actually rent for vs. the listed asking? Can we see a recent rent roll and the last 12 months of T-12 income?
- It's been on market 85 days. Have you received any prior offers? Is the seller open to a 16% concession, seller financing, or rate buy-down credit?
- What does the HOA fee cover, when was the last increase, and are there any pending special assessments or reserve-fund shortfalls?
- Why hasn't it sold? Are there any deal-killer items the seller is aware of (foundation, flood, title, zoning, code violations)?
- Is there a deadline driving the sale (1031 exchange, divorce, estate, relocation)? That informs how much negotiation room exists.
- Schools are F-rated, which usually means shorter tenancies and higher turnover. Who's the typical renter profile here, and what's been the actual vacancy rate?
- Crime grade is D in this area — have there been break-ins, vandalism, or insurance claims at this property in the last 3 years? What carrier currently insures it and at what premium?
- The area grade is low — what's the realistic commute time and amenity access for the typical tenant pool here? Any planned neighborhood developments (good or bad) we should know about?
- What's the average days-on-market for RENTAL listings here right now (not sales)? A rising rental-DOM trend means longer vacancies and softer asking-rent achievability than the comps imply.
- What's the recent tenant-quality profile in this submarket — average credit score on applications, eviction rate, late-payment / NSF rate, and stable-employment percentage? A property-management company in the area should have these aggregated.
- How much new for-sale + rental construction is in the pipeline within 1–3 miles? Heavy new supply typically softens prices + rents 12–24 months out; constrained supply supports both.
Investment metrics
- 1% rule
- 0.84% ✗
- Cap rate
- 5.97%
- Cash-on-cash
- -1.14%
- DSCR
- 0.95
- GRM
- 9.9
CMA / ARV
- ARV (on-the-fly)
- $568,008
- Comps found
- 12
Show comp detail 12 sales within ~0.75 mi
| Address | Dist | Beds/Ba | Sqft | Sold | Price | $/sf | Match |
|---|---|---|---|---|---|---|---|
| 7211 188th Street Ct E | 0.35mi | 5/3.5 | 2,343 (+4%) | 9mo | $560,000 | $239 | 68 |
| 18240 73rd Ave E | 0.09mi | 4/2.5 (-1) | 2,490 (+10%) | 6mo | $573,000 | $230 | 67 |
| 13924 178th St E | 0.34mi | 4/2.5 (-1) | 2,337 (+4%) | 6mo | $659,990 | $282 | 66 |
| 7720 181th St E | 0.38mi | 4/2.5 (-1) | 2,142 (-5%) | 2mo | $522,000 | $244 | 66 |
| 19320 74th Ave E | 0.69mi | 4/2.5 (-1) | 2,229 (-1%) | 2mo | $558,000 | $250 | 57 |
| 19203 76th Ave E | 0.66mi | 4/2.5 (-1) | 2,302 (+2%) | 5mo | $581,850 | $253 | 54 |
| 13904 178th St E | 0.34mi | 5/2.5 | 2,587 (+15%) | 7mo | $655,000 | $253 | 52 |
| 19304 74th Ave E | 0.64mi | 5/2.5 | 2,431 (+8%) | 6mo | $559,000 | $230 | 50 |
| 18914 76th Avenue Ct E | 0.51mi | 4/2.5 (-1) | 2,066 (-8%) | 7mo | $510,000 | $247 | 50 |
| 7205 178th St E | 0.34mi | 4/2.5 (-1) | 1,962 (-13%) | 7mo | $520,000 | $265 | 50 |
| 17621 74th Avenue Ct E | 0.42mi | 4/2.5 (-1) | 1,947 (-14%) | 2mo | $525,000 | $270 | 49 |
| 8108 185th Street Ct E | 0.67mi | 4/2.5 (-1) | 2,064 (-8%) | 8mo | $520,000 | $252 | 40 |
Match score weights: distance 35% · size 25% · config 20% · recency 20%. Top-matched comps best support the ARV.
Projected returns pro-forma
-3.0% appreciation · 2.79% rent growth · sell at horizon
- IRR
- -18.4%
- Equity multiple
- 0.35×
- Total profit
- $-78,223
- Equity at exit
- $64,562
- IRR
- -11.1%
- Equity multiple
- 0.34×
- Total profit
- $-80,499
- Equity at exit
- $37,438
Cash invested: $121,240 (down + closing). Projections, not guarantees.
Landlord ↔ Tenant lean methodology
- Overall (STATE)
- 28 Tenant-Leaning
- State Washington
- 28 Tenant-Leaning · D+8
- County
- — inherits STATE
- City
- — inherits STATE
ZIP-level market 98375
- Rents YoY
- 2.8%
- Active inventory
- 285
- Price-to-rent
- 9.9×
Monthly cashflow live
- Estimated rent
- $3,628 medium interval (Pro) →
- Mortgage (P&I)
- −$2,271
- Tax from tax record
- −$480 /mo · $5,760/yr
- Insurance
- −$180
- HOA
- −$50
- Vacancy / Maint / Mgmt
- −$762
- Net cashflow
- $-115
Break-even live
Sensitivity live
| Price | -10% $130 | -5% $7 | +0% $-115 | +5% $-238 | +10% $-360 |
|---|---|---|---|---|---|
| Rent | -10% $-402 | -5% $-259 | +0% $-115 | +5% $28 | +10% $171 |
| Rate | -1.0pp $103 | -0.5pp $-5 | base $-115 | +0.5pp $-227 | +1.0pp $-342 |
UW: 25.0% down · 7.5% · 30yr · 1.5% tax · 5.0% vac · 8.0% maint · 8.0% mgmt
Financing live
Cash to close
- Down payment
- $108,250
- Closing costs
- $12,990
- Reserves months
- —
- Total cash needed
- —
Loan-product check · same deal, 3 products live
Conventional
25% down · 7.5% · 30yr
- Down + closing
- —
- Monthly P&I
- —
- Monthly cashflow
- —
- DSCR
- —
- Eligible?
- —
Personal DTI + credit; lowest rate.
DSCR
20% down · 8.5% · 30yr
- Down + closing
- —
- Monthly P&I
- —
- Monthly cashflow
- —
- DSCR
- —
- Eligible?
- —
No personal income docs; deal must DSCR.
Hard money
10% down · 12.0% · 12mo
- Down + closing
- —
- Monthly P&I
- —
- Monthly cashflow
- —
- DSCR
- —
- Eligible?
- —
Short-term bridge; refi at stabilization.
Rent comps 5 comps
| Address | Beds | Baths | Sqft | Rent | $/sqft | DOM | Units | Dist |
|---|---|---|---|---|---|---|---|---|
| 18314 70th Avenue Ct E Puyallup, WA | 5.0 | 3.0 | 2382 | $3,200 | $1.34 | 26d | 1 | 0.04mi |
| 7513 177th Street Ct E Puyallup, WA | 1.0–4.0 | 1.0–2.5 | 1243 | $3,210 | $2.58 | 12d | 7 | 0.48mi |
| 20121 70th Ave E Spanaway, WA | 4.0 | 3.0 | 1680 | $2,950 | $1.76 | 1d | 1 | 1.13mi |
| 9110 178th Street Ct E Puyallup, WA | 4.0 | 3.0 | 2321 | $3,195 | $1.38 | 17d | 1 | 1.30mi |
| 20624 74th Ave E Spanaway, WA | 4.0 | 2.5 | 2197 | $1,400 | $0.64 | 0d | 1 | 1.48mi |
HOA detail
- Monthly dues
- $50 · $600/yr
- Likely covers
- gas
Listing history 17 events
-
2025-12-27status Pending
-
2025-12-08status Active
-
2025-12-08price $433,000
-
2025-10-10status Pending
-
2025-10-01price $480,000
-
2025-08-22price $510,000
-
2025-08-04$525,000 Active
-
2020-08-31soldstatus $415,000 Sold
-
2020-08-07status Pending
-
2020-08-05status Pending Inspection
-
2020-07-31$399,950 Active
-
2011-05-27soldstatus $220,000 Sold
-
2011-05-27soldstatus $220,000
-
2011-03-31status Pending
-
2011-02-17price $217,950
-
2010-10-16$224,950 Active
-
2010-10-06soldstatus $140,000
ⓘ Source: listings_history table (triggers on properties + properties_extension) + one-shot
backfill from property_details.listing_events for pre-trigger history.
Tax reassessment forecast WA · Resets to sale price
- Current annual tax
- $5,760 · $480/mo
- Projected year-2 tax
- $5,760 · $480/mo
- Expected delta
- $0/yr ($0/mo · 0.0%)
ⓘ Screening estimate from a state-policy table — verify with the county assessor before closing.
Climate risk First Street
- Flood 1/10 Low FEMA zone X (unshaded) · 0% chance over 30 yrs
- Wildfire 1/10 Low
- Heat 3/10 Moderate 7 d/yr ≥87°F today · 14 d/yr by 30 yrs out
- Wind 1/10 Low
- Air quality 7/10 Severe 10 unhealthy d/yr today · 10 by 30 yrs out
Nearby sold comps map
Loading sold comps map…
Walkable amenities ~0.75 mi
Loading nearby amenities…
Taxation est. · year 1
- Rental income
- $43,532
- − Mortgage interest
- −$24,255
- − Property taxes
- −$5,760
- − Insurance
- −$2,165
- − Repairs & maintenance
- −$3,483
- − Management
- −$3,483
- − HOA
- −$600
- − Depreciation
- −$12,596
- Taxable loss
- −$8,809
- Est. tax savings @ 24.0%
- +$2,114
- After-tax cash flow
- $731/yr
For passive investors: Depreciation is non-cash, so a rental often shows a tax loss while cash-flowing — sheltering income. Rental losses are passive: they offset passive income freely, and up to $25,000/yr can offset ordinary (W-2) income if you actively participate and your MAGI is under $100k (phasing out to $0 by $150k); unused losses carry forward. On sale, claimed depreciation is recaptured at up to 25%, and gains may owe capital-gains tax (a 1031 exchange can defer both). Figures are a year-1 estimate at your 24.0% rate — not tax advice; consult a CPA.
Schools (NCES district)
- District
- Bethel School District
- NCES district ID
- 5300480
- Math proficiency
- 47% ▬ 0.00%
- Reading proficiency
- 59% ▲ 2.00%
- Median HH income
- $65,872
- Composite
- 48.66/100
- National rank
- #4568
- State rank
- #103 of 291 in WA
Livability — Frederickson
- Score
- 73/100
- State rank
- #197
- US rank
- #5426
Category grades
Schools grade is shown separately in the Schools card above.
Census & demographics
- Census place
- Frederickson, WA
- County
- Pierce County · 788,257 people
- City population
- 32,195
- Metro
- Seattle-Tacoma-Bellevue, WA
- Population (ZIP)
- 31,187
- Household income
- $117,074
- Rent vs Own
- Severe rent burden
- 541.0
Population outlook (Pierce County) Hauer SSP2
- Today (2025)
- 956,648 people
- By 2030
- 1,010,862 · +5.7%
- By 2040
- 1,113,170 · +16.4%
- By 2050
- 1,206,524 · +26.1%
- By 2075
- 1,436,425 · +50.2%
- By 2100
- 1,563,654 · +63.5%
Race, ethnicity, and origin ACS 2023
- Neighborhood character
- Diverse neighborhood (Simpson 0.64)
- Race & ethnicity
- White 57% Two or more races 22% Hispanic / Latino 13% Black 8% Asian 6% Pacific Islander 1%
- Hispanic origin (detail)
- Mexican 10% Puerto Rican 1%
- Common ancestry
- Portuguese 3% Lithuanian 3% Italian 3%
- Foreign-born
- 11% · Canada, China, South Korea
- Languages at home
- 82% English-only · Spanish 8% Other Indo-European 2% Other Asian/Pacific 2%
Political lean MEDSL · Pierce
- 2024 margin
- D (+10.8) · D 53.9% · R 43.1% · Other 3.0%
- 2008→2024 swing
- -1.4pp toward R · 2008: 12.2pp · 2024: 10.8pp
- All cycles
- 2024: D+10.8 2020: D+11.2 2016: D+7.5 2012: D+11.0 2008: D+12.2
Not yet ingested
- Civics
- —
Market trends
- HPI YoY
- ▼ -189.98%
- Current HPI
- 285.0074
- Rent YoY
- ▲ 2.79%
- Metro
- Seattle-Tacoma-Bellevue, WA
- State GDP YoY
- ▲ 4.65%
- F500 in state
- 22
Industry mix (Fortune 500 HQ in WA)
| Industry | F500 HQs | Revenue |
|---|---|---|
| Retail | 2 | $269B |
|
||
| Technology / Retail | 1 | $638B |
|
||
| Technology | 1 | $245B |
|
||
| Telecommunications | 1 | $38B |
|
||
| Food / Beverage | 1 | $36B |
|
||
| Automotive / Trucks | 1 | $34B |
|
||
Price history
+209.3% since first listed17 events — show timeline
- 2025-12-27 Pending — NWMLS as Distributed by MLS Grid
- 2025-12-08 Relisted — NWMLS as Distributed by MLS Grid
- 2025-12-08 Price Changed $433,000 NWMLS as Distributed by MLS Grid
- 2025-10-10 Pending — NWMLS as Distributed by MLS Grid
- 2025-10-01 Price Changed $480,000 NWMLS as Distributed by MLS Grid
- 2025-08-22 Price Changed $510,000 NWMLS as Distributed by MLS Grid
- 2025-08-04 Listed $525,000 NWMLS as Distributed by MLS Grid
- 2020-08-31 Sold (MLS) $415,000 NWMLS as Distributed by MLS Grid
- 2020-08-07 Pending — NWMLS as Distributed by MLS Grid
- 2020-08-05 Pending — NWMLS as Distributed by MLS Grid
- 2020-07-31 Listed $399,950 NWMLS as Distributed by MLS Grid
- 2011-05-27 Sold (Public Records) $220,000 Public Records
- 2011-05-27 Sold (MLS) $220,000 NWMLS as Distributed by MLS Grid
- 2011-03-31 Pending — NWMLS as Distributed by MLS Grid
- 2011-02-17 Price Changed $217,950 NWMLS as Distributed by MLS Grid
- 2010-10-16 Listed $224,950 NWMLS as Distributed by MLS Grid
- 2010-10-06 Sold (Public Records) $140,000 Public Records
Property tax history
+10.6%/yrLatest (2026): $5,760 · +3.2% YoY. Source: county tax records.
Cash-flow waterfall
monthlySold comps — $/sqft
last 12 mo · ≤1 miLoading sold comps…