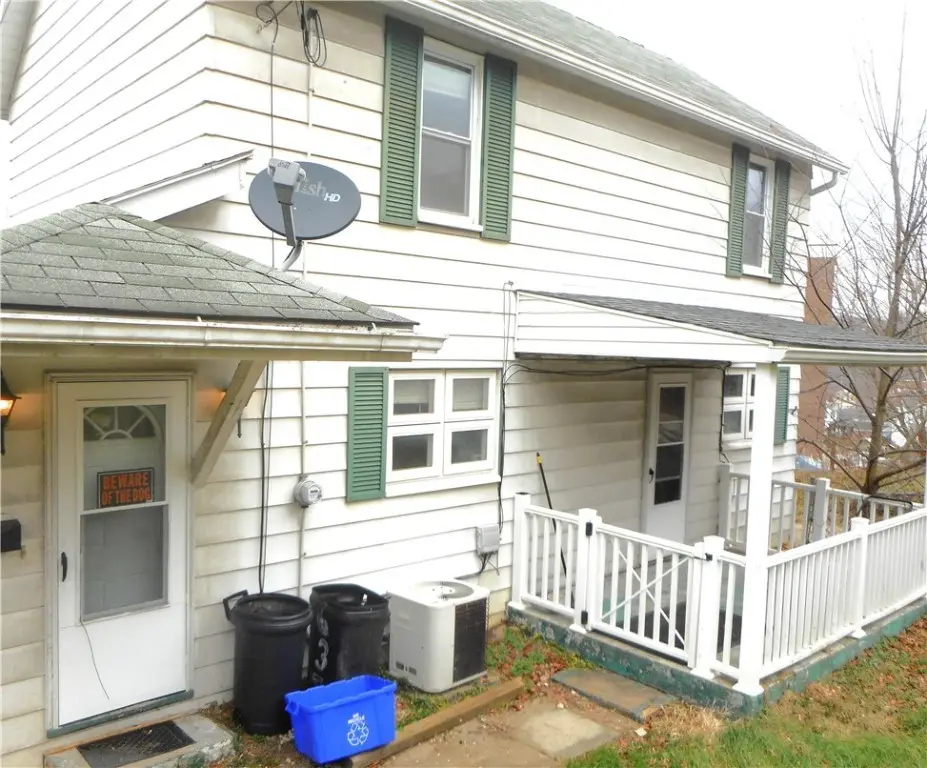
635 Rear Wood St · California, PA
Flood risk 1/10 · Minimal
- FEMA flood zone
- X (unshaded)
- Chance of flooding over 30 yrs
- 0.0%
- Est. flood insurance / yr
- $473 – $860
Fire risk 1/10 · Minimal
- Est. fire insurance / yr
- $511 – $949
Heat risk 4/10 · Minor
- Hot days now (above 98°F)
- 7 days/yr
- Hot days in 30 yrs
- 19 days/yr
Wind risk 2/10 · Minimal
- Chance of severe wind over 30 yrs
- —
Air-quality risk 2/10 · Minimal
- Unhealthy air days now
- 1 days/yr
- Unhealthy air days in 30 yrs
- 2 days/yr
Risk factors via First Street. Map © Google.
Why this score? — see what drove the A- grade
The composite is a weighted blend of 9 inputs, each scored 0–100. Each bar is that input's sub-score; the figure is the points it added to the 100-point composite (weight × sub-score).
- Cash flow +30.0/30.0
- ARV discount +15.0/15.0
- 1% rule +10.0/10.0
- DSCR +10.0/10.0
- Appreciation +4.7/10.0
- Schools +3.7/10.0
- Livability +2.8/5.0
- Rent growth +2.5/5.0
- Condition / age +2.5/5.0
$75,000
🖨 Deal sheet (PDF) 📄 Offer letter ✓ Due diligence
Listing remarks MLS
A fantastic opportunity for immediate income or a convenient owner-occupant purchase. This property is move-in ready and has been well maintained. Enjoy the large, functional eat-in kitchen and the incredible convenience of laundry on the first floor. The extra lot is a major asset for parking vehicles or creating a secure outdoor space. Minutes from PennWest University (CALU). Includes the necessary Student Rental Permit. A smart investment waiting for you!
Key facts
- Extra lot
- Eat-in kitchen
- 1,319 sq ft lot
Tags
Neighborhood map
What this means for you Summary
Snapshot
- This is a 3-bed/1.0-bath single-family listed at $75k.
Deal economics
- At list price, monthly cash flow is $561 ($7k/yr) — positive.
- The deal already cash-flows at list — no discount required.
- Meets the 1% rule at list price ($1k rent vs $75k).
- Recommended offer: $66k (12.0% below list) — sets the bar for market timing.
Location & tenants
- Location reads 56/100 on livability (#1,648 in PA) — a working-class tenant base; expect higher turnover. Strengths: cost of living A+, housing A-; Watch: crime C-, amenities F, commute F.
- California Area SD (rural): math 31% / reading 58% proficiency, ranked #295 of 539 in PA (top 55%) — families likely to look elsewhere, expect single-tenant / working-renter base with shorter leases.
- Zoned schools: California Area El Sch (math 32% / reading 62%, grade D-, #737 of 1,518 statewide, top 52%, 490 students, 60% FRL); California Area Ms (math 27% / reading 67%, grade D+, #163 of 512 statewide, top 33%, 138 students, 62% FRL); California Area Shs (math 74%, 286 students, 36% FRL).
- Market conditions: 18 active listings in the ZIP; 5 comparable units currently listed for rent nearby; rentals at typical pace (median 25d on market — plan ~3-4 weeks tenant-placement turnaround); 40% of comp listings sitting > 30 days — soft ceiling on asking rent; 489 units permitted in Washington County in 2024 (30 in 5+ unit buildings).
Forward outlook
- In year one you build about $102 of equity ($519 loan paydown + $-417 appreciation (-0.6% local appreciation)).
- Washington County population projected to shrink 6% by 2050 — rents likely to lag national; underwrite the cash flow, not the appreciation.
- At projected returns (-0.6% appreciation + 3.0% rent growth), your $21k cash investment doubles in ~3 years — after that, you're playing with house money.
Negotiation context
- It's been on market 208 days — a 12% lower offer ($66k) is reasonable based on typical stale-listing flexibility.
- 5 sale attempts since 18y ago with the ask held roughly flat each time — persistent listings suggest the price (not the market) is what's stuck; bring a comps-based counter.
Risks & watch-outs
- Watch-outs: built in 1900 — expect roof / HVAC / electrical / plumbing capex.
Questions for the listing agent
- It's been on market 208 days. Have you received any prior offers? Is the seller open to a 12% concession, seller financing, or rate buy-down credit?
- Built in 1900 — when were the roof, HVAC, electrical panel, plumbing, and water heater last replaced?
- Why hasn't it sold? Are there any deal-killer items the seller is aware of (foundation, flood, title, zoning, code violations)?
- Is there a deadline driving the sale (1031 exchange, divorce, estate, relocation)? That informs how much negotiation room exists.
- Schools are D-rated, which usually means shorter tenancies and higher turnover. Who's the typical renter profile here, and what's been the actual vacancy rate?
- What's the average days-on-market for RENTAL listings here right now (not sales)? A rising rental-DOM trend means longer vacancies and softer asking-rent achievability than the comps imply.
- What's the recent tenant-quality profile in this submarket — average credit score on applications, eviction rate, late-payment / NSF rate, and stable-employment percentage? A property-management company in the area should have these aggregated.
- How much new for-sale + rental construction is in the pipeline within 1–3 miles? Heavy new supply typically softens prices + rents 12–24 months out; constrained supply supports both.
Investment metrics
- 1% rule
- 1.85% ✓
- Cap rate
- 15.27%
- Cash-on-cash
- 32.08%
- DSCR
- 2.43
- GRM
- 4.5
CMA / ARV
- ARV (median comp)
- $113,231
- List price
- $75,000
- Delta
- -33.76%
- Verdict
- UNDERPRICED
- Comps
- 20 within 1.0 mi
Show comp detail 2 sales within ~0.75 mi
| Address | Dist | Beds/Ba | Sqft | Sold | Price | $/sf | Match |
|---|---|---|---|---|---|---|---|
| 324 Wood St | 0.19mi | 3/1.0 | 1,557 (-8%) | 4mo | $52,000 | $33 | 74 |
| 625 Liberty St | 0.06mi | 3/1.5 | 1,954 (+15%) | 23mo | $156,000 | $80 | 51 |
Match score weights: distance 35% · size 25% · config 20% · recency 20%. Top-matched comps best support the ARV.
Projected returns pro-forma
-0.56% appreciation · 3.0% rent growth · sell at horizon
- IRR
- 31.7%
- Equity multiple
- 2.51×
- Total profit
- $31,650
- Equity at exit
- $19,715
- IRR
- 35.9%
- Equity multiple
- 4.88×
- Total profit
- $81,421
- Equity at exit
- $22,108
Cash invested: $21,000 (down + closing). Projections, not guarantees.
Landlord ↔ Tenant lean methodology
- Overall (STATE)
- 62 Landlord-Friendly
- State Pennsylvania
- 62 Landlord-Friendly · EVEN
- County
- — inherits STATE
- City
- — inherits STATE
ZIP-level market 15419
- Home prices YoY
- -0.3%
- Active inventory
- 18
- Price-to-rent
- 4.5×
Monthly cashflow live
- Estimated rent
- $1,384 high interval (Pro) →
- Mortgage (P&I)
- −$393
- Tax from tax record
- −$107 /mo · $1,287/yr
- Insurance
- −$31
- HOA
- −$0
- Vacancy / Maint / Mgmt
- −$291
- Net cashflow
- $561
Break-even live
Sensitivity live
| Price | -10% $604 | -5% $583 | +0% $561 | +5% $540 | +10% $519 |
|---|---|---|---|---|---|
| Rent | -10% $452 | -5% $507 | +0% $561 | +5% $616 | +10% $671 |
| Rate | -1.0pp $599 | -0.5pp $580 | base $561 | +0.5pp $542 | +1.0pp $522 |
UW: 25.0% down · 7.5% · 30yr · 1.5% tax · 5.0% vac · 8.0% maint · 8.0% mgmt
Financing live
Cash to close
- Down payment
- $18,750
- Closing costs
- $2,250
- Reserves months
- —
- Total cash needed
- —
Loan-product check · same deal, 3 products live
Conventional
25% down · 7.5% · 30yr
- Down + closing
- —
- Monthly P&I
- —
- Monthly cashflow
- —
- DSCR
- —
- Eligible?
- —
Personal DTI + credit; lowest rate.
DSCR
20% down · 8.5% · 30yr
- Down + closing
- —
- Monthly P&I
- —
- Monthly cashflow
- —
- DSCR
- —
- Eligible?
- —
No personal income docs; deal must DSCR.
Hard money
10% down · 12.0% · 12mo
- Down + closing
- —
- Monthly P&I
- —
- Monthly cashflow
- —
- DSCR
- —
- Eligible?
- —
Short-term bridge; refi at stabilization.
Rent comps 5 comps
| Address | Beds | Baths | Sqft | Rent | $/sqft | DOM | Units | Dist |
|---|---|---|---|---|---|---|---|---|
| 319 5th St California, PA | 4.0 | 2.0 | 1369 | $1,395 | $1.02 | 25d | 1 | 0.11mi |
| 214 3rd St California, PA | 4.0 | 2.0 | 1650 | $1,650 | $1.00 | 23d | 1 | 0.27mi |
| 456 Second St Unit 1 California, PA | 4.0 | 2.0 | 1451 | $1,500 | $1.03 | 45d | 1 | 0.36mi |
| 54 Temperance Way Unit 7 California, PA | 3.0 | 2.0 | 1300 | $1,095 | $0.84 | 16d | 1 | 0.40mi |
| 115 1st St Unit 1 California, PA | 3.0 | 1.0 | 1200 | $950 | $0.79 | 45d | 1 | 0.41mi |
Listing history 26 events
-
2026-06-21days on market $75,000 Active 208 DOM
-
2026-06-21days on market $75,000 Active 207 DOM
-
2026-06-18days on market $75,000 Active 205 DOM
-
2026-06-17days on market $75,000 Active 204 DOM
-
2026-06-16days on market $75,000 Active 203 DOM
-
2026-06-15days on market $75,000 Active 202 DOM
-
2026-06-13days on market $75,000 Active 200 DOM
-
2026-06-12days on market $75,000 Active 199 DOM
-
2026-06-09days on market $75,000 Active 196 DOM
-
2026-06-08days on market $75,000 Active 195 DOM
-
2026-06-08days on market $75,000 Active 194 DOM
-
2026-06-04days on market $75,000 Active 190 DOM
-
2026-06-02days on market $75,000 Active 189 DOM
-
2026-06-01days on market $75,000 Active 188 DOM
-
2026-05-31days on market $75,000 Active 187 DOM
-
2025-11-25$75,000 Active 462-char remark
Show marketing remark (462 chars)
A fantastic opportunity for immediate income or a convenient owner-occupant purchase. This property is move-in ready and has been well maintained. Enjoy the large, functional eat-in kitchen and the incredible convenience of laundry on the first floor. The extra lot is a major asset for parking vehicles or creating a secure outdoor space. Minutes from PennWest University (CALU). Includes the necessary Student Rental Permit. A smart investment waiting for you!
-
2025-11-10historical Expired 222-char remark
Show marketing remark (222 chars)
This long-term rental is a great investment or starter home. Laundry on 1st Fl, large eat-in kitchen and additional lot for parking / pets. Has student rental permit. Close to PennWest University ( CALU ). Well maintained.
-
2024-11-11$75,000 Active 222-char remark
Show marketing remark (222 chars)
This long-term rental is a great investment or starter home. Laundry on 1st Fl, large eat-in kitchen and additional lot for parking / pets. Has student rental permit. Close to PennWest University ( CALU ). Well maintained.
-
2022-09-09soldstatus $75,000
-
2022-09-07soldstatus $75,000 Closed
-
2022-08-17status Pending
-
2022-08-03price $85,000
-
2022-07-22$90,000 Active
-
2012-06-04$74,900
-
2008-10-03soldstatus $53,000
-
2008-07-15$53,000
ⓘ Source: listings_history table (triggers on properties + properties_extension) + one-shot
backfill from property_details.listing_events for pre-trigger history.
Tax reassessment forecast PA · Partial reset (capped growth)
- Current annual tax
- $1,287 · $107/mo
- Projected year-2 tax
- $1,287 · $107/mo
- Expected delta
- $0/yr ($0/mo · 0.0%)
ⓘ Screening estimate from a state-policy table — verify with the county assessor before closing.
Climate risk First Street
- Flood 1/10 Low FEMA zone X (unshaded) · 0% chance over 30 yrs
- Wildfire 1/10 Low
- Heat 4/10 Moderate 7 d/yr ≥98°F today · 19 d/yr by 30 yrs out
- Wind 2/10 Low
- Air quality 2/10 Low 1 unhealthy d/yr today · 2 by 30 yrs out
Nearby sold comps map
Loading sold comps map…
Walkable amenities ~0.75 mi
Loading nearby amenities…
Taxation est. · year 1
- Rental income
- $16,605
- − Mortgage interest
- −$4,201
- − Property taxes
- −$1,287
- − Insurance
- −$375
- − Repairs & maintenance
- −$1,328
- − Management
- −$1,328
- − Depreciation
- −$2,182
- Taxable income
- $5,903
- Est. tax owed @ 24.0%
- −$1,417
- After-tax cash flow
- $5,320/yr
For passive investors: Depreciation is non-cash, so a rental often shows a tax loss while cash-flowing — sheltering income. Rental losses are passive: they offset passive income freely, and up to $25,000/yr can offset ordinary (W-2) income if you actively participate and your MAGI is under $100k (phasing out to $0 by $150k); unused losses carry forward. On sale, claimed depreciation is recaptured at up to 25%, and gains may owe capital-gains tax (a 1031 exchange can defer both). Figures are a year-1 estimate at your 24.0% rate — not tax advice; consult a CPA.
Schools (NCES district)
- District
- California Area SD
- NCES district ID
- 4204710
- Math proficiency
- 31% ▼ -19.00%
- Reading proficiency
- 58% ▼ -9.00%
- Median HH income
- $40,621
- Composite
- 37.22/100
- National rank
- #4466
- State rank
- #295 of 539 in PA
Livability — California
- Score
- 56/100
- State rank
- #1648
- US rank
- #22817
Category grades
Schools grade is shown separately in the Schools card above.
Census & demographics
- Census place
- California, PA
- City population
- 5,469
- Population (ZIP)
- 3,527
Population outlook (Washington County) Hauer SSP2
- Today (2025)
- 208,060 people
- By 2030
- 207,168 · -0.4%
- By 2040
- 202,738 · -2.6%
- By 2050
- 195,269 · -6.1%
- By 2075
- 175,588 · -15.6%
- By 2100
- 145,827 · -29.9%
Race, ethnicity, and origin ACS 2023
- Neighborhood character
- Predominantly White (74%)
- Race & ethnicity
- White 74% Black 12% Two or more races 10% Hispanic / Latino 2% Asian 1%
- Common ancestry
- Romanian 6% Slovak 3% Scotch-Irish 2%
- Foreign-born
- 3% · Canada, China
- Languages at home
- 97% English-only · Spanish 1% French/Haitian/Cajun 1% Other Indo-European 1%
Political lean MEDSL · Washington
- 2024 margin
- Strong R (+25.5) · D 36.9% · R 62.4%
- 2008→2024 swing
- -20.8pp toward R · 2008: -4.7pp · 2024: -25.5pp
- All cycles
- 2024: R+25.5 2020: R+22.8 2016: R+25.3 2012: R+13.3 2008: R+4.7
Not yet ingested
- Civics
- —
Market trends
- HPI YoY
- ▼ -0.56%
- Current HPI
- 160.7366
- Rent YoY
- —
- Metro
- —
- State GDP YoY
- ▲ 1.68%
- F500 in state
- 34
Industry mix (Fortune 500 HQ in PA)
| Industry | F500 HQs | Revenue |
|---|---|---|
| Healthcare | 2 | $309B |
|
||
| Insurance | 2 | $27B |
|
||
| Telecommunications / Media | 1 | $124B |
|
||
| Industrial Distribution | 1 | $22B |
|
||
| Financial Services | 1 | $20B |
|
||
| Chemicals / Materials | 1 | $18B |
|
||
Price history
+41.5% since first listed11 events — show timeline
- 2025-11-25 Listed $75,000 West Penn MLS
- 2025-11-10 Delisted — West Penn MLS
- 2024-11-11 Listed $75,000 West Penn MLS
- 2022-09-09 Sold (Public Records) $75,000 Public Records
- 2022-09-07 Sold (MLS) $75,000 West Penn MLS
- 2022-08-17 Pending — West Penn MLS
- 2022-08-03 Price Changed $85,000 West Penn MLS
- 2022-07-22 Listed $90,000 West Penn MLS
- 2012-06-04 Listed $74,900 West Penn MLS
- 2008-10-03 Sold (MLS) $53,000 West Penn MLS
- 2008-07-15 Listed $53,000 West Penn MLS
Property tax history
+7.6%/yrLatest (2026): $1,287 · +0.0% YoY. Source: county tax records.
Cash-flow waterfall
monthlySold comps — $/sqft
last 12 mo · ≤1 miLoading sold comps…