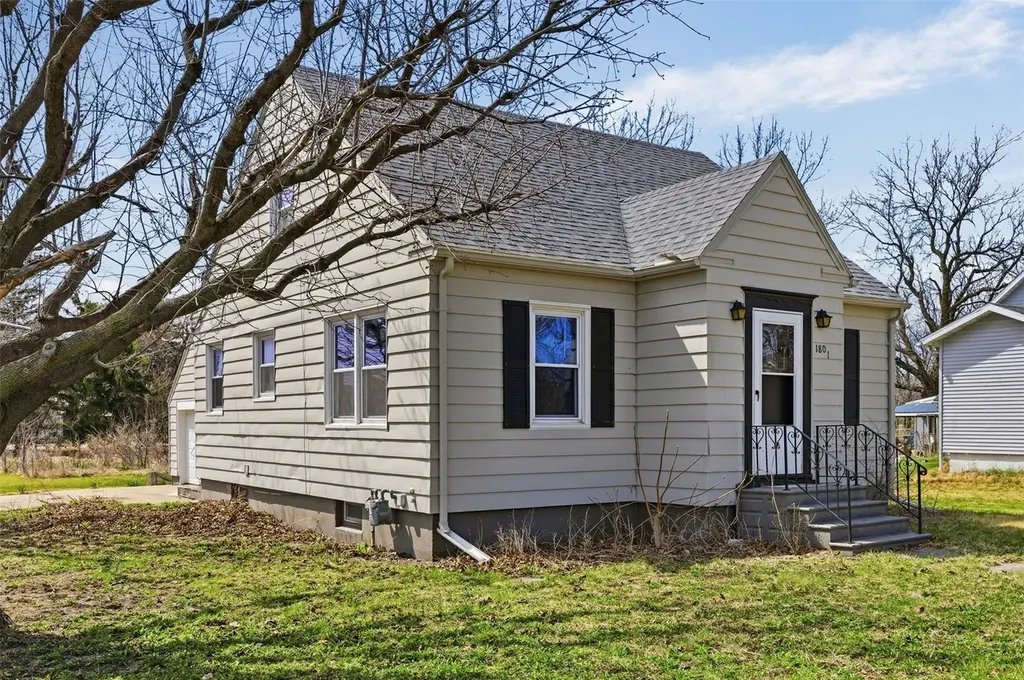
1801 Wilson Ave SW · Cedar Rapids, IA
Flood risk 1/10 · Minimal
- FEMA flood zone
- X (unshaded)
- Chance of flooding over 30 yrs
- 0.0%
- Est. flood insurance / yr
- $473 – $860
Fire risk 1/10 · Minimal
- Est. fire insurance / yr
- $902 – $1,676
Heat risk 3/10 · Minor
- Hot days now (above 103°F)
- 7 days/yr
- Hot days in 30 yrs
- 15 days/yr
Wind risk 2/10 · Minimal
- Chance of severe wind over 30 yrs
- —
Air-quality risk 2/10 · Minimal
- Unhealthy air days now
- 0 days/yr
- Unhealthy air days in 30 yrs
- 1 days/yr
Risk factors via First Street. Map © Google.
Why this score? — see what drove the C- grade
The composite is a weighted blend of 9 inputs, each scored 0–100. Each bar is that input's sub-score; the figure is the points it added to the 100-point composite (weight × sub-score).
- ARV discount +15.0/15.0
- Cash flow +14.6/30.0
- Rent growth +4.7/5.0
- Schools +4.7/10.0
- DSCR +4.5/10.0
- 1% rule +3.9/10.0
- Livability +3.9/5.0
- Condition / age +2.5/5.0
- Appreciation +0.0/10.0
$184,900
🖨 Deal sheet (PDF) 📄 Offer letter ✓ Due diligence
Listing remarks MLS
Charming 4-bedroom, 1-bath Craftsman-style 1.75-story home featuring beautiful natural hardwood floors and an updated kitchen and bath. Situated on a large lot, this property offers plenty of outdoor space and potential. A great opportunity for a first-time home buyer or investor. Home is being sold as is.
Key facts
- 0.26 acre lot
- Garage
- Built 1951
Neighborhood map
What this means for you Summary
Snapshot
- This is a 4-bed/1.0-bath single-family listed at $185k.
Deal economics
- At list price, monthly cash flow is $46 ($547/yr) — positive.
- The deal already cash-flows at list — no discount required.
- To meet the 1% rule (rent ≥ 1% of price), the offer needs to be $165k (10.7% below list).
- Recommended offer: $165k (10.7% below list) — sets the bar for 1% rule.
- Cap rate 6.6% vs local median 3.5% in Cedar Rapids — top-decile yield for the area; either an underpriced asset or a hidden risk that comps aren't pricing in. Stress-test before assuming the spread holds.
Location & tenants
- Location reads 78/100 on livability (#134 in IA, #2,474 nationally) — a middle-class / working-renter tenant base. Strengths: cost of living A+, housing A+, health & safety A+; Watch: crime C-, commute F.
- Cedar Rapids Community School District (urban): math 50% / reading 59% proficiency, ranked #265 of 289 in IA (top 92%) — acceptable for families but not a draw, mixed tenant base, ~2y average lease.
- Zoned schools: Van Buren Elementary School (math 42% / reading 42%, grade F, #563 of 616 statewide, top 93%, 365 students, 83% FRL); Wilson Middle School (math 42% / reading 49%, grade D+, #231 of 246 statewide, top 94%, 395 students, 72% FRL); Thomas Jefferson High School (math 41% / reading 62%, grade D+, #307 of 336 statewide, top 91%, 1,543 students, 56% FRL) — zoned schools average 71% FRL vs 43% district-wide (27 pts higher); higher-poverty schools than district average — tighter screening recommended.
- Market conditions: Rents rising fast (+8.8%/yr); 419 active listings in the ZIP; 1 comparable units currently listed for rent nearby; 1,023 units permitted in Linn County in 2024 (456 in 5+ unit buildings).
- This rent runs 32% of the median local income ($62k/yr) — at the standard rent-burdened threshold; future hikes will face affordability resistance.
Forward outlook
- Local home prices are declining (-3.0%/yr); year-one equity from $1k of loan paydown is wiped out by about $6k of value loss. Plan a longer hold.
- Linn County population projected at +16% by 2050 — long-run rental-demand tailwind backs the buy-and-hold thesis.
Negotiation context
- It's been on market 29 days — a 2% lower offer ($182k) is reasonable based on typical stale-listing flexibility.
- 3 sale attempts since 3y ago with the ask held roughly flat each time — persistent listings suggest the price (not the market) is what's stuck; bring a comps-based counter.
- Current owner paid $158k; 17% above their basis — modest negotiation headroom, anchor on the comps not their cost.
Risks & watch-outs
- Watch-outs: built in 1951 — expect roof / HVAC / electrical / plumbing capex.
Questions for the listing agent
- Built in 1951 — when were the roof, HVAC, electrical panel, plumbing, and water heater last replaced?
- Is there a deadline driving the sale (1031 exchange, divorce, estate, relocation)? That informs how much negotiation room exists.
- Schools are B-rated — typically a magnet for longer-tenancy family renters. What's the average tenant stay here, and is there a school-zone premium baked into asking?
- What's the average days-on-market for RENTAL listings here right now (not sales)? A rising rental-DOM trend means longer vacancies and softer asking-rent achievability than the comps imply.
- What's the recent tenant-quality profile in this submarket — average credit score on applications, eviction rate, late-payment / NSF rate, and stable-employment percentage? A property-management company in the area should have these aggregated.
- How much new for-sale + rental construction is in the pipeline within 1–3 miles? Heavy new supply typically softens prices + rents 12–24 months out; constrained supply supports both.
Investment metrics
- 1% rule
- 0.89% ✗
- Cap rate
- 6.59%
- Cash-on-cash
- 1.06%
- DSCR
- 1.05
- GRM
- 9.3
CMA / ARV
- ARV (median comp)
- $300,194
- List price
- $184,900
- Delta
- -38.41%
- Verdict
- UNDERPRICED
- Comps
- 20 within 1.0 mi
Show comp detail 12 sales within ~0.75 mi
| Address | Dist | Beds/Ba | Sqft | Sold | Price | $/sf | Match |
|---|---|---|---|---|---|---|---|
| 1806 Holly Meadow Ave SW | 0.35mi | 3/2.0 (-1) | 1,204 (+3%) | 4mo | $299,990 | $249 | 66 |
| 1506 14th Ave Ave SW | 0.58mi | 4/1.0 | 1,160 (-0%) | 8mo | $142,500 | $123 | 66 |
| 2721 Matthew Dr SW | 0.64mi | 3/1.5 (-1) | 1,192 (+2%) | 2mo | $155,000 | $130 | 57 |
| 1812 Holly Meadow Ave SW | 0.36mi | 3/2.0 (-1) | 1,336 (+15%) | 2mo | $284,900 | $213 | 48 |
| 2710 Hickory Dr SW | 0.61mi | 3/1.0 (-1) | 1,040 (-11%) | 3mo | $218,000 | $210 | 47 |
| 1703 14th Ave SW | 0.52mi | 3/1.0 (-1) | 1,008 (-13%) | 2mo | $175,000 | $174 | 47 |
| 2106 Shady Grove Rd Rd SW | 0.39mi | 3/2.0 (-1) | 1,283 (+10%) | 11mo | $302,000 | $235 | 46 |
| 2201 Hughes Dr SW | 0.32mi | 3/2.5 (-1) | 1,286 (+10%) | 14mo | $205,000 | $159 | 45 |
| 1902 Probst Ct SW | 0.47mi | 3/2.0 (-1) | 1,294 (+11%) | 12mo | $264,900 | $205 | 40 |
| 1503 14th Avenue Ave SW | 0.56mi | 3/1.0 (-1) | 1,276 (+10%) | 15mo | $133,000 | $104 | 40 |
| 1836 Holly Meadow Ave SW | 0.37mi | 3/2.0 (-1) | 1,336 (+15%) | 14mo | $274,990 | $206 | 38 |
| 1122 20th Ave Ave SW | 0.66mi | 4/1.5 | 993 (-15%) | 15mo | $200,000 | $201 | 30 |
Match score weights: distance 35% · size 25% · config 20% · recency 20%. Top-matched comps best support the ARV.
Projected returns pro-forma
-3.0% appreciation · 8.0% rent growth · sell at horizon
- IRR
- -9.2%
- Equity multiple
- 0.65×
- Total profit
- $-18,321
- Equity at exit
- $27,569
- IRR
- 5.9%
- Equity multiple
- 1.53×
- Total profit
- $27,537
- Equity at exit
- $15,987
Cash invested: $51,772 (down + closing). Projections, not guarantees.
Landlord ↔ Tenant lean methodology
- Overall (STATE)
- 83 Strongly Landlord-Friendly
- State Iowa
- 83 Strongly Landlord-Friendly · R+6
- County
- — inherits STATE
- City
- — inherits STATE
ZIP-level market 52404
- Rents YoY
- 8.8%
- Active inventory
- 419
- Price-to-rent
- 9.3×
Monthly cashflow live
- Estimated rent
- $1,650 medium interval (Pro) →
- Mortgage (P&I)
- −$970
- Tax from tax record
- −$212 /mo · $2,538/yr
- Insurance
- −$77
- HOA
- −$0
- Vacancy / Maint / Mgmt
- −$347
- Net cashflow
- $46
Break-even live
Sensitivity live
| Price | -10% $150 | -5% $98 | +0% $46 | +5% $-7 | +10% $-59 |
|---|---|---|---|---|---|
| Rent | -10% $-85 | -5% $-20 | +0% $46 | +5% $111 | +10% $176 |
| Rate | -1.0pp $139 | -0.5pp $93 | base $46 | +0.5pp $-2 | +1.0pp $-51 |
UW: 25.0% down · 7.5% · 30yr · 1.5% tax · 5.0% vac · 8.0% maint · 8.0% mgmt
Financing live
Cash to close
- Down payment
- $46,225
- Closing costs
- $5,547
- Reserves months
- —
- Total cash needed
- —
Loan-product check · same deal, 3 products live
Conventional
25% down · 7.5% · 30yr
- Down + closing
- —
- Monthly P&I
- —
- Monthly cashflow
- —
- DSCR
- —
- Eligible?
- —
Personal DTI + credit; lowest rate.
DSCR
20% down · 8.5% · 30yr
- Down + closing
- —
- Monthly P&I
- —
- Monthly cashflow
- —
- DSCR
- —
- Eligible?
- —
No personal income docs; deal must DSCR.
Hard money
10% down · 12.0% · 12mo
- Down + closing
- —
- Monthly P&I
- —
- Monthly cashflow
- —
- DSCR
- —
- Eligible?
- —
Short-term bridge; refi at stabilization.
Rent comps 1 comps
| Address | Beds | Baths | Sqft | Rent | $/sqft | DOM | Units | Dist |
|---|---|---|---|---|---|---|---|---|
| 1001 C Ave NW Cedar Rapids, IA | 3.0 | 1.5 | 1446 | $1,500 | $1.04 | 15d | 1 | 1.48mi |
Listing history 12 events
-
2026-05-15status Active 307-char remark
Show marketing remark (307 chars)
Charming 4-bedroom, 1-bath Craftsman-style 1.75-story home featuring beautiful natural hardwood floors and an updated kitchen and bath. Situated on a large lot, this property offers plenty of outdoor space and potential. A great opportunity for a first-time home buyer or investor. Home is being sold as is.
-
2026-04-28status Pending 307-char remark
Show marketing remark (307 chars)
Charming 4-bedroom, 1-bath Craftsman-style 1.75-story home featuring beautiful natural hardwood floors and an updated kitchen and bath. Situated on a large lot, this property offers plenty of outdoor space and potential. A great opportunity for a first-time home buyer or investor. Home is being sold as is.
-
2026-04-10$184,900 Active 307-char remark
Show marketing remark (307 chars)
Charming 4-bedroom, 1-bath Craftsman-style 1.75-story home featuring beautiful natural hardwood floors and an updated kitchen and bath. Situated on a large lot, this property offers plenty of outdoor space and potential. A great opportunity for a first-time home buyer or investor. Home is being sold as is.
-
2023-12-20soldstatus $158,000
-
2023-12-18historical 237-char remark
Show marketing remark (237 chars)
This Beautiful, BIG LOT, cottage style home is perfect for a family just getting started! The 4 bed 1 bath house is perfect for a growing family. The natural hardwood floors are absolutely beautiful and this property has so many updates!
-
2023-12-18soldstatus $158,000 Closed 237-char remark
Show marketing remark (237 chars)
This Beautiful, BIG LOT, cottage style home is perfect for a family just getting started! The 4 bed 1 bath house is perfect for a growing family. The natural hardwood floors are absolutely beautiful and this property has so many updates!
-
2023-11-17status Pending 237-char remark
Show marketing remark (237 chars)
This Beautiful, BIG LOT, cottage style home is perfect for a family just getting started! The 4 bed 1 bath house is perfect for a growing family. The natural hardwood floors are absolutely beautiful and this property has so many updates!
-
2023-11-08$158,000 Active 237-char remark
Show marketing remark (237 chars)
This Beautiful, BIG LOT, cottage style home is perfect for a family just getting started! The 4 bed 1 bath house is perfect for a growing family. The natural hardwood floors are absolutely beautiful and this property has so many updates!
-
2016-09-27soldstatus $1,575,952
-
2015-01-22soldstatus $2,051,000
-
2008-09-25soldstatus $112,500
-
2007-08-02soldstatus $95,000
ⓘ Source: listings_history table (triggers on properties + properties_extension) + one-shot
backfill from property_details.listing_events for pre-trigger history.
Tax reassessment forecast IA · Partial reset (capped growth)
- Current annual tax
- $2,538 · $212/mo
- Projected year-2 tax
- $2,720 · $227/mo
- Expected delta
- +$182/yr (+$15/mo · 7.2%)
ⓘ Screening estimate from a state-policy table — verify with the county assessor before closing.
Climate risk First Street
- Flood 1/10 Low FEMA zone X (unshaded) · 0% chance over 30 yrs
- Wildfire 1/10 Low
- Heat 3/10 Moderate 7 d/yr ≥103°F today · 15 d/yr by 30 yrs out
- Wind 2/10 Low
- Air quality 2/10 Low 0 unhealthy d/yr today · 1 by 30 yrs out
Nearby sold comps map
Loading sold comps map…
Walkable amenities ~0.75 mi
Loading nearby amenities…
Taxation est. · year 1
- Rental income
- $19,805
- − Mortgage interest
- −$10,357
- − Property taxes
- −$2,538
- − Insurance
- −$924
- − Repairs & maintenance
- −$1,584
- − Management
- −$1,584
- − Depreciation
- −$5,379
- Taxable loss
- −$2,563
- Est. tax savings @ 24.0%
- +$615
- After-tax cash flow
- $1,163/yr
For passive investors: Depreciation is non-cash, so a rental often shows a tax loss while cash-flowing — sheltering income. Rental losses are passive: they offset passive income freely, and up to $25,000/yr can offset ordinary (W-2) income if you actively participate and your MAGI is under $100k (phasing out to $0 by $150k); unused losses carry forward. On sale, claimed depreciation is recaptured at up to 25%, and gains may owe capital-gains tax (a 1031 exchange can defer both). Figures are a year-1 estimate at your 24.0% rate — not tax advice; consult a CPA.
Schools (NCES district)
- District
- Cedar Rapids Community School District
- NCES district ID
- 1906540
- Math proficiency
- 50% ▼ -12.00%
- Reading proficiency
- 59% ▼ -6.00%
- Median HH income
- $53,568
- Composite
- 46.82/100
- National rank
- #2378
- State rank
- #265 of 289 in IA
Livability — Cedar Rapids
- Score
- 78/100
- State rank
- #134
- US rank
- #2474
Category grades
Schools grade is shown separately in the Schools card above.
Census & demographics
- Census place
- Cedar Rapids, IA
- County
- Linn County · 179,860 people
- City population
- 137,154
- Metro
- Cedar Rapids, IA
- Population (ZIP)
- 42,958
- Household income
- $61,870
- Rent vs Own
- Severe rent burden
- 1041.0
Population outlook (Linn County) Hauer SSP2
- Today (2025)
- 239,589 people
- By 2030
- 248,587 · +3.8%
- By 2040
- 264,817 · +10.5%
- By 2050
- 278,685 · +16.3%
- By 2075
- 311,754 · +30.1%
- By 2100
- 336,773 · +40.6%
Race, ethnicity, and origin ACS 2023
- Neighborhood character
- Predominantly White (74%)
- Race & ethnicity
- White 74% Black 10% Two or more races 10% Hispanic / Latino 7%
- Hispanic origin (detail)
- Mexican 5%
- Common ancestry
- Portuguese 3% Lithuanian 2% Romanian 2%
- Foreign-born
- 8% · Canada
- Languages at home
- 90% English-only · Spanish 3% French/Haitian/Cajun 2% Other Asian/Pacific 1%
Political lean MEDSL · Linn
- 2024 margin
- Lean D (+9.9) · D 54.2% · R 44.3% · Other 1.4%
- 2008→2024 swing
- -11.6pp toward R · 2008: 21.5pp · 2024: 9.9pp
- All cycles
- 2024: D+9.9 2020: D+13.7 2016: D+9.0 2012: D+17.6 2008: D+21.5
Not yet ingested
- Civics
- —
Market trends
- HPI YoY
- ▼ -154.96%
- Current HPI
- 241.81
- Rent YoY
- ▲ 8.79%
- Metro
- Cedar Rapids, IA
- State GDP YoY
- ▲ 2.48%
- F500 in state
- 4
Industry mix (Fortune 500 HQ in IA)
| Industry | F500 HQs | Revenue |
|---|---|---|
| Financial Services | 1 | $16B |
|
||
| Retail / Convenience | 1 | $15B |
|
||
Price history
+94.6% since first listed12 events — show timeline
- 2026-05-15 Relisted — CRAAR, CDRMLS
- 2026-04-28 Pending — CRAAR, CDRMLS
- 2026-04-10 Listed $184,900 CRAAR, CDRMLS
- 2023-12-20 Sold (Public Records) $158,000 Public Records
- 2023-12-18 Delisted — CRAAR, CDRMLS
- 2023-12-18 Sold (MLS) $158,000 CRAAR, CDRMLS
- 2023-11-17 Pending — CRAAR, CDRMLS
- 2023-11-08 Listed $158,000 CRAAR, CDRMLS
- 2016-09-27 Sold (Public Records) $1,575,952 Public Records
- 2015-01-22 Sold (Public Records) $2,051,000 Public Records
- 2008-09-25 Sold (Public Records) $112,500 Public Records
- 2007-08-02 Sold (Public Records) $95,000 Public Records
Property tax history
+4.4%/yrLatest (2025): $2,538 · +7.4% YoY. Source: county tax records.
Cash-flow waterfall
monthlySold comps — $/sqft
last 12 mo · ≤1 miLoading sold comps…