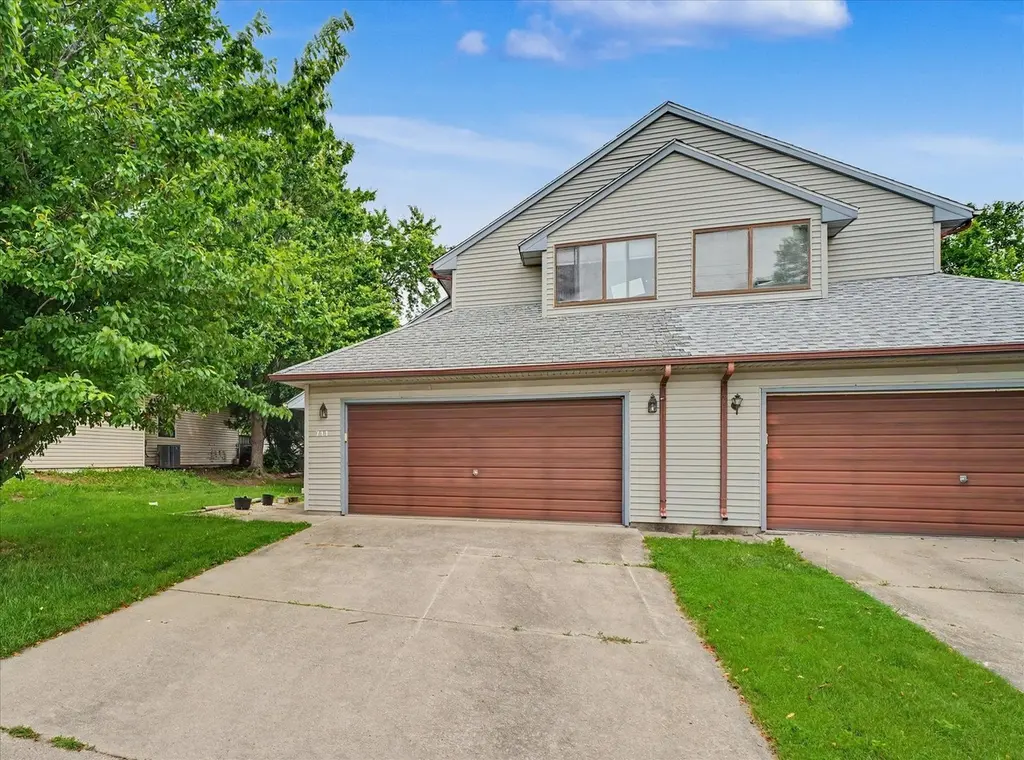
711 Higgins Rd · Champaign, IL
Flood risk 1/10 · Minimal
- FEMA flood zone
- X (unshaded)
- Chance of flooding over 30 yrs
- 0.0%
- Est. flood insurance / yr
- $507 – $1,088
Fire risk 1/10 · Minimal
- Est. fire insurance / yr
- $804 – $1,492
Heat risk 3/10 · Minor
- Hot days now (above 104°F)
- 7 days/yr
- Hot days in 30 yrs
- 19 days/yr
Wind risk 2/10 · Minimal
- Chance of severe wind over 30 yrs
- 1.0%
Air-quality risk 2/10 · Minimal
- Unhealthy air days now
- 0 days/yr
- Unhealthy air days in 30 yrs
- 1 days/yr
Risk factors via First Street. Map © Google.
Why this score? — see what drove the B+ grade
The composite is a weighted blend of 9 inputs, each scored 0–100. Each bar is that input's sub-score; the figure is the points it added to the 100-point composite (weight × sub-score).
- Cash flow +30.0/30.0
- ARV discount +15.0/15.0
- 1% rule +10.0/10.0
- DSCR +10.0/10.0
- Livability +4.2/5.0
- Rent growth +2.5/5.0
- Condition / age +2.5/5.0
- Schools +2.2/10.0
- Appreciation +0.0/10.0
$110,000
🖨 Deal sheet (PDF) 📄 Offer letter ✓ Due diligence
Listing remarks
Spacious zero-lot home with great potential in a desirable Champaign location just blocks from Parkland College. Nestled on a short street in a quiet neighborhood, this property offers a wonderful opportunity for buyers ready to add their own style and updates. The main level features a spacious kitchen and a living room with a high vaulted ceiling that brings in an open, airy feel. Upstairs, two generously sized bedrooms provide comfortable space and flexibility. A great value for owner-occupants, first-time buyers, or anyone looking for a home with strong potential in a convenient location.
Key facts
- Short street
- Spacious kitchen
- Champaign location
Tags
Property features AI
Finance
- Other: Not currently leased; Not rebuilt or rehabbed; Parcel number on file
- HOA & community: No master association fee required; Pets allowed (cats and dogs permitted; max pet weight not practically limited)
Exterior
- Parking: Attached garage with 2 garage spaces; Concrete driveway; Garage door opener; Owned garage
- Utilities: Public water; Public sewer
- Home design: Attached single (1/2 duplex); Entry level 1; Fee simple ownership; Approximately 31-40 years old
- Construction: Vinyl siding; Asphalt roof; Approximately 1,408 total finished square feet; Upper level approx. 660; Main level approx. 748
- Exterior features: Zero lot line; School bus service and commuter bus access; Lot dimensions approximately 42.51 x 128.46
Interior
- Kitchen: Kitchen with pantry closet (approx. 12 x 17) and vinyl flooring; Double oven; Dishwasher; Refrigerator
- Bedrooms: Master bedroom on second level (approx. 15 x 17) with carpet; Second bedroom on second level (approx. 12 x 15) with carpet; Two additional bedrooms (sizes not provided)
- Flooring: Carpet in living room, dining room, bedrooms; Vinyl in kitchen
- Bathrooms: One full bathroom; One half bathroom
- Heating & cooling: Natural gas forced air heating; Central air conditioning
- Interior features: Five total rooms; Crawl space basement; Living room with fireplace
- Laundry & utility: Dedicated laundry room
Neighborhood map
What this means for you Summary
Snapshot
- This is a 2-bed/1.5-bath townhouse listed at $110k.
Deal economics
- At list price, monthly cash flow is $663 ($8k/yr) — positive.
- The deal already cash-flows at list — no discount required.
- Meets the 1% rule at list price ($2k rent vs $110k).
- Cap rate 13.5% vs local median 3.8% in Champaign — top-decile yield for the area; either an underpriced asset or a hidden risk that comps aren't pricing in. Stress-test before assuming the spread holds.
Location & tenants
- Location reads 83/100 on livability (#44 in IL, #902 nationally) — a professional / high-income tenant draw. Strengths: commute A+, cost of living A+, housing A+; Watch: crime F.
- Champaign CUSD 4 (urban): math 24% / reading 26% proficiency, ranked #333 of 620 in IL (top 54%) — low school quality limits family demand, transient renter base, plan for 1-2y turnover.
- Zoned schools: International Prep Academy (math 12% / reading 8%, grade F, #1,517 of 2,056 statewide, top 78%, 568 students, 0% FRL); Jefferson Middle School (math 9% / reading 18%, grade F, #535 of 665 statewide, top 81%, 738 students, 0% FRL); Centennial High School (math 26% / reading 27%, grade F, #241 of 693 statewide, top 35%, 1,444 students, 0% FRL) — zoned schools average 0% FRL vs 52% district-wide (52 pts lower); this property's tenant base skews higher-income than the district average.
- Market conditions: 130 active listings in the ZIP; 20 comparable units currently listed for rent nearby; rentals at typical pace (median 16d on market — plan ~3-4 weeks tenant-placement turnaround); solid renter incomes; 573 units permitted in Champaign County in 2024 (359 in 5+ unit buildings).
Forward outlook
- Local home prices are declining (-3.0%/yr); year-one equity from $761 of loan paydown is wiped out by about $3k of value loss. Plan a longer hold.
- Champaign County population projected at +15% by 2050 — modest demand growth; plan on rents tracking national, not racing it.
- At projected returns (-3.0% appreciation + 3.0% rent growth), your $31k cash investment doubles in ~5 years — after that, you're playing with house money.
Negotiation context
- Only 2 days on market — expect competitive offers; lowballing is unlikely to land.
- Current owner paid $43k; list at $110k implies a 156% gain — meaningful room to come down on a strong offer.
Questions for the listing agent
- Is there a deadline driving the sale (1031 exchange, divorce, estate, relocation)? That informs how much negotiation room exists.
- Crime grade is F in this area — have there been break-ins, vandalism, or insurance claims at this property in the last 3 years? What carrier currently insures it and at what premium?
- What's the average days-on-market for RENTAL listings here right now (not sales)? A rising rental-DOM trend means longer vacancies and softer asking-rent achievability than the comps imply.
- What's the recent tenant-quality profile in this submarket — average credit score on applications, eviction rate, late-payment / NSF rate, and stable-employment percentage? A property-management company in the area should have these aggregated.
- How much new for-sale + rental construction is in the pipeline within 1–3 miles? Heavy new supply typically softens prices + rents 12–24 months out; constrained supply supports both.
Investment metrics
- 1% rule
- 1.58% ✓
- Cap rate
- 13.52%
- Cash-on-cash
- 25.82%
- DSCR
- 2.15
- GRM
- 5.3
CMA / ARV
- ARV (on-the-fly)
- $187,264
- Comps found
- 12
Show comp detail 12 sales within ~0.75 mi
| Address | Dist | Beds/Ba | Sqft | Sold | Price | $/sf | Match |
|---|---|---|---|---|---|---|---|
| 515 Clearwater Dr #515 | 0.17mi | 3/2.5 (+1) | 1,493 (+6%) | 3mo | $210,000 | $141 | 71 |
| 2614 Natalie Dr #0 | 0.31mi | 2/1.5 | 1,332 (-5%) | 10mo | $170,000 | $128 | 68 |
| 413 Irvine Rd #413 | 0.38mi | 3/2.0 (+1) | 1,359 (-4%) | 2mo | $173,000 | $127 | 68 |
| 2406 Heritage Dr #0 | 0.12mi | 3/2.0 (+1) | 1,312 (-7%) | 12mo | $167,500 | $128 | 66 |
| 2579 Clayton Blvd #2579 | 0.17mi | 3/1.5 (+1) | 1,277 (-9%) | 9mo | $124,000 | $97 | 64 |
| 2913 N Natalie Dr | 0.38mi | 3/2.0 (+1) | 1,426 (+1%) | 12mo | $215,000 | $151 | 63 |
| 2705 Heritage Dr #2705 | 0.10mi | 2/1.5 | 1,208 (-14%) | 11mo | $105,000 | $87 | 62 |
| 501 Creve Coeur Dr | 0.46mi | 3/2.0 (+1) | 1,446 (+3%) | 6mo | $195,000 | $135 | 62 |
| 2537 Clayton Blvd #0 | 0.17mi | 3/1.5 (+1) | 1,204 (-14%) | 7mo | $160,000 | $133 | 57 |
| 2801 Heritage Dr | 0.16mi | 3/2.0 (+1) | 1,230 (-13%) | 9mo | $180,000 | $146 | 57 |
| 409 Irvine Rd #409 | 0.38mi | 3/2.5 (+1) | 1,537 (+9%) | 4mo | $180,000 | $117 | 55 |
| 2553 Clayton Blvd #2553 | 0.18mi | 3/2.0 (+1) | 1,227 (-13%) | 11mo | $179,000 | $146 | 54 |
Match score weights: distance 35% · size 25% · config 20% · recency 20%. Top-matched comps best support the ARV.
Projected returns pro-forma
-3.0% appreciation · 3.0% rent growth · sell at horizon
- IRR
- 19.5%
- Equity multiple
- 1.79×
- Total profit
- $24,372
- Equity at exit
- $16,401
- IRR
- 27.8%
- Equity multiple
- 3.45×
- Total profit
- $75,540
- Equity at exit
- $9,511
Cash invested: $30,800 (down + closing). Projections, not guarantees.
Landlord ↔ Tenant lean methodology
- Overall (STATE)
- 43 Moderately Tenant-Leaning
- State Illinois
- 43 Moderately Tenant-Leaning · D+7
- County
- — inherits STATE
- City
- — inherits STATE
ZIP-level market 61822
- Home prices YoY
- -15.6%
- Active inventory
- 130
- Price-to-rent
- 5.3×
Monthly cashflow live
- Estimated rent
- $1,734 high interval (Pro) →
- Mortgage (P&I)
- −$577
- Tax from tax record
- −$85 /mo · $1,018/yr
- Insurance
- −$46
- HOA
- −$0
- Vacancy / Maint / Mgmt
- −$364
- Net cashflow
- $663
Break-even live
Sensitivity live
| Price | -10% $725 | -5% $694 | +0% $663 | +5% $631 | +10% $600 |
|---|---|---|---|---|---|
| Rent | -10% $526 | -5% $594 | +0% $663 | +5% $731 | +10% $800 |
| Rate | -1.0pp $718 | -0.5pp $691 | base $663 | +0.5pp $634 | +1.0pp $605 |
UW: 25.0% down · 7.5% · 30yr · 1.5% tax · 5.0% vac · 8.0% maint · 8.0% mgmt
Financing live
Cash to close
- Down payment
- $27,500
- Closing costs
- $3,300
- Reserves months
- —
- Total cash needed
- —
Loan-product check · same deal, 3 products live
Conventional
25% down · 7.5% · 30yr
- Down + closing
- —
- Monthly P&I
- —
- Monthly cashflow
- —
- DSCR
- —
- Eligible?
- —
Personal DTI + credit; lowest rate.
DSCR
20% down · 8.5% · 30yr
- Down + closing
- —
- Monthly P&I
- —
- Monthly cashflow
- —
- DSCR
- —
- Eligible?
- —
No personal income docs; deal must DSCR.
Hard money
10% down · 12.0% · 12mo
- Down + closing
- —
- Monthly P&I
- —
- Monthly cashflow
- —
- DSCR
- —
- Eligible?
- —
Short-term bridge; refi at stabilization.
Rent comps 20 comps
| Address | Beds | Baths | Sqft | Rent | $/sqft | DOM | Units | Dist |
|---|---|---|---|---|---|---|---|---|
| 515 Clearwater Dr Champaign, IL | 3.0 | 2.5 | 1536 | $2,150 | $1.40 | 15d | 1 | 0.19mi |
| 1113 Laura Dr Champaign, IL | 2.0 | 1.0 | 900 | $1,295 | $1.44 | 23d | 1 | 0.34mi |
| 2002 W Bradley Ave Champaign, IL | 1.0–2.0 | 1.0–2.0 | 690 | $1,495 | $2.17 | 15d | 3 | 0.50mi |
| 3315 Boulder Ridge Dr Champaign, IL | 3.0 | 2.5 | 1500 | $2,200 | $1.47 | 15d | 1 | 0.86mi |
| 2503 W Springfield Ave Champaign, IL | 1.0–2.0 | 1.0–1.5 | 923 | $1,360 | $1.47 | 15d | 44 | 0.87mi |
| 1504 Stonebluff Ct Unit 1504 Champaign, IL | 3.0 | 2.0 | 1583 | $2,500 | $1.58 | 45d | 1 | 0.91mi |
| 1507 Stonebluff Ct Unit 1507 Champaign, IL | 3.0 | 2.5 | 1400 | $2,100 | $1.50 | 15d | 1 | 0.92mi |
| 410 Ginger Bend Dr Champaign, IL | 1.0–2.0 | 1.0–2.0 | 913 | $1,580 | $1.73 | 15d | 18 | 0.92mi |
| 1509 Stonebluff Ct Unit 1509 Champaign, IL | 3.0 | 2.5 | 1400 | $2,100 | $1.50 | 15d | 1 | 0.93mi |
| 2000 N Mattis Ave Champaign, IL | 1.0–3.0 | 1.0 | 900 | $900 | $1.00 | 15d | 1 | 1.08mi |
| 604 English Creek Ct Unit 1 Champaign, IL | 2.0 | 1.5 | 1000 | $1,235 | $1.24 | 15d | 1 | 1.10mi |
| 618 Dogwood Dr Champaign, IL | 3.0 | 1.0 | 1073 | $2,200 | $2.05 | 15d | 1 | 1.14mi |
| 1909 Joanne Ln Unit A Champaign, IL | 3.0 | 1.0 | 1000 | $1,350 | $1.35 | 15d | 1 | 1.17mi |
| 1801 W John St Unit 1821 Champaign, IL | 3.0 | 1.5 | 1200 | $1,390 | $1.16 | 15d | 1 | 1.28mi |
| 1801 W John St Unit 723 Champaign, IL | 3.0 | 1.5 | 1200 | $1,390 | $1.16 | 23d | 1 | 1.28mi |
| 910 S Duncan Rd Champaign, IL | 3.0 | 1.0 | 1050 | $1,400 | $1.33 | 45d | 1 | 1.33mi |
| 2106 Campbell Dr Champaign, IL | 3.0 | 1.0 | 1040 | $1,475 | $1.42 | 15d | 1 | 1.40mi |
| 1805 Jeanne St Champaign, IL | 2.0 | 1.0 | 945 | $1,175 | $1.24 | 15d | 1 | 1.44mi |
| 1807 Jeanne St Champaign, IL | 2.0 | 1.0 | 945 | $1,175 | $1.24 | 15d | 1 | 1.45mi |
| 1418 Dobbins Dr Champaign, IL | 3.0 | 1.0 | 1100 | $1,780 | $1.62 | 15d | 1 | 1.47mi |
Listing history 4 events
-
2026-05-30status $110,000 Pending 2 DOM
-
2026-05-27$110,000 Active
-
1990-04-02soldstatus $43,000
-
1990-04-02soldstatus $43,000
ⓘ Source: listings_history table (triggers on properties + properties_extension) + one-shot
backfill from property_details.listing_events for pre-trigger history.
Tax reassessment forecast IL · Partial reset (capped growth)
- Current annual tax
- $1,018 · $85/mo
- Projected year-2 tax
- $1,757 · $146/mo
- Expected delta
- +$740/yr (+$62/mo · 72.7%)
ⓘ Screening estimate from a state-policy table — verify with the county assessor before closing.
Climate risk First Street
- Flood 1/10 Low FEMA zone X (unshaded) · 0% chance over 30 yrs
- Wildfire 1/10 Low
- Heat 3/10 Moderate 7 d/yr ≥104°F today · 19 d/yr by 30 yrs out
- Wind 2/10 Low 100% chance of damaging wind over 30 yrs
- Air quality 2/10 Low 0 unhealthy d/yr today · 1 by 30 yrs out
Nearby sold comps map
Loading sold comps map…
Walkable amenities ~0.75 mi
Loading nearby amenities…
Taxation est. · year 1
- Rental income
- $20,812
- − Mortgage interest
- −$6,162
- − Property taxes
- −$1,018
- − Insurance
- −$550
- − Repairs & maintenance
- −$1,665
- − Management
- −$1,665
- − Depreciation
- −$3,200
- Taxable income
- $6,553
- Est. tax owed @ 24.0%
- −$1,573
- After-tax cash flow
- $6,379/yr
For passive investors: Depreciation is non-cash, so a rental often shows a tax loss while cash-flowing — sheltering income. Rental losses are passive: they offset passive income freely, and up to $25,000/yr can offset ordinary (W-2) income if you actively participate and your MAGI is under $100k (phasing out to $0 by $150k); unused losses carry forward. On sale, claimed depreciation is recaptured at up to 25%, and gains may owe capital-gains tax (a 1031 exchange can defer both). Figures are a year-1 estimate at your 24.0% rate — not tax advice; consult a CPA.
Schools (NCES district)
- District
- Champaign CUSD 4
- NCES district ID
- 1709420
- Math proficiency
- 24% ▼ -7.00%
- Reading proficiency
- 26% ▼ -7.00%
- Median HH income
- $45,797
- Composite
- 21.66/100
- National rank
- #8281
- State rank
- #333 of 620 in IL
Livability — Champaign
- Score
- 83/100
- State rank
- #44
- US rank
- #902
Category grades
Schools grade is shown separately in the Schools card above.
Census & demographics
- Census place
- Champaign, IL
- County
- Champaign County · 182,148 people
- City population
- 96,852
- Metro
- Champaign-Urbana, IL
- Population (ZIP)
- 27,642
- Household income
- $99,006
- Rent vs Own
- Severe rent burden
- 733.0
Population outlook (Champaign County) Hauer SSP2
- Today (2025)
- 223,848 people
- By 2030
- 231,416 · +3.4%
- By 2040
- 244,321 · +9.1%
- By 2050
- 256,432 · +14.6%
- By 2075
- 285,823 · +27.7%
- By 2100
- 296,406 · +32.4%
Race, ethnicity, and origin ACS 2023
- Neighborhood character
- Diverse neighborhood (Simpson 0.62)
- Race & ethnicity
- White 57% Asian 17% Black 14% Two or more races 7% Hispanic / Latino 6%
- Hispanic origin (detail)
- Mexican 2%
- Common ancestry
- Romanian 3% Lithuanian 2% Italian 2%
- Foreign-born
- 18% · China, Canada, South Korea
- Languages at home
- 76% English-only · Chinese 6% Spanish 4% Other Asian/Pacific 3%
Political lean MEDSL · Champaign
- 2024 margin
- Strong D (+24.1) · D 61.3% · R 37.2% · Other 1.5%
- 2008→2024 swing
- +6.6pp toward D · 2008: 17.5pp · 2024: 24.1pp
- All cycles
- 2024: D+24.1 2020: D+22.8 2016: D+18.4 2012: D+6.8 2008: D+17.5
Not yet ingested
- Civics
- —
Market trends
- HPI YoY
- ▼ -37.60%
- Current HPI
- 203.8781
- Rent YoY
- —
- Metro
- Champaign-Urbana, IL
- State GDP YoY
- ▲ 1.59%
- F500 in state
- 60
Industry mix (Fortune 500 HQ in IL)
| Industry | F500 HQs | Revenue |
|---|---|---|
| Insurance | 4 | $201B |
|
||
| Consumer Goods | 4 | $87B |
|
||
| Industrial Machinery | 3 | $64B |
|
||
| Healthcare | 2 | $55B |
|
||
| Retail / Pharmacy | 1 | $148B |
|
||
| Agriculture / Food | 1 | $86B |
|
||
Price history
+155.8% since first listed3 events — show timeline
- 2026-05-27 Listed $110,000 MRED as Distributed by MLS Grid
- 1990-04-02 Sold (Public Records) $43,000 Public Records
- 1990-04-02 Sold (Public Records) $43,000 Public Records
Property tax history
+0.4%/yrLatest (2024): $1,018 · -3.3% YoY. Source: county tax records.
Cash-flow waterfall
monthlySold comps — $/sqft
last 12 mo · ≤1 miLoading sold comps…