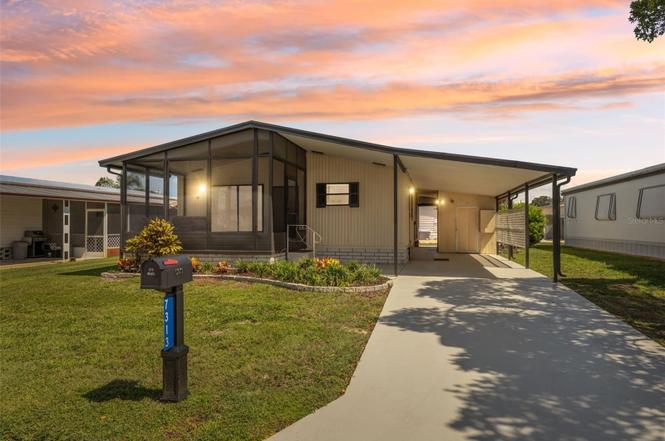
7313 Stillwater Dr · Bayonet Point, FL
Flood risk 7/10 · Major
- FEMA flood zone
- X (shaded)
- Chance of flooding over 30 yrs
- 0.76%
- Est. flood insurance / yr
- $507 – $1,088
Fire risk 6/10 · Moderate
- Est. fire insurance / yr
- $947 – $1,759
Heat risk 10/10 · Severe
- Hot days now (above 114°F)
- 7 days/yr
- Hot days in 30 yrs
- 23 days/yr
Wind risk 10/10 · Severe
- Chance of severe wind over 30 yrs
- 99.0%
Air-quality risk 2/10 · Minimal
- Unhealthy air days now
- 1 days/yr
- Unhealthy air days in 30 yrs
- 3 days/yr
Risk factors via First Street. Map © Google.
Why this score? — see what drove the B- grade
The composite is a weighted blend of 9 inputs, each scored 0–100. Each bar is that input's sub-score; the figure is the points it added to the 100-point composite (weight × sub-score).
- Cash flow +29.8/30.0
- DSCR +10.0/10.0
- ARV discount +9.3/15.0
- 1% rule +7.5/10.0
- Schools +4.3/10.0
- Livability +3.5/5.0
- Condition / age +2.5/5.0
- Rent growth +1.9/5.0
- Appreciation +0.0/10.0
$134,900
🖨 Deal sheet 📄 Offer letter ✓ Due diligence
Listing remarks
Reduced for quick sale!! Inspections passed! Nicely updated doublewide! A TRUE TURNKEY!!This home is located in popular 55+ Ponderosa Park. NO lot rent LOW HOA fees of $250.00 annually. Fully insurable and fully financeable! Everything has been done for you. .. all new flooring (luxury vinyl), carpet, blinds, interior painting, electrical outlets/plugs, fixtures, NEW WHIRLPOOL stainless steel appliances and more. Roof 2021! AC 2016! Electric hot water tank 2022! INSIDE utility, no stairs to climb on laundry day. Vaulted ceilings throughout! Both bedrooms are good sized with the primary bedroom having a walk-in closet and ensuite. The front vinyl/screened porch allows for additional outdoor
Key facts
- Ensuite
- Walk-in closet
- New flooring
Tags
Property features AI
Finance
- Other: Condo land included; Total acreage: less than 1/4 acre (approx. 0.1 acre); Lot is landscaped, in county with paved road access
- Financial info: Lease restrictions apply
- HOA & community: Has HOA (annual fee $250; monthly equivalent $20.83) — association approval required; Association fee covers management and other services; Community features include clubhouse, deed restrictions, street lights; Senior community; Pets allowed (cats and dogs; number and size limits apply)
Exterior
- Parking: Carport (1 space)
- Utilities: Public sewer; Water connected; Water source: none; Electricity connected; Cable connected; Underground utilities
- Home design: Manufactured home (double wide); Single-story; Faces south; Residential property
- Construction: Metal siding; Shingle roof; Built on other foundation
- Exterior features: Covered front porch; Porch; Sliding doors; Storage; Shed(s)
Interior
- Kitchen: Range; Microwave; Refrigerator; Electric water heater
- Bedrooms: 2 bedrooms
- Flooring: Carpet
- Bathrooms: 2 full bathrooms
- Heating & cooling: Central heating (electric); Central air conditioning
- Interior features: High ceilings; Vaulted ceilings; Open floor plan; Walk-in closet(s); Inside utility/additional room
- Laundry & utility: Washer; Dryer; Electric dryer hookup; Gas dryer hookup; Laundry inside
Neighborhood map
What this means for you Summary
Snapshot
- This is a 2-bed/2.0-bath manufactured listed at $135k.
Deal economics
- At list price, monthly cash flow is $429 ($5k/yr) — positive.
- The deal already cash-flows at list — no discount required.
- Meets the 1% rule at list price ($2k rent vs $135k).
- Recommended offer: $119k (12.0% below list) — sets the bar for market timing.
- Cap rate 10.7% vs local median 5.3% in Bayonet Point — top-decile yield for the area; either an underpriced asset or a hidden risk that comps aren't pricing in. Stress-test before assuming the spread holds.
Location & tenants
- Location reads 69/100 on livability (#485 in FL) — a middle-class / working-renter tenant base. Strengths: cost of living A+, housing A+, health & safety A+; Watch: crime D+, amenities D+, schools F.
- Pasco (suburban): math 50% / reading 52% proficiency, ranked #32 of 73 in FL (top 44%) — acceptable for families but not a draw, mixed tenant base, ~2y average lease.
- Market conditions: Rents soft (-2.3%/yr); 790 active listings in the ZIP; 40 comparable units currently listed for rent nearby; rentals at typical pace (median 24d on market — plan ~3-4 weeks tenant-placement turnaround); 6,765 units permitted in Pasco County in 2024 (1,250 in 5+ unit buildings).
- This rent runs 40% of the median local income ($51k/yr) — at the standard rent-burdened threshold; future hikes will face affordability resistance.
Forward outlook
- Local home prices are declining (-3.0%/yr); year-one equity from $933 of loan paydown is wiped out by about $4k of value loss. Plan a longer hold.
- Pasco County population projected at +29% by 2050 — long-run rental-demand tailwind backs the buy-and-hold thesis.
Negotiation context
- It's been on market 252 days — a 12% lower offer ($119k) is reasonable based on typical stale-listing flexibility.
- 3 sale attempts since 5y ago; this cycle's ask has dropped $54k (29%) from the opening price — seller is motivated, your offer sets the floor, not the list.
- Current owner paid $63k; list at $135k implies a 114% gain — meaningful room to come down on a strong offer.
Risks & watch-outs
- Watch-outs: flood insurance adds $66/mo.
- Climate carrying-cost: major flood risk; severe wind risk, 99% chance of damaging wind over 30y; major wildfire risk; extreme-heat days projected 7→23/yr by 2055 (HVAC capex compounding) — expect insurance premiums to compound above CPI over the hold.
Questions for the listing agent
- It's been on market 252 days. Have you received any prior offers? Is the seller open to a 12% concession, seller financing, or rate buy-down credit?
- What's the actual annual flood-insurance premium (NFIP or private), and is the property in a SFHA with mandatory coverage?
- What does the HOA fee cover, when was the last increase, and are there any pending special assessments or reserve-fund shortfalls?
- Why hasn't it sold? Are there any deal-killer items the seller is aware of (foundation, flood, title, zoning, code violations)?
- Is there a deadline driving the sale (1031 exchange, divorce, estate, relocation)? That informs how much negotiation room exists.
- Schools are F-rated, which usually means shorter tenancies and higher turnover. Who's the typical renter profile here, and what's been the actual vacancy rate?
- Crime grade is D in this area — have there been break-ins, vandalism, or insurance claims at this property in the last 3 years? What carrier currently insures it and at what premium?
- What's the average days-on-market for RENTAL listings here right now (not sales)? A rising rental-DOM trend means longer vacancies and softer asking-rent achievability than the comps imply.
- What's the recent tenant-quality profile in this submarket — average credit score on applications, eviction rate, late-payment / NSF rate, and stable-employment percentage? A property-management company in the area should have these aggregated.
- How much new for-sale + rental construction is in the pipeline within 1–3 miles? Heavy new supply typically softens prices + rents 12–24 months out; constrained supply supports both.
Investment metrics
- 1% rule
- 1.25% ✓
- Cap rate
- 10.70%
- Cash-on-cash
- 15.73%
- DSCR
- 1.70
- GRM
- 6.6
CMA / ARV
- ARV (on-the-fly)
- $140,400
- Comps found
- 12
Show comp detail 12 sales within ~0.75 mi
| Address | Dist | Beds/Ba | Sqft | Sold | Price | $/sf | Match |
|---|---|---|---|---|---|---|---|
| 12119 Bonanza Dr | 0.19mi | 2/2.0 | 1,056 (+2%) | 1mo | $120,000 | $114 | 88 |
| 12201 Bonanza Dr | 0.16mi | 2/2.0 | 1,056 (+2%) | 11mo | $142,500 | $135 | 81 |
| 12210 Bonanza Dr | 0.14mi | 2/2.0 | 1,056 (+2%) | 12mo | $178,500 | $169 | 81 |
| 7310 Stillwater Dr | 0.03mi | 2/2.0 | 1,144 (+10%) | 5mo | $90,000 | $79 | 78 |
| 12343 Lariat Way | 0.04mi | 3/2.0 (+1) | 1,068 (+3%) | 13mo | $165,000 | $154 | 77 |
| 7309 Blue Lake Dr | 0.15mi | 2/2.0 | 960 (-8%) | 4mo | $115,000 | $120 | 77 |
| 12110 Bonanza Dr | 0.23mi | 2/2.0 | 962 (-8%) | 2mo | $90,000 | $94 | 75 |
| 7412 Grand Pine Dr | 0.13mi | 2/2.0 | 960 (-8%) | 12mo | $145,000 | $151 | 72 |
| 7303 Blue Lake Dr | 0.16mi | 2/2.0 | 960 (-8%) | 13mo | $165,000 | $172 | 69 |
| 7304 Osage Dr | 0.04mi | 2/2.0 | 896 (-14%) | 13mo | $94,000 | $105 | 64 |
| 7308 Osage Dr | 0.03mi | 2/2.0 | 1,188 (+14%) | 13mo | $175,000 | $147 | 64 |
| 7318 Allyson St | 0.59mi | 2/2.0 | 1,080 (+4%) | 11mo | $145,000 | $134 | 57 |
Match score weights: distance 35% · size 25% · config 20% · recency 20%. Top-matched comps best support the ARV.
Projected returns pro-forma
-3.0% appreciation · 0.0% rent growth · sell at horizon
- IRR
- 0.4%
- Equity multiple
- 1.01×
- Total profit
- $494
- Equity at exit
- $20,114
- IRR
- 6.7%
- Equity multiple
- 1.44×
- Total profit
- $16,466
- Equity at exit
- $11,664
Cash invested: $37,772 (down + closing). Projections, not guarantees.
Landlord ↔ Tenant lean methodology
- Overall (STATE)
- 87 Strongly Landlord-Friendly
- State Florida
- 87 Strongly Landlord-Friendly · R+3
- County
- — inherits STATE
- City
- — inherits STATE
ZIP-level market 34667
- Rents YoY
- -2.3%
- Active inventory
- 790
- Price-to-rent
- 6.6×
Monthly cashflow live
- Estimated rent
- $1,692 high interval (Pro) →
- Mortgage (P&I)
- −$707
- Tax from tax record
- −$58 /mo · $695/yr
- Insurance
- −$56
- Flood insurance flood zone
- −$66 /mo · $798/yr
- HOA
- −$20
- Vacancy / Maint / Mgmt
- −$355
- Net cashflow
- $429
Break-even live
UW: 25.0% down · 7.5% · 30yr · 1.5% tax · 5.0% vac · 8.0% maint · 8.0% mgmt
Financing live
Cash to close
- Down payment
- $33,725
- Closing costs
- $4,047
- Reserves months
- —
- Total cash needed
- —
Loan-product check · same deal, 3 products live
Conventional
25% down · 7.5% · 30yr
- Down + closing
- —
- Monthly P&I
- —
- Monthly cashflow
- —
- DSCR
- —
- Eligible?
- —
Personal DTI + credit; lowest rate.
DSCR
20% down · 8.5% · 30yr
- Down + closing
- —
- Monthly P&I
- —
- Monthly cashflow
- —
- DSCR
- —
- Eligible?
- —
No personal income docs; deal must DSCR.
Hard money
10% down · 12.0% · 12mo
- Down + closing
- —
- Monthly P&I
- —
- Monthly cashflow
- —
- DSCR
- —
- Eligible?
- —
Short-term bridge; refi at stabilization.
Rent comps 40 comps
| Address | Beds | Baths | Sqft | Rent | $/sqft | DOM | Units | Dist |
|---|---|---|---|---|---|---|---|---|
| 7433 Greystone Dr #7433 Hudson, FL | 2.0 | 2.0 | 1029 | $1,300 | $1.26 | 17d | 1 | 0.25mi |
| 7616 Danube Dr Hudson, FL | 2.0 | 2.0 | 1125 | $1,350 | $1.20 | 24d | 1 | 0.30mi |
| 12702 Social Dr Hudson, FL | 2.0 | 1.0 | 1032 | $1,500 | $1.45 | 4d | 1 | 0.33mi |
| 7602 Danube Dr Unit 7602 Hudson, FL | 2.0 | 2.0 | 1125 | $1,600 | $1.42 | 24d | 1 | 0.33mi |
| 12041 Hoosier Ct #204 Hudson, FL | 2.0 | 2.0 | 1103 | $1,495 | $1.36 | 17d | 1 | 0.46mi |
| 12041 Hoosier Ct #204 Hudson, FL | 2.0 | 2.0 | 1103 | $1,495 | $1.36 | 24d | 1 | 0.46mi |
| 12027 Hoosier Ct #203 Hudson, FL | 2.0 | 2.0 | 1103 | $1,550 | $1.41 | 24d | 1 | 0.47mi |
| 12809 College Hill Dr Hudson, FL | 3.0 | 2.0 | 1114 | $1,780 | $1.60 | 4d | 1 | 0.48mi |
| 7300 Country Club Dr Hudson, FL | 2.0 | 1.0 | 926 | $1,400 | $1.51 | 2d | 1 | 0.50mi |
| 7539 Gulf Highlands Dr Port Richey, FL | 2.0 | 1.5 | 936 | $1,550 | $1.66 | 4d | 1 | 0.78mi |
| 12535 3rd Isle Hudson, FL | 2.0 | 2.0 | 1389 | $2,600 | $1.87 | 24d | 1 | 0.81mi |
| 7924 Halsey Dr Port Richey, FL | 3.0 | 2.0 | 1272 | $1,800 | $1.42 | 21d | 1 | 0.84mi |
| 7924 Halsey Dr Port Richey, FL | 3.0 | 2.0 | 1272 | $1,800 | $1.42 | 4d | 1 | 0.84mi |
| 7608 Sue Ellen Dr Port Richey, FL | 3.0 | 2.0 | 1310 | $2,400 | $1.83 | 24d | 1 | 0.88mi |
| 7715 Sue Ellen Dr Port Richey, FL | 2.0 | 2.0 | 1080 | $1,495 | $1.38 | 3d | 1 | 0.89mi |
| 12200 Hudson Ridge Dr Port Richey, FL | 2.0–3.0 | 2.0 | 1107 | $1,468 | $1.33 | 2d | 10 | 0.90mi |
| 11610 Meadow Dr Port Richey, FL | 2.0 | 2.0 | 1128 | $1,570 | $1.39 | 12d | 1 | 0.93mi |
| 11611 Constance Dr Port Richey, FL | 3.0 | 1.0 | 984 | $1,540 | $1.57 | 11d | 1 | 0.94mi |
| 11611 Constance Dr Port Richey, FL | 3.0 | 1.0 | 984 | $1,540 | $1.57 | 24d | 1 | 0.94mi |
| 11630 Paige Dr Port Richey, FL | 3.0 | 1.0 | 1152 | $1,680 | $1.46 | 12d | 1 | 0.94mi |
| 7530 Judith Cres Port Richey, FL | 2.0 | 2.0 | 1446 | $2,200 | $1.52 | 24d | 1 | 0.95mi |
| 7530 Judith Cres Port Richey, FL | 2.0 | 2.0 | 1446 | $1,695 | $1.17 | 20d | 1 | 0.95mi |
| 8304 Mill Creek Ln Hudson, FL | 2.0 | 2.0 | 1000 | $1,650 | $1.65 | 24d | 1 | 0.95mi |
| 7804 Topay Ln Port Richey, FL | 3.0 | 2.0 | 1125 | $1,811 | $1.61 | 4d | 1 | 0.98mi |
| 8312 Mill Creek Ln Hudson, FL | 2.0 | 2.0 | 1152 | $1,600 | $1.39 | 24d | 1 | 1.00mi |
| 7520 Hawthorn Dr Unit NA Port Richey, FL | 2.0 | 2.0 | 1303 | $1,900 | $1.46 | 24d | 1 | 1.03mi |
| 7520 Hawthorn Dr Port Richey, FL | 2.0 | 2.0 | 1303 | $1,800 | $1.38 | 23d | 1 | 1.03mi |
| 7531 Greybirch Ter Port Richey, FL | 3.0 | 2.0 | 1400 | $2,000 | $1.43 | 24d | 1 | 1.05mi |
| 13128 Beacon Ct Hudson, FL | 2.0 | 2.0 | 1070 | $1,600 | $1.50 | 24d | 1 | 1.13mi |
| 8305 Sandwedge Cir Unit A Hudson, FL | 2.0 | 2.0 | 1144 | $1,450 | $1.27 | 21d | 1 | 1.13mi |
| 11241 Yewtree Ave Port Richey, FL | 3.0 | 2.0 | 1306 | $1,950 | $1.49 | 23d | 1 | 1.16mi |
| 11430 Rohrman Rd Port Richey, FL | 1.0 | 1.0 | 700 | $1,000 | $1.43 | 4d | 1 | 1.17mi |
| 13315 Neptune Dr Hudson, FL | 2.0 | 1.0 | 900 | $2,000 | $2.22 | 24d | 1 | 1.19mi |
| 7213 Seward Dr Port Richey, FL | 2.0 | 1.0 | 700 | $1,500 | $2.14 | 24d | 1 | 1.22mi |
| 7540 Venice Dr Port Richey, FL | 3.0 | 2.0 | 1394 | $1,775 | $1.27 | 4d | 1 | 1.23mi |
| 6731 Sandra Dr Port Richey, FL | 2.0 | 1.0 | 816 | $1,575 | $1.93 | 24d | 1 | 1.24mi |
| 11103 Harding Dr Unit 2 Port Richey, FL | 2.0 | 1.0 | 760 | $1,450 | $1.91 | 20d | 1 | 1.29mi |
| 13428 Neptune Dr Hudson, FL | 3.0 | 2.0 | 1258 | $2,450 | $1.95 | 24d | 1 | 1.29mi |
| 8161 Braddock Cir #1 Port Richey, FL | 2.0 | 2.0 | 1000 | $1,595 | $1.59 | 17d | 1 | 1.30mi |
| 7705 Ilex Dr Port Richey, FL | 3.0 | 2.0 | 1349 | $2,000 | $1.48 | 24d | 1 | 1.31mi |
HOA detail
- Monthly dues
- $20 · $240/yr
- Likely covers
- waterelectricpool
Listing history 17 events
-
2026-05-04status Pending
-
2026-04-07price $134,900
-
2026-02-27price $139,900
-
2026-02-27status Active
-
2026-02-18status Pending
-
2026-02-13price $144,900
-
2026-01-19price $149,900
-
2025-11-03price $159,900
-
2025-10-13price $164,900
-
2025-09-17price $169,000
-
2025-09-07price $179,000
-
2025-08-29price $179,900
-
2025-08-16$189,000 Active
-
2021-10-07soldstatus $63,000
-
2021-07-16$60,000 Active
-
2000-05-02soldstatus $41,900
-
1997-04-29soldstatus $35,000
ⓘ Source: listings_history table (triggers on properties + properties_extension) + one-shot
backfill from property_details.listing_events for pre-trigger history.
Tax reassessment forecast FL · Resets to sale price
- Current annual tax
- $695 · $58/mo
- Projected year-2 tax
- $1,120 · $93/mo
- Expected delta
- +$425/yr (+$35/mo · 61.2%)
ⓘ Screening estimate from a state-policy table — verify with the county assessor before closing.
Climate risk First Street
- Flood 7/10 Severe FEMA zone X (shaded) · 76% chance over 30 yrs
- Wildfire 6/10 Major
- Heat 10/10 Extreme 7 d/yr ≥114°F today · 23 d/yr by 30 yrs out
- Wind 10/10 Extreme 99% chance of damaging wind over 30 yrs
- Air quality 2/10 Low 1 unhealthy d/yr today · 3 by 30 yrs out
Nearby sold comps map
Loading sold comps map…
Walkable amenities ~0.75 mi
Loading nearby amenities…
Taxation est. · year 1
- Rental income
- $20,304
- − Mortgage interest
- −$7,556
- − Property taxes
- −$695
- − Insurance
- −$1,472
- − Repairs & maintenance
- −$1,624
- − Management
- −$1,624
- − HOA
- −$240
- − Depreciation
- −$3,924
- Taxable income
- $3,167
- Est. tax owed @ 24.0%
- −$760
- After-tax cash flow
- $4,384/yr
For passive investors: Depreciation is non-cash, so a rental often shows a tax loss while cash-flowing — sheltering income. Rental losses are passive: they offset passive income freely, and up to $25,000/yr can offset ordinary (W-2) income if you actively participate and your MAGI is under $100k (phasing out to $0 by $150k); unused losses carry forward. On sale, claimed depreciation is recaptured at up to 25%, and gains may owe capital-gains tax (a 1031 exchange can defer both). Figures are a year-1 estimate at your 24.0% rate — not tax advice; consult a CPA.
Schools (NCES district)
- District
- Pasco
- NCES district ID
- 1201530
- Math proficiency
- 50% ▼ -10.00%
- Reading proficiency
- 52% ▼ -5.00%
- Median HH income
- $45,039
- Composite
- 43.14/100
- National rank
- #3074
- State rank
- #32 of 73 in FL
Livability — Bayonet Point
- Score
- 69/100
- State rank
- #485
- US rank
- #8934
Category grades
Schools grade is shown separately in the Schools card above.
Census & demographics
- Census place
- Bayonet Point, FL
- County
- Pasco County · 524,098 people
- Metro
- Tampa-St. Petersburg-Clearwater, FL
- Population (ZIP)
- 30,689
- Household income
- $51,280
- Rent vs Own
- Severe rent burden
- 946.0
Population outlook (Pasco County) Hauer SSP2
- Today (2025)
- 570,045 people
- By 2030
- 605,844 · +6.3%
- By 2040
- 674,806 · +18.4%
- By 2050
- 736,022 · +29.1%
- By 2075
- 862,900 · +51.4%
- By 2100
- 906,364 · +59.0%
Race, ethnicity, and origin ACS 2023
- Neighborhood character
- Predominantly White (86%)
- Race & ethnicity
- White 86% Hispanic / Latino 7% Two or more races 6% Black 2% Asian 2%
- Hispanic origin (detail)
- Mexican 1% Puerto Rican 2%
- Common ancestry
- Romanian 4% Lithuanian 3% Slovak 2%
- Foreign-born
- 7% · Canada, Jamaica, Vietnam
- Languages at home
- 91% English-only · Spanish 5% Other Indo-European 2% French/Haitian/Cajun 0%
Political lean MEDSL · Pasco
- 2024 margin
- Strong R (+25.2) · D 36.9% · R 62.1% · Other 1.0%
- 2008→2024 swing
- -21.6pp toward R · 2008: -3.6pp · 2024: -25.2pp
- All cycles
- 2024: R+25.2 2020: R+20.1 2016: R+21.6 2012: R+6.7 2008: R+3.6
Not yet ingested
- Civics
- —
Market trends
- HPI YoY
- ▼ -183.96%
- Current HPI
- 307.5552
- Rent YoY
- ▼ -2.26%
- Metro
- Tampa-St. Petersburg-Clearwater, FL
- State GDP YoY
- ▲ 3.28%
- F500 in state
- 36
Industry mix (Fortune 500 HQ in FL)
| Industry | F500 HQs | Revenue |
|---|---|---|
| Industrial Technology | 2 | $29B |
|
||
| Insurance | 2 | $17B |
|
||
| Retail | 1 | $60B |
|
||
| Technology Distribution | 1 | $58B |
|
||
| Homebuilding | 1 | $35B |
|
||
| Technology Manufacturing | 1 | $35B |
|
||
Price history
+285.4% since first listed17 events — show timeline
- 2026-05-04 Pending — Stellar MLS as Distributed by MLS Grid
- 2026-04-07 Price Changed $134,900 Stellar MLS as Distributed by MLS Grid
- 2026-02-27 Price Changed $139,900 Stellar MLS as Distributed by MLS Grid
- 2026-02-27 Relisted — Stellar MLS as Distributed by MLS Grid
- 2026-02-18 Pending — Stellar MLS as Distributed by MLS Grid
- 2026-02-13 Price Changed $144,900 Stellar MLS as Distributed by MLS Grid
- 2026-01-19 Price Changed $149,900 Stellar MLS as Distributed by MLS Grid
- 2025-11-03 Price Changed $159,900 Stellar MLS as Distributed by MLS Grid
- 2025-10-13 Price Changed $164,900 Stellar MLS as Distributed by MLS Grid
- 2025-09-17 Price Changed $169,000 Stellar MLS as Distributed by MLS Grid
- 2025-09-07 Price Changed $179,000 Stellar MLS as Distributed by MLS Grid
- 2025-08-29 Price Changed $179,900 Stellar MLS as Distributed by MLS Grid
- 2025-08-16 Listed $189,000 Stellar MLS as Distributed by MLS Grid
- 2021-10-07 Sold (Public Records) $63,000 Public Records
- 2021-07-16 Listed $60,000 Stellar MLS as Distributed by MLS Grid
- 2000-05-02 Sold (Public Records) $41,900 Public Records
- 1997-04-29 Sold (Public Records) $35,000 Public Records
Property tax history
-0.8%/yrLatest (2025): $695 · +2.0% YoY. Source: county tax records.
Cash-flow waterfall
monthlySold comps — $/sqft
last 12 mo · ≤1 miLoading sold comps…