3969 Sylvester Cir · Macon-Bibb County, GA
Flood risk 1/10 · Minimal
- FEMA flood zone
- X (unshaded)
- Chance of flooding over 30 yrs
- 0.0%
- Est. flood insurance / yr
- $473 – $860
Fire risk 5/10 · Moderate
- Est. fire insurance / yr
- $963 – $1,789
Heat risk 7/10 · Major
- Hot days now (above 107°F)
- 7 days/yr
- Hot days in 30 yrs
- 18 days/yr
Wind risk 6/10 · Moderate
- Chance of severe wind over 30 yrs
- 66.0%
Air-quality risk 4/10 · Minor
- Unhealthy air days now
- 5 days/yr
- Unhealthy air days in 30 yrs
- 5 days/yr
Risk factors via First Street. Map © Google.
Why this score? — see what drove the D+ grade
The composite is a weighted blend of 9 inputs, each scored 0–100. Each bar is that input's sub-score; the figure is the points it added to the 100-point composite (weight × sub-score).
- Cash flow +11.9/30.0
- ARV discount +11.1/15.0
- Appreciation +7.2/10.0
- Rent growth +5.0/5.0
- DSCR +3.5/10.0
- 1% rule +2.7/10.0
- Livability +2.5/5.0
- Condition / age +2.5/5.0
- Schools +1.2/10.0
$174,900
🖨 Deal sheet 📄 Offer letter ✓ Due diligence
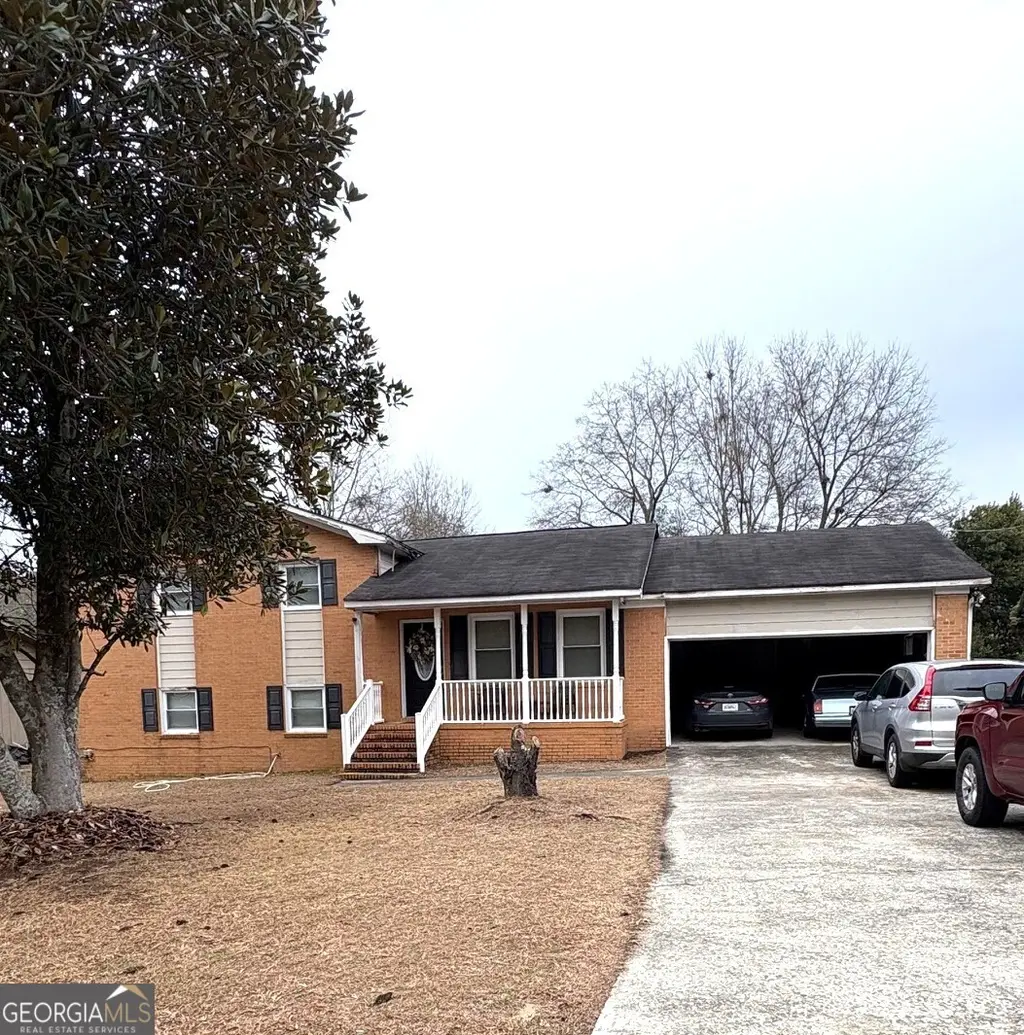
Listing remarks
Welcome home to this well-kept split-level home in Macon, Georgia. This home has over 2100 Sqft, 3 bedrooms and 2.5 bathrooms, plus a 4th room downstairs that can be used as a bonus room, home office, or even an extra bedroom. The home has a comfortable layout with plenty of space to grow. Downstairs, you will also find a half bath that can be converted into a full bathroom over time, allowing you to add value while making it your own. Enjoy a nice-sized backyard perfect for family time, entertaining, or simply relaxing. The two-car garage provides added convenience and storage. While the home may need a few repairs, it is priced with opportunity in mind, making it a great option for a buye
Key facts
- Half bath
- Nice-sized backyard
- Bonus room
Tags
Property features AI
Finance
- Other: Property levels described as one and one-half
- HOA & community: Street lights in the community
Exterior
- Parking: Attached garage; Two garage spaces (two total parking spaces)
- Utilities: Public water; Septic sewer (septic tank); Cable available; Electricity available; Natural gas available; Phone available; Water available; Electric service: Other
- Home design: One-and-a-half story home; Fee simple ownership
- Construction: Brick construction (brick 4 sides); Composition roof; Slab foundation; Resale condition
- Exterior features: Front porch; Other exterior features
Interior
- Kitchen: Eat-in kitchen with pantry; Electric range; Microwave
- Bedrooms: Three main-level bedrooms; One lower-level bedroom; Bedroom features: Other
- Flooring: Carpet; Hardwood; Laminate
- Bathrooms: Two full bathrooms; One half bathroom; Two main-level bathrooms; One lower-level half bathroom; Master bathroom: Other
- Heating & cooling: Central heating (electric); Central air; Ceiling fans
- Interior features: Insulated windows; No shared/common walls; Finished basement with interior and exterior entry; Open-concept dining area; Bonus room
- Laundry & utility: Laundry room; Laundry closet; Additional laundry features: Other
Neighborhood map
What this means for you Summary
Snapshot
- This is a 3-bed/2.0-bath single-family listed at $175k.
Deal economics
- At list price, monthly cash flow is $-44 ($-526/yr) — negative.
- To cash-flow at today's rent, offer at most $167k (4.4% below list).
- To meet the 1% rule (rent ≥ 1% of price), the offer needs to be $134k (23.5% below list).
- Recommended offer: $134k (23.5% below list) — sets the bar for 1% rule.
Location & tenants
- Location reads: area grade D — affects rentability + tenant quality, not the cash-flow math above.
- Bibb County (urban): math 11% / reading 18% proficiency, ranked #161 of 174 in GA (top 92%) — low school quality limits family demand, transient renter base, plan for 1-2y turnover; 75% free/reduced lunch — lower-income household profile, screen leases tightly.
- Market conditions: Rents rising fast (+10.8%/yr); 122 active listings in the ZIP; lower-income renter base — watch delinquency; 154 units permitted in Bibb County in 2024 (0 in 5+ unit buildings).
- This rent runs 36% of the median local income ($45k/yr) — at the standard rent-burdened threshold; future hikes will face affordability resistance.
Forward outlook
- In year one you build about $9k of equity ($1k loan paydown + $8k appreciation (4.3% local appreciation)).
- Bibb County population projected at -12% by 2050 — secular population decline; favor cash flow + early exit over multi-decade hold.
- At projected returns (4.3% appreciation + 8.0% rent growth), your $49k cash investment doubles in ~5 years — after that, you're playing with house money.
- By year 5, paydown + projected appreciation supports a ~$38k cash-out refi (75% LTV) — recoverable capital for the next deal without selling this one.
Negotiation context
- It's been on market 15 days — a 2% lower offer ($172k) is reasonable based on typical stale-listing flexibility.
- 6 sale attempts with the ask held roughly flat each time — persistent listings suggest the price (not the market) is what's stuck; bring a comps-based counter.
Risks & watch-outs
- Climate carrying-cost: major wind risk, 66% chance of damaging wind over 30y; moderate wildfire risk; extreme-heat days projected 7→18/yr by 2055 (HVAC capex compounding) — expect insurance premiums to compound above CPI over the hold.
Questions for the listing agent
- What do current leases actually rent for vs. the listed asking? Can we see a recent rent roll and the last 12 months of T-12 income?
- Built in 1974 — when were the roof, HVAC, electrical panel, plumbing, and water heater last replaced?
- Is there a deadline driving the sale (1031 exchange, divorce, estate, relocation)? That informs how much negotiation room exists.
- The area grade is low — what's the realistic commute time and amenity access for the typical tenant pool here? Any planned neighborhood developments (good or bad) we should know about?
- What's the average days-on-market for RENTAL listings here right now (not sales)? A rising rental-DOM trend means longer vacancies and softer asking-rent achievability than the comps imply.
- What's the recent tenant-quality profile in this submarket — average credit score on applications, eviction rate, late-payment / NSF rate, and stable-employment percentage? A property-management company in the area should have these aggregated.
- How much new for-sale + rental construction is in the pipeline within 1–3 miles? Heavy new supply typically softens prices + rents 12–24 months out; constrained supply supports both.
Investment metrics
- 1% rule
- 0.77% ✗
- Cap rate
- 5.99%
- Cash-on-cash
- -1.07%
- DSCR
- 0.95
- GRM
- 10.9
CMA / ARV
- ARV (median comp)
- $189,950
- List price
- $174,900
- Delta
- -6.34%
- Verdict
- FAIR
- Comps
- 5 within 1.0 mi
Show comp detail 1 sale within ~0.75 mi
| Address | Dist | Beds/Ba | Sqft | Sold | Price | $/sf | Match |
|---|---|---|---|---|---|---|---|
| 4675 Sylvester Cir N | 0.26mi | 3/2.0 | 1,926 (-11%) | 14mo | $120,000 | $62 | 59 |
Match score weights: distance 35% · size 25% · config 20% · recency 20%. Top-matched comps best support the ARV.
Projected returns pro-forma
4.31% appreciation · 8.0% rent growth · sell at horizon
- IRR
- 12.3%
- Equity multiple
- 1.77×
- Total profit
- $37,755
- Equity at exit
- $91,886
- IRR
- 15.5%
- Equity multiple
- 3.80×
- Total profit
- $136,946
- Equity at exit
- $152,906
Cash invested: $48,972 (down + closing). Projections, not guarantees.
Landlord ↔ Tenant lean methodology
- Overall (STATE)
- 90 Strongly Landlord-Friendly
- State Georgia
- 90 Strongly Landlord-Friendly · R+3
- County
- — inherits STATE
- City
- — inherits STATE
ZIP-level market 31217
- Home prices YoY
- 2.1%
- Rents YoY
- 10.8%
- Active inventory
- 122
- Price-to-rent
- 10.9×
Monthly cashflow live
- Estimated rent
- $1,339 medium interval (Pro) →
- Mortgage (P&I)
- −$917
- Tax from tax record
- −$111 /mo · $1,337/yr
- Insurance
- −$73
- HOA
- −$0
- Vacancy / Maint / Mgmt
- −$281
- Net cashflow
- $-44
Break-even live
UW: 25.0% down · 7.5% · 30yr · 1.5% tax · 5.0% vac · 8.0% maint · 8.0% mgmt
Financing live
Cash to close
- Down payment
- $43,725
- Closing costs
- $5,247
- Reserves months
- —
- Total cash needed
- —
Loan-product check · same deal, 3 products live
Conventional
25% down · 7.5% · 30yr
- Down + closing
- —
- Monthly P&I
- —
- Monthly cashflow
- —
- DSCR
- —
- Eligible?
- —
Personal DTI + credit; lowest rate.
DSCR
20% down · 8.5% · 30yr
- Down + closing
- —
- Monthly P&I
- —
- Monthly cashflow
- —
- DSCR
- —
- Eligible?
- —
No personal income docs; deal must DSCR.
Hard money
10% down · 12.0% · 12mo
- Down + closing
- —
- Monthly P&I
- —
- Monthly cashflow
- —
- DSCR
- —
- Eligible?
- —
Short-term bridge; refi at stabilization.
Listing history 20 events
-
2026-06-13days on market $174,900 Active 15 DOM
-
2026-06-10days on market $174,900 Active 13 DOM
-
2026-06-09days on market $174,900 Active 12 DOM
-
2026-06-08days on market $174,900 Active 11 DOM
-
2026-06-07days on market $174,900 Active 10 DOM
-
2026-06-03days on market $174,900 Active 6 DOM
-
2026-06-02days on market $174,900 Active 5 DOM
-
2026-06-01days on market $174,900 Active 4 DOM
-
2026-05-31days on market $174,900 Active 3 DOM
-
2026-05-30days on market $174,900 Active 2 DOM
-
2026-05-15historical
-
2026-05-08$177,900 New
-
2026-05-07historical
-
2026-04-16$177,900 New
-
2026-04-10historical
-
2026-03-23$174,900 New
-
2026-03-18historical
-
2026-03-04$185,000 New
-
2026-03-03historical
-
2026-02-10$185,000 New
ⓘ Source: listings_history table (triggers on properties + properties_extension) + one-shot
backfill from property_details.listing_events for pre-trigger history.
Tax reassessment forecast GA · Resets to sale price
- Current annual tax
- $1,337 · $111/mo
- Projected year-2 tax
- $1,609 · $134/mo
- Expected delta
- +$272/yr (+$23/mo · 20.4%)
ⓘ Screening estimate from a state-policy table — verify with the county assessor before closing.
Climate risk First Street
- Flood 1/10 Low FEMA zone X (unshaded) · 0% chance over 30 yrs
- Wildfire 5/10 Major
- Heat 7/10 Severe 7 d/yr ≥107°F today · 18 d/yr by 30 yrs out
- Wind 6/10 Major 66% chance of damaging wind over 30 yrs
- Air quality 4/10 Moderate 5 unhealthy d/yr today · 5 by 30 yrs out
Nearby sold comps map
Loading sold comps map…
Walkable amenities ~0.75 mi
Loading nearby amenities…
Taxation est. · year 1
- Rental income
- $16,065
- − Mortgage interest
- −$9,797
- − Property taxes
- −$1,337
- − Insurance
- −$874
- − Repairs & maintenance
- −$1,285
- − Management
- −$1,285
- − Depreciation
- −$5,088
- Taxable loss
- −$3,602
- Est. tax savings @ 24.0%
- +$864
- After-tax cash flow
- $338/yr
For passive investors: Depreciation is non-cash, so a rental often shows a tax loss while cash-flowing — sheltering income. Rental losses are passive: they offset passive income freely, and up to $25,000/yr can offset ordinary (W-2) income if you actively participate and your MAGI is under $100k (phasing out to $0 by $150k); unused losses carry forward. On sale, claimed depreciation is recaptured at up to 25%, and gains may owe capital-gains tax (a 1031 exchange can defer both). Figures are a year-1 estimate at your 24.0% rate — not tax advice; consult a CPA.
Schools (NCES district)
- District
- Bibb County
- NCES district ID
- 1300420
- Math proficiency
- 11% ▼ -14.00%
- Reading proficiency
- 18% ▼ -11.00%
- Median HH income
- $37,426
- Composite
- 12.13/100
- National rank
- #9654
- State rank
- #161 of 174 in GA
Livability — Macon-Bibb County
No livability data for this city. (Only ~50 U.S. cities are tracked.)
Census & demographics
- Census place
- Macon-Bibb County, GA
- County
- Bibb County · 164,332 people
- City population
- 143,186
- Metro
- Macon-Bibb County, GA
- Population (ZIP)
- 17,732
- Household income
- $44,809
- Rent vs Own
- Severe rent burden
- 391.0
Population outlook (Bibb County) Hauer SSP2
- Today (2025)
- 148,772 people
- By 2030
- 145,904 · -1.9%
- By 2040
- 139,404 · -6.3%
- By 2050
- 131,603 · -11.5%
- By 2075
- 111,050 · -25.4%
- By 2100
- 83,346 · -44.0%
Race, ethnicity, and origin ACS 2023
- Neighborhood character
- Majority Black (57%)
- Race & ethnicity
- Black 57% White 38% Two or more races 4% Hispanic / Latino 2%
- Common ancestry
- Slovak 1% Italian 1%
- Foreign-born
- 1% · Canada
- Languages at home
- 98% English-only · Spanish 1%
Political lean MEDSL · Bibb
- 2024 margin
- Strong D (+22.4) · D 61.0% · R 38.5%
- 2008→2024 swing
- +4.4pp toward D · 2008: 18.0pp · 2024: 22.4pp
- All cycles
- 2024: D+22.4 2020: D+23.8 2016: D+20.2 2012: D+20.0 2008: D+18.0
Not yet ingested
- Civics
- —
Market trends
- HPI YoY
- ▲ 4.31%
- Current HPI
- 209.9166
- Rent YoY
- ▲ 10.85%
- Metro
- Macon-Bibb County, GA
- State GDP YoY
- ▲ 2.66%
- F500 in state
- 28
Industry mix (Fortune 500 HQ in GA)
| Industry | F500 HQs | Revenue |
|---|---|---|
| Paper / Packaging | 2 | $29B |
|
||
| Retail | 1 | $160B |
|
||
| Transportation / Logistics | 1 | $91B |
|
||
| Airlines | 1 | $62B |
|
||
| Consumer Goods | 1 | $47B |
|
||
| Utilities | 1 | $25B |
|
||
Price history
-5.5% since first listed12 events — show timeline
- 2026-06-12 Listing Removed — GAMLS
- 2026-05-28 Listed $174,900 GAMLS
- 2026-05-15 Listing Removed — GAMLS
- 2026-05-08 Listed $177,900 GAMLS
- 2026-05-07 Listing Removed — GAMLS
- 2026-04-16 Listed $177,900 GAMLS
- 2026-04-10 Listing Removed — GAMLS
- 2026-03-23 Listed $174,900 GAMLS
- 2026-03-18 Listing Removed — GAMLS
- 2026-03-04 Listed $185,000 GAMLS
- 2026-03-03 Listing Removed — GAMLS
- 2026-02-10 Listed $185,000 GAMLS
Property tax history
+6.3%/yrLatest (2025): $1,337 · -1.3% YoY. Source: county tax records.
Cash-flow waterfall
monthlySold comps — $/sqft
last 12 mo · ≤1 miLoading sold comps…