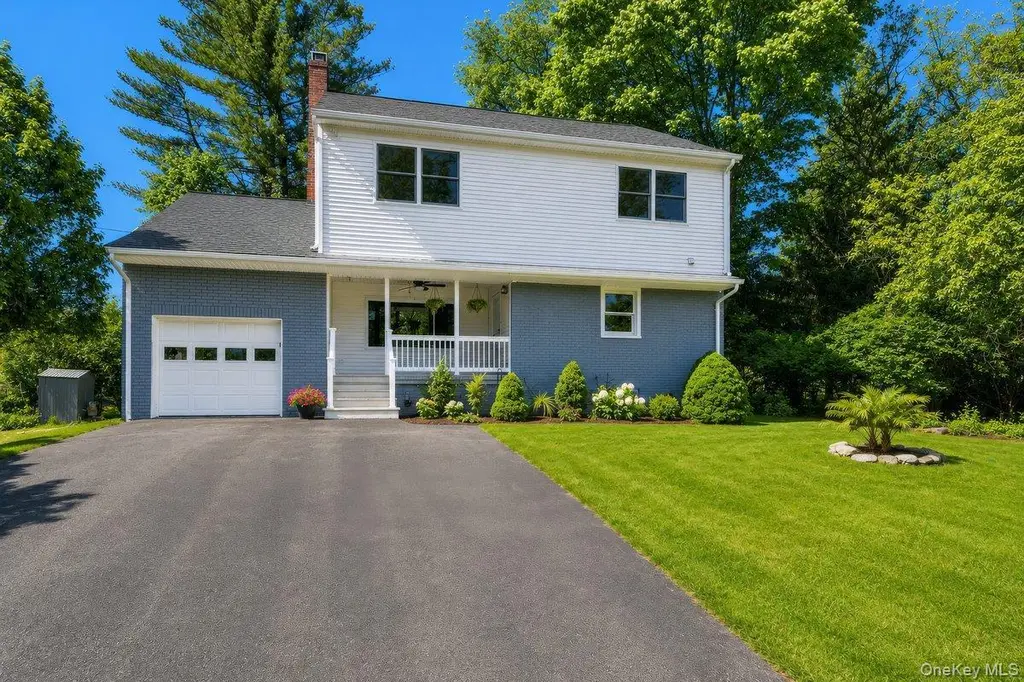
7 Rutledge Rd · Valhalla, NY
Flood risk 1/10 · Minimal
- FEMA flood zone
- X (unshaded)
- Chance of flooding over 30 yrs
- 0.0%
- Est. flood insurance / yr
- $473 – $860
Fire risk 3/10 · Minor
- Est. fire insurance / yr
- $691 – $1,283
Heat risk 5/10 · Moderate
- Hot days now (above 98°F)
- 6 days/yr
- Hot days in 30 yrs
- 13 days/yr
Wind risk 6/10 · Moderate
- Chance of severe wind over 30 yrs
- 27.0%
Air-quality risk 4/10 · Minor
- Unhealthy air days now
- 4 days/yr
- Unhealthy air days in 30 yrs
- 6 days/yr
Risk factors via First Street. Map © Google.
Why this score? — see what drove the B+ grade
The composite is a weighted blend of 9 inputs, each scored 0–100. Each bar is that input's sub-score; the figure is the points it added to the 100-point composite (weight × sub-score).
- Cash flow +30.0/30.0
- ARV discount +11.6/15.0
- DSCR +10.0/10.0
- 1% rule +9.5/10.0
- Schools +6.0/10.0
- Livability +3.2/5.0
- Rent growth +2.5/5.0
- Condition / age +2.5/5.0
- Appreciation +0.0/10.0
$899,000
🖨 Deal sheet 📄 Offer letter ✓ Due diligence
Listing remarks
Welcome to this beautiful single-family Colonial home, perfectly nestled on a peaceful cul-de-sac. Step inside to discover newly installed flooring throughout, elegant crown molding, and a bright, welcoming layout. The heart of the home is the stunning kitchen, featuring brand-new marble countertops, stylish cabinetry, and new appliances — perfect for both everyday living and entertaining. Located just 30 minutes from NYC, this home offers an easy commute while still providing the comfort and charm of suburban living. Don’t miss the opportunity to make this move-in-ready home your own!
Key facts
- Stylish cabinetry
- Peaceful cul-de-sac
- New appliances
Tags
Property features AI
Exterior
- Parking: Attached parking; Driveway parking; Total of 8 parking spaces; 1 garage space (garage present)
- Utilities: Electricity available (Con-Edison); Public sewer
- Home design: Single-family residence; Three or more stories/levels; Not waterfront
- Construction: Concrete perimeter foundation
- Exterior features: Brick and vinyl siding exterior; Covered porch
Interior
- Kitchen: Dishwasher; Electric cooktop; Electric oven; Exhaust fan; Microwave; Refrigerator; Stainless steel appliances; Granite counters; Kitchen island; Eat-in kitchen; Chef's kitchen
- Bedrooms: 9 total rooms (includes bedrooms) — three or more levels; Finished basement
- Flooring: Hardwood floors; Ceramic tile
- Bathrooms: 3 full bathrooms; Double vanity in at least one bathroom
- Heating & cooling: Oil heating; Central air conditioning; Living room fireplace (1)
- Interior features: Chef's kitchen; Crown molding; Double vanity; Eat-in kitchen; Entrance foyer; Formal dining room; Granite counters; High ceilings; Kitchen island; Open floorplan; Covered porch
- Laundry & utility: Electric dryer hookup; Basement (finished)
Neighborhood map
What this means for you Summary
Snapshot
- This is a 5-bed/3.0-bath single-family listed at $899k.
Deal economics
- At list price, monthly cash flow is $4k ($46k/yr) — positive.
- The deal already cash-flows at list — no discount required.
- Meets the 1% rule at list price ($13k rent vs $899k).
- Recommended offer: $872k (3.0% below list) — sets the bar for market timing.
- Cap rate 11.4% vs local median 3.8% in Valhalla — top-decile yield for the area; either an underpriced asset or a hidden risk that comps aren't pricing in. Stress-test before assuming the spread holds.
Location & tenants
- Location reads 63/100 on livability (#795 in NY) — a middle-class / working-renter tenant base. Strengths: crime A+, employment A+, commute A; Watch: amenities F, cost of living F, health & safety F.
- Mount Pleasant Central School District (suburban): math 62% / reading 65% proficiency, ranked #146 of 590 in NY (top 25%) — acceptable for families but not a draw, mixed tenant base, ~2y average lease; only 5% free/reduced lunch — higher-income household profile.
- Zoned schools: Columbus Elementary School (math 65% / reading 66%, grade B+, #587 of 2,108 statewide, top 28%, 482 students, 10% FRL); Westlake Middle School (math 55% / reading 61%, grade B, #184 of 729 statewide, top 25%, 429 students, 14% FRL); Westlake High School (math 72% / reading 95%, grade A, #409 of 1,100 statewide, top 39%, 547 students, 19% FRL).
- Market conditions: 28 active listings in the ZIP; 1 comparable units currently listed for rent nearby; 954 units permitted in Westchester County in 2024 (649 in 5+ unit buildings).
Forward outlook
- Local home prices are declining (-3.0%/yr); year-one equity from $6k of loan paydown is wiped out by about $27k of value loss. Plan a longer hold.
- Westchester County population projected at +10% by 2050 — modest demand growth; plan on rents tracking national, not racing it.
- At projected returns (-3.0% appreciation + 3.0% rent growth), your $252k cash investment doubles in ~7 years — after that, you're playing with house money.
Negotiation context
- It's been on market 38 days — a 3% lower offer ($872k) is reasonable based on typical stale-listing flexibility.
- Current owner paid $241k; list at $899k implies a 273% gain — meaningful room to come down on a strong offer.
Risks & watch-outs
- Watch-outs: built in 1958 — expect roof / HVAC / electrical / plumbing capex.
- Climate carrying-cost: major wind risk, 27% chance of damaging wind over 30y; extreme-heat days projected 6→13/yr by 2055 (HVAC capex compounding) — expect insurance premiums to compound above CPI over the hold.
Questions for the listing agent
- It's been on market 38 days. Have you received any prior offers? Is the seller open to a 3% concession, seller financing, or rate buy-down credit?
- Built in 1958 — when were the roof, HVAC, electrical panel, plumbing, and water heater last replaced?
- Is there a deadline driving the sale (1031 exchange, divorce, estate, relocation)? That informs how much negotiation room exists.
- What's the average days-on-market for RENTAL listings here right now (not sales)? A rising rental-DOM trend means longer vacancies and softer asking-rent achievability than the comps imply.
- What's the recent tenant-quality profile in this submarket — average credit score on applications, eviction rate, late-payment / NSF rate, and stable-employment percentage? A property-management company in the area should have these aggregated.
- How much new for-sale + rental construction is in the pipeline within 1–3 miles? Heavy new supply typically softens prices + rents 12–24 months out; constrained supply supports both.
Investment metrics
- 1% rule
- 1.45% ✓
- Cap rate
- 11.39%
- Cash-on-cash
- 18.19%
- DSCR
- 1.81
- GRM
- 5.8
CMA / ARV
- ARV (on-the-fly)
- $988,929
- Comps found
- 6
Show comp detail 6 sales within ~0.75 mi
| Address | Dist | Beds/Ba | Sqft | Sold | Price | $/sf | Match |
|---|---|---|---|---|---|---|---|
| 12 Heath Rd | 0.26mi | 4/2.0 (-1) | 2,350 (0%) | 10mo | $989,000 | $421 | 70 |
| 4 Clover Rd | 0.38mi | 4/3.5 (-1) | 2,240 (-5%) | 19mo | $1,139,000 | $508 | 51 |
| 20 Lochland Rd | 0.21mi | 4/2.0 (-1) | 2,033 (-14%) | 12mo | $850,000 | $418 | 48 |
| 21 Bruce Ln | 0.72mi | 4/3.5 (-1) | 2,156 (-8%) | 2mo | $668,000 | $310 | 44 |
| 8 Colonial Ln | 0.70mi | 4/2.5 (-1) | 2,178 (-7%) | 16mo | $847,500 | $389 | 34 |
| 13 Colonial Ln | 0.66mi | 4/2.5 (-1) | 2,028 (-14%) | 7mo | $1,050,000 | $518 | 34 |
Match score weights: distance 35% · size 25% · config 20% · recency 20%. Top-matched comps best support the ARV.
Projected returns pro-forma
-3.0% appreciation · 3.0% rent growth · sell at horizon
- IRR
- 9.8%
- Equity multiple
- 1.39×
- Total profit
- $97,703
- Equity at exit
- $134,044
- IRR
- 19.0%
- Equity multiple
- 2.59×
- Total profit
- $399,422
- Equity at exit
- $77,729
Cash invested: $251,720 (down + closing). Projections, not guarantees.
Landlord ↔ Tenant lean methodology
- Overall (STATE)
- 15 Strongly Tenant-Friendly
- State New York
- 15 Strongly Tenant-Friendly · D+10
- County
- — inherits STATE
- City
- — inherits STATE
ZIP-level market 10595
- Home prices YoY
- -17.7%
- Active inventory
- 28
- Price-to-rent
- 5.8×
Monthly cashflow live
- Estimated rent
- $12,999 medium interval (Pro) →
- Mortgage (P&I)
- −$4,714
- Tax from tax record
- −$1,364 /mo · $16,372/yr
- Insurance
- −$375
- HOA
- −$0
- Vacancy / Maint / Mgmt
- −$2,730
- Net cashflow
- $3,816
Break-even live
UW: 25.0% down · 7.5% · 30yr · 1.5% tax · 5.0% vac · 8.0% maint · 8.0% mgmt
Financing live
Cash to close
- Down payment
- $224,750
- Closing costs
- $26,970
- Reserves months
- —
- Total cash needed
- —
Loan-product check · same deal, 3 products live
Conventional
25% down · 7.5% · 30yr
- Down + closing
- —
- Monthly P&I
- —
- Monthly cashflow
- —
- DSCR
- —
- Eligible?
- —
Personal DTI + credit; lowest rate.
DSCR
20% down · 8.5% · 30yr
- Down + closing
- —
- Monthly P&I
- —
- Monthly cashflow
- —
- DSCR
- —
- Eligible?
- —
No personal income docs; deal must DSCR.
Hard money
10% down · 12.0% · 12mo
- Down + closing
- —
- Monthly P&I
- —
- Monthly cashflow
- —
- DSCR
- —
- Eligible?
- —
Short-term bridge; refi at stabilization.
Rent comps 1 comps
| Address | Beds | Baths | Sqft | Rent | $/sqft | DOM | Units | Dist |
|---|---|---|---|---|---|---|---|---|
| 10 Foxwood Ln Thornwood, NY | 4.0 | 3.5 | 2026 | $12,999 | $6.42 | 43d | 1 | 1.38mi |
Listing history 15 events
-
2026-06-18days on market $899,000 Active 38 DOM
-
2026-06-17pricedays on market $899,000 Active 37 DOM
-
2026-06-16days on market $949,000 Active 36 DOM
-
2026-06-15days on market $949,000 Active 35 DOM
-
2026-06-13days on market $949,000 Active 33 DOM
-
2026-06-09days on market $949,000 Active 29 DOM
-
2026-06-08days on market $949,000 Active 28 DOM
-
2026-06-07days on market $949,000 Active 27 DOM
-
2026-06-04days on market $949,000 Active 24 DOM
-
2026-06-03days on market $949,000 Active 23 DOM
-
2026-06-02days on market $949,000 Active 22 DOM
-
2026-06-01days on market $949,000 Active 21 DOM
-
2026-05-31days on market $949,000 Active 20 DOM
-
2026-05-08$949,000 Active
-
2000-03-31soldstatus $241,000
ⓘ Source: listings_history table (triggers on properties + properties_extension) + one-shot
backfill from property_details.listing_events for pre-trigger history.
Tax reassessment forecast NY · Partial reset (capped growth)
- Current annual tax
- $16,372 · $1,364/mo
- Projected year-2 tax
- $16,372 · $1,364/mo
- Expected delta
- $0/yr ($0/mo · 0.0%)
ⓘ Screening estimate from a state-policy table — verify with the county assessor before closing.
Climate risk First Street
- Flood 1/10 Low FEMA zone X (unshaded) · 0% chance over 30 yrs
- Wildfire 3/10 Moderate
- Heat 5/10 Major 6 d/yr ≥98°F today · 13 d/yr by 30 yrs out
- Wind 6/10 Major 27% chance of damaging wind over 30 yrs
- Air quality 4/10 Moderate 4 unhealthy d/yr today · 6 by 30 yrs out
Nearby sold comps map
Loading sold comps map…
Walkable amenities ~0.75 mi
Loading nearby amenities…
Taxation est. · year 1
- Rental income
- $155,988
- − Mortgage interest
- −$50,358
- − Property taxes
- −$16,372
- − Insurance
- −$4,495
- − Repairs & maintenance
- −$12,479
- − Management
- −$12,479
- − Depreciation
- −$26,153
- Taxable income
- $33,653
- Est. tax owed @ 24.0%
- −$8,077
- After-tax cash flow
- $37,714/yr
For passive investors: Depreciation is non-cash, so a rental often shows a tax loss while cash-flowing — sheltering income. Rental losses are passive: they offset passive income freely, and up to $25,000/yr can offset ordinary (W-2) income if you actively participate and your MAGI is under $100k (phasing out to $0 by $150k); unused losses carry forward. On sale, claimed depreciation is recaptured at up to 25%, and gains may owe capital-gains tax (a 1031 exchange can defer both). Figures are a year-1 estimate at your 24.0% rate — not tax advice; consult a CPA.
Schools (NCES district)
- District
- Mount Pleasant Central School District
- NCES district ID
- 3620160
- Math proficiency
- 62% ▼ -16.00%
- Reading proficiency
- 65% ▲ 3.00%
- Median HH income
- $109,054
- Composite
- 59.62/100
- National rank
- #911
- State rank
- #146 of 590 in NY
Livability — Valhalla
- Score
- 63/100
- State rank
- #795
- US rank
- #15361
Category grades
Schools grade is shown separately in the Schools card above.
Census & demographics
- City population
- 7,180
- Population (ZIP)
- 7,180
Population outlook (Westchester County) Hauer SSP2
- Today (2025)
- 1,028,035 people
- By 2030
- 1,051,636 · +2.3%
- By 2040
- 1,098,520 · +6.9%
- By 2050
- 1,136,044 · +10.5%
- By 2075
- 1,196,925 · +16.4%
- By 2100
- 1,175,147 · +14.3%
Race, ethnicity, and origin ACS 2023
- Neighborhood character
- Predominantly White (68%)
- Race & ethnicity
- White 68% Hispanic / Latino 13% Black 9% Asian 7% Two or more races 6%
- Hispanic origin (detail)
- Mexican 1% Puerto Rican 3% Dominican 2%
- Common ancestry
- Romanian 3% Italian 2% Armenian 2%
- Foreign-born
- 17% · Canada, Jamaica, China
- Languages at home
- 73% English-only · Other Indo-European 9% Spanish 8% Russian/Polish/Slavic 2%
Political lean MEDSL · Westchester
- 2024 margin
- Strong D (+26.3) · D 63.1% · R 36.9%
- 2008→2024 swing
- -1.3pp toward R · 2008: 27.6pp · 2024: 26.3pp
- All cycles
- 2024: D+26.3 2020: D+36.3 2016: D+32.8 2012: D+22.2 2008: D+27.6
Not yet ingested
- Civics
- —
Market trends
- HPI YoY
- ▼ -62.54%
- Current HPI
- 290.8983
- Rent YoY
- —
- Metro
- —
- State GDP YoY
- ▲ 2.60%
- F500 in state
- 92
Industry mix (Fortune 500 HQ in NY)
| Industry | F500 HQs | Revenue |
|---|---|---|
| Financial Services | 10 | $950B |
|
||
| Consumer Goods | 9 | $162B |
|
||
| Insurance | 4 | $225B |
|
||
| Telecommunications | 2 | $144B |
|
||
| Pharmaceuticals | 2 | $112B |
|
||
| Media / Entertainment | 2 | $69B |
|
||
Price history
+293.8% since first listed2 events — show timeline
- 2026-05-08 Listed $949,000 OneKey® MLS as Distributed by MLS Grid
- 2000-03-31 Sold (Public Records) $241,000 Public Records
Property tax history
+3.7%/yrLatest (2025): $16,372 · +2.6% YoY. Source: county tax records.
Cash-flow waterfall
monthlySold comps — $/sqft
last 12 mo · ≤1 miLoading sold comps…