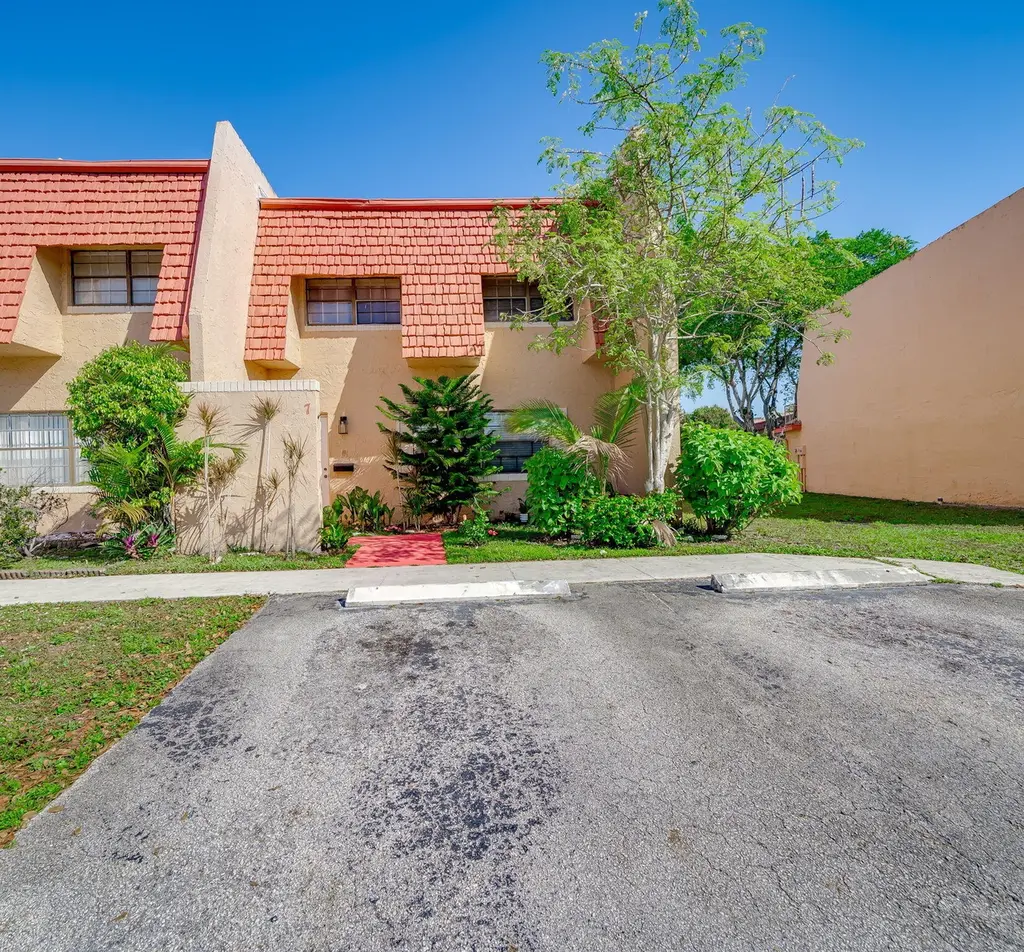
7 Ann Lee Ln · Tamarac, FL
Flood risk 1/10 · Minimal
- FEMA flood zone
- X (shaded)
- Chance of flooding over 30 yrs
- 0.0%
- Est. flood insurance / yr
- $507 – $1,088
Fire risk 1/10 · Minimal
- Est. fire insurance / yr
- $947 – $1,759
Heat risk 10/10 · Severe
- Hot days now (above 105°F)
- 7 days/yr
- Hot days in 30 yrs
- 28 days/yr
Wind risk 10/10 · Severe
- Chance of severe wind over 30 yrs
- 99.0%
Air-quality risk 3/10 · Minor
- Unhealthy air days now
- 3 days/yr
- Unhealthy air days in 30 yrs
- 3 days/yr
Risk factors via First Street. Map © Google.
Why this score? — see what drove the D grade
The composite is a weighted blend of 9 inputs, each scored 0–100. Each bar is that input's sub-score; the figure is the points it added to the 100-point composite (weight × sub-score).
- Cash flow +14.5/30.0
- ARV discount +7.5/15.0
- 1% rule +5.1/10.0
- DSCR +4.4/10.0
- Schools +4.1/10.0
- Livability +3.8/5.0
- Condition / age +2.5/5.0
- Rent growth +2.2/5.0
- Appreciation +0.0/10.0
$285,000
🖨 Deal sheet (PDF) 📄 Offer letter ✓ Due diligence
Listing remarks
LIGHT AND BRIGHT SPACIOUS FOUR BEDROOM CORNER TOWNHOME FEATURING SPLIT FLOOR PLAN WITH GOOD SIZED UPSTAIRS AND DOWNSTAIRS BEDROOMS AND BATHROOMS, INCLUDING AN ENSUITE PRIMARY BEDROOM AND BATHROOM WITH PRIVATE BALCONY OVERLOOKING A PEACEFUL GARDEN. LARGE LIVING AREA INCLUDES A WELL APPOINTED KITCHEN WITH PANTRY, DINING ROOM, AND ADDITIONAL FUNCTIONAL LIVING SPACE. CONVENIENT IN UNIT WASHER/DRYER, ADDITIONAL STORAGE SPACE, AND BACK PATIO ALLOW FOR EASY EVERY DAY LIVING. COMMUNITY FEATURES POOL, BASKETBALL AND TENNIS COURTS, PLAYGROUND, AND PICNIC AREA WHILE ASSOCIATION COVERS ROOF, BUILDING INSURANCE, LAWN/LANDSCAPING, INTERNET, CABLE, AND COMMON AREAS. GREAT LOCATION NEAR HIGHWAYS, RESTAURA
Key facts
- Private balcony
- Split floor plan
- In unit washer dryer
Tags
Property features AI
Finance
- Other: Pets not allowed
- HOA & community: Monthly HOA fee of $485; Community amenities include pool, basketball court, and picnic area; HOA covers cable TV, insurance, grounds and structure maintenance, trash, common areas, legal/accounting, reserve funds, roof repairs and pool service
Exterior
- Parking: Assigned parking; Guest parking; Two parking spaces total
- Security: Smoke detectors
- Utilities: Public water; Public sewer; Cable available; Electricity available; Phone available; Sewer connected; Water connected
- Home design: Townhouse; Two stories; Updated/remodeled; Faces south; Not waterfront
- Construction: Stucco and CBS construction; Mansard/Spanish tile roof; Slab foundation; Built/recorded living area 1,865
- Exterior features: Open patio; Patio
Interior
- Kitchen: Dishwasher; Electric range; Refrigerator; Trash compactor; Freezer; Electric water heater
- Bedrooms: One main-level bedroom
- Flooring: Carpet; Laminate; Tile
- Bathrooms: Two full bathrooms; One half bathroom
- Heating & cooling: Central heating; Central air conditioning
- Interior features: Walk-in closets; Split bedroom layout; Closet cabinetry; Satellite dish
- Laundry & utility: Inside laundry room
Neighborhood map
What this means for you Summary
Snapshot
- This is a 3-bed/3.0-bath condo listed at $285k.
Deal economics
- At list price, monthly cash flow is $65 ($775/yr) — positive.
- The deal already cash-flows at list — no discount required.
- Meets the 1% rule at list price ($3k rent vs $285k).
- Recommended offer: $268k (6.0% below list) — sets the bar for market timing.
- Cap rate 6.6% vs local median 3.9% in Tamarac — top-decile yield for the area; either an underpriced asset or a hidden risk that comps aren't pricing in. Stress-test before assuming the spread holds.
Location & tenants
- Location reads 76/100 on livability (#239 in FL, #3,785 nationally) — a middle-class / working-renter tenant base. Strengths: housing A+, health & safety A+, cost of living A-; Watch: employment C-, amenities F, commute F.
- Broward (suburban): math 42% / reading 53% proficiency, ranked #46 of 73 in FL (top 63%) — families likely to look elsewhere, expect single-tenant / working-renter base with shorter leases.
- Zoned schools: Pinewood Elementary School (math 59% / reading 53%, grade C+, #832 of 2,144 statewide, top 40%, 666 students, 76% FRL); Silver Lakes Middle School (math 21% / reading 30%, grade F, #512 of 571 statewide, top 90%, 782 students, 77% FRL); Boyd H. Anderson High School (math 10% / reading 14%, grade F, #622 of 667 statewide, top 93%, 2,038 students, 72% FRL) — zoned schools average 75% FRL vs 51% district-wide (24 pts higher); higher-poverty schools than district average — tighter screening recommended.
- Zoned-school proficiency averages 31% at this address vs 48% district-wide (-16 pts) — the specific schools serving this property underperform the Broward average; the district grade overstates school quality for this exact location.
- Market conditions: Rents soft (-1.4%/yr); 827 active listings in the ZIP; 40 comparable units currently listed for rent nearby; rentals at typical pace (median 26d on market — plan ~3-4 weeks tenant-placement turnaround); 2,111 units permitted in Broward County in 2024 (1,265 in 5+ unit buildings).
- At $2,881/mo this rent would consume 59% of the median local household income ($58k/yr) (locally 2809% of renters already pay >50% of income on rent) — very limited rent-growth headroom before tenants either downsize or default.
Forward outlook
- Local home prices are declining (-3.0%/yr); year-one equity from $2k of loan paydown is wiped out by about $9k of value loss. Plan a longer hold.
- Broward County population projected at +34% by 2050 — long-run rental-demand tailwind backs the buy-and-hold thesis.
Negotiation context
- It's been on market 88 days — a 6% lower offer ($268k) is reasonable based on typical stale-listing flexibility.
- Current owner paid $223k; 28% above their basis — modest negotiation headroom, anchor on the comps not their cost.
Risks & watch-outs
- Climate carrying-cost: severe wind risk, 99% chance of damaging wind over 30y; extreme-heat days projected 7→28/yr by 2055 (HVAC capex compounding) — expect insurance premiums to compound above CPI over the hold.
Questions for the listing agent
- It's been on market 88 days. Have you received any prior offers? Is the seller open to a 6% concession, seller financing, or rate buy-down credit?
- Built in 1974 — when were the roof, HVAC, electrical panel, plumbing, and water heater last replaced?
- What does the HOA fee cover, when was the last increase, and are there any pending special assessments or reserve-fund shortfalls?
- Any open or pending special assessments — roof, HVAC, plumbing, elevator, façade? What's the per-unit balance and payoff schedule, and is the seller paying it off at close or rolling it to the buyer?
- Why hasn't it sold? Are there any deal-killer items the seller is aware of (foundation, flood, title, zoning, code violations)?
- Is there a deadline driving the sale (1031 exchange, divorce, estate, relocation)? That informs how much negotiation room exists.
- Schools are B-rated — typically a magnet for longer-tenancy family renters. What's the average tenant stay here, and is there a school-zone premium baked into asking?
- The area grade is low — what's the realistic commute time and amenity access for the typical tenant pool here? Any planned neighborhood developments (good or bad) we should know about?
- What's the average days-on-market for RENTAL listings here right now (not sales)? A rising rental-DOM trend means longer vacancies and softer asking-rent achievability than the comps imply.
- What's the recent tenant-quality profile in this submarket — average credit score on applications, eviction rate, late-payment / NSF rate, and stable-employment percentage? A property-management company in the area should have these aggregated.
- How much new apartment / multifamily construction is in the pipeline within 1–3 miles? Heavy new supply (>2% of stock underway) typically softens rents 12–24 months out; light construction supports rent growth.
Investment metrics
- 1% rule
- 1.01% ✓
- Cap rate
- 6.56%
- Cash-on-cash
- 0.97%
- DSCR
- 1.04
- GRM
- 8.2
CMA / ARV
No comps found within radius.
Projected returns pro-forma
-3.0% appreciation · 0.0% rent growth · sell at horizon
- IRR
- -18.5%
- Equity multiple
- 0.37×
- Total profit
- $-50,320
- Equity at exit
- $42,494
- IRR
- -19.6%
- Equity multiple
- 0.12×
- Total profit
- $-70,372
- Equity at exit
- $24,642
Cash invested: $79,800 (down + closing). Projections, not guarantees.
Landlord ↔ Tenant lean methodology
- Overall (STATE)
- 87 Strongly Landlord-Friendly
- State Florida
- 87 Strongly Landlord-Friendly · R+3
- County
- — inherits STATE
- City
- — inherits STATE
ZIP-level market 33319
- Rents YoY
- -1.4%
- Active inventory
- 827
- Price-to-rent
- 8.2×
Monthly cashflow live
- Estimated rent
- $2,881 high interval (Pro) →
- Mortgage (P&I)
- −$1,495
- Tax from tax record
- −$113 /mo · $1,358/yr
- Insurance
- −$119
- HOA
- −$485
- Vacancy / Maint / Mgmt
- −$605
- Net cashflow
- $65
Break-even live
Sensitivity live
| Price | -10% $226 | -5% $145 | +0% $65 | +5% $-16 | +10% $-97 |
|---|---|---|---|---|---|
| Rent | -10% $-163 | -5% $-49 | +0% $65 | +5% $178 | +10% $292 |
| Rate | -1.0pp $208 | -0.5pp $137 | base $65 | +0.5pp $-9 | +1.0pp $-84 |
UW: 25.0% down · 7.5% · 30yr · 1.5% tax · 5.0% vac · 8.0% maint · 8.0% mgmt
Financing live
Cash to close
- Down payment
- $71,250
- Closing costs
- $8,550
- Reserves months
- —
- Total cash needed
- —
Loan-product check · same deal, 3 products live
Conventional
25% down · 7.5% · 30yr
- Down + closing
- —
- Monthly P&I
- —
- Monthly cashflow
- —
- DSCR
- —
- Eligible?
- —
Personal DTI + credit; lowest rate.
DSCR
20% down · 8.5% · 30yr
- Down + closing
- —
- Monthly P&I
- —
- Monthly cashflow
- —
- DSCR
- —
- Eligible?
- —
No personal income docs; deal must DSCR.
Hard money
10% down · 12.0% · 12mo
- Down + closing
- —
- Monthly P&I
- —
- Monthly cashflow
- —
- DSCR
- —
- Eligible?
- —
Short-term bridge; refi at stabilization.
Rent comps 40 comps
| Address | Beds | Baths | Sqft | Rent | $/sqft | DOM | Units | Dist |
|---|---|---|---|---|---|---|---|---|
| 33 Spinning Wheel Ln Tamarac, FL | 3.0 | 2.5 | 1865 | $2,750 | $1.47 | 26d | 1 | 0.14mi |
| 5821 Swordfish Ct Unit B Tamarac, FL | 2.0 | 2.5 | 1380 | $2,250 | $1.63 | 26d | 1 | 0.19mi |
| 5584 NW 59th Pl Tamarac, FL | 3.0 | 2.5 | 1488 | $2,700 | $1.81 | 26d | 1 | 0.24mi |
| 5843 Woodlands Blvd Unit 5843 Tamarac, FL | 3.0 | 2.5 | 1373 | $2,900 | $2.11 | 26d | 1 | 0.33mi |
| 1908 Players Pl North Lauderdale, FL | 3.0 | 2.0 | 1336 | $1,150 | $0.86 | 26d | 1 | 0.37mi |
| 5903 NW 57th Ct Tamarac, FL | 1.0–3.0 | 1.0–2.0 | 1080 | $2,877 | $2.66 | 0d | 28 | 0.37mi |
| 5476 Gate Lake Rd #5476 Tamarac, FL | 3.0 | 2.5 | 1811 | $2,900 | $1.60 | 3d | 1 | 0.37mi |
| 5424 Gate Lake Rd #5424 Tamarac, FL | 3.0 | 2.5 | 1811 | $3,000 | $1.66 | 26d | 1 | 0.37mi |
| 5820 NW 56th Pl Tamarac, FL | 4.0 | 2.0 | 1766 | $4,000 | $2.27 | 22d | 1 | 0.38mi |
| 5820 NW 56th Pl Unit 5820 Tamarac, FL | 4.0 | 2.0 | 1766 | $4,000 | $2.27 | 5d | 1 | 0.38mi |
| 5820 NW 56th Pl Tamarac, FL | 4.0 | 2.0 | 1766 | $4,000 | $2.27 | 3d | 1 | 0.38mi |
| 2008 Belmont Ln #2008 North Lauderdale, FL | 3.0 | 2.0 | 1480 | $2,400 | $1.62 | 26d | 1 | 0.53mi |
| 2707 Belmont Ln Unit 1 North Lauderdale, FL | 3.0 | 2.0 | 1553 | $2,250 | $1.45 | 26d | 1 | 0.53mi |
| 1307 Belmont Ln #1307 North Lauderdale, FL | 3.0 | 2.0 | 1480 | $2,350 | $1.59 | 26d | 1 | 0.53mi |
| 1507 Belmont Ln #1507 North Lauderdale, FL | 3.0 | 2.0 | 1553 | $2,300 | $1.48 | 26d | 1 | 0.53mi |
| 1507 Belmont Ln #1507 North Lauderdale, FL | 3.0 | 2.0 | 1553 | $2,300 | $1.48 | 22d | 1 | 0.53mi |
| 1850 Adventure Pl North Lauderdale, FL | 3.0 | 2.0 | 1336 | $2,750 | $2.06 | 26d | 1 | 0.56mi |
| 8103 SW 24th St Unit B-32 North Lauderdale, FL | 2.0 | 2.0 | 1530 | $2,400 | $1.57 | 26d | 1 | 0.60mi |
| 1726 SW 81st Ter Unit 1726 North Lauderdale, FL | 3.0 | 2.5 | 1404 | $2,900 | $2.07 | 26d | 1 | 0.66mi |
| 1400 Avon Ln North Lauderdale, FL | 1.0–3.0 | 1.0–2.0 | 1070 | $2,873 | $2.69 | 0d | 60 | 0.67mi |
| 1721 SW 81st Ter North Lauderdale, FL | 3.0 | 2.5 | 1404 | $2,750 | $1.96 | 9d | 1 | 0.68mi |
| 8172 S Coral Cir North Lauderdale, FL | 3.0 | 2.5 | 1460 | $2,699 | $1.85 | 26d | 1 | 0.70mi |
| 2306 SW 82nd Ter Unit 2306 North Lauderdale, FL | 2.0 | 2.5 | 1332 | $2,300 | $1.73 | 26d | 1 | 0.70mi |
| 1359 Avon Ln North Lauderdale, FL | 3.0 | 2.5 | 1632 | $3,300 | $2.02 | 26d | 1 | 0.75mi |
| 6870 SW 18th Ct #6870 Pompano Beach, FL | 4.0 | 2.0 | 1346 | $3,700 | $2.75 | 26d | 1 | 0.77mi |
| 4945 NW 55th Ct Tamarac, FL | 2.0 | 2.0 | 1579 | $2,850 | $1.80 | 6d | 1 | 0.86mi |
| 6710 NW 58th Ct Tamarac, FL | 2.0 | 2.0 | 1287 | $2,450 | $1.90 | 26d | 1 | 0.88mi |
| 5113 NW 52nd St Tamarac, FL | 4.0 | 4.0 | 2440 | $4,999 | $2.05 | 19d | 1 | 0.89mi |
| 5113 NW 52nd St Unit 5113 Tamarac, FL | 4.0 | 4.0 | 2440 | $4,999 | $2.05 | 17d | 1 | 0.89mi |
| 5113 NW 52nd St Tamarac, FL | 4.0 | 4.0 | 2440 | $4,999 | $2.05 | 9d | 1 | 0.89mi |
| 4851 NW 57th Ct Tamarac, FL | 4.0 | 2.5 | 1918 | $4,300 | $2.24 | 26d | 1 | 0.89mi |
| 1233 Hampton Blvd North Lauderdale, FL | 3.0 | 2.5 | 1612 | $2,750 | $1.71 | 26d | 1 | 0.89mi |
| 8502 SW 20th St North Lauderdale, FL | 4.0 | 2.0 | 1988 | $3,125 | $1.57 | 0d | 1 | 0.89mi |
| 1177 Sussex Dr North Lauderdale, FL | 2.0 | 1.0 | 1236 | $2,370 | $1.92 | 26d | 1 | 0.90mi |
| 4941 NW 55th St Tamarac, FL | 2.0 | 2.0 | 1639 | $2,700 | $1.65 | 26d | 1 | 0.90mi |
| 6717 NW 59th St Tamarac, FL | 3.0 | 2.0 | 1587 | $3,700 | $2.33 | 22d | 1 | 0.91mi |
| 1600 Coral Ave Unit 1600 North Lauderdale, FL | 3.0 | 2.5 | 1460 | $3,500 | $2.40 | 26d | 1 | 0.91mi |
| 8308 N Coral Cir Unit N/a North Lauderdale, FL | 3.0 | 2.5 | 1755 | $3,000 | $1.71 | 26d | 1 | 0.94mi |
| 1317 SW 82nd Ave North Lauderdale, FL | 3.0 | 2.0 | 1566 | $3,500 | $2.23 | 26d | 1 | 0.97mi |
| 1349 Sussex Dr #1349 North Lauderdale, FL | 2.0 | 2.5 | 1350 | $2,250 | $1.67 | 0d | 1 | 1.00mi |
HOA detail condo
- Monthly dues
- $485 · $5,820/yr
- Likely covers
- internetcablelandscapinginsurancepool
- Assessments
- None detected in remarks — confirm with the listing agent.
Listing history 20 events
-
2026-06-21days on market $285,000 Active 88 DOM
-
2026-06-18days on market $285,000 Active 85 DOM
-
2026-06-17days on market $285,000 Active 84 DOM
-
2026-06-16days on market $285,000 Active 83 DOM
-
2026-06-15days on market $285,000 Active 82 DOM
-
2026-06-13days on market $285,000 Active 80 DOM
-
2026-06-09days on market $285,000 Active 76 DOM
-
2026-06-08days on market $285,000 Active 75 DOM
-
2026-06-07days on market $285,000 Active 74 DOM
-
2026-06-04days on market $285,000 Active 71 DOM
-
2026-06-03days on market $285,000 Active 70 DOM
-
2026-06-02days on market $285,000 Active 69 DOM
-
2026-06-01days on market $285,000 Active 68 DOM
-
2026-05-31days on market $285,000 Active 67 DOM
-
2026-05-23price $285,000
-
2026-03-25$295,000 Active
-
2006-04-10soldstatus $223,000
-
2006-04-10soldstatus $223,000
-
1993-07-20soldstatus $55,000
-
1990-01-02soldstatus $56,000
ⓘ Source: listings_history table (triggers on properties + properties_extension) + one-shot
backfill from property_details.listing_events for pre-trigger history.
Tax reassessment forecast FL · Resets to sale price
- Current annual tax
- $1,358 · $113/mo
- Projected year-2 tax
- $2,366 · $197/mo
- Expected delta
- +$1,007/yr (+$84/mo · 74.1%)
ⓘ Screening estimate from a state-policy table — verify with the county assessor before closing.
Climate risk First Street
- Flood 1/10 Low FEMA zone X (shaded) · 0% chance over 30 yrs
- Wildfire 1/10 Low
- Heat 10/10 Extreme 7 d/yr ≥105°F today · 28 d/yr by 30 yrs out
- Wind 10/10 Extreme 99% chance of damaging wind over 30 yrs
- Air quality 3/10 Moderate 3 unhealthy d/yr today · 3 by 30 yrs out
Nearby sold comps map
Loading sold comps map…
Walkable amenities ~0.75 mi
Loading nearby amenities…
Taxation est. · year 1
- Rental income
- $34,574
- − Mortgage interest
- −$15,964
- − Property taxes
- −$1,358
- − Insurance
- −$1,425
- − Repairs & maintenance
- −$2,766
- − Management
- −$2,766
- − HOA
- −$5,820
- − Depreciation
- −$8,291
- Taxable loss
- −$3,817
- Est. tax savings @ 24.0%
- +$916
- After-tax cash flow
- $1,691/yr
For passive investors: Depreciation is non-cash, so a rental often shows a tax loss while cash-flowing — sheltering income. Rental losses are passive: they offset passive income freely, and up to $25,000/yr can offset ordinary (W-2) income if you actively participate and your MAGI is under $100k (phasing out to $0 by $150k); unused losses carry forward. On sale, claimed depreciation is recaptured at up to 25%, and gains may owe capital-gains tax (a 1031 exchange can defer both). Figures are a year-1 estimate at your 24.0% rate — not tax advice; consult a CPA.
Schools (NCES district)
- District
- Broward
- NCES district ID
- 1200180
- Math proficiency
- 42% ▼ -18.00%
- Reading proficiency
- 53% ▼ -5.00%
- Median HH income
- $52,139
- Composite
- 40.88/100
- National rank
- #3621
- State rank
- #46 of 73 in FL
Livability — Tamarac
- Score
- 76/100
- State rank
- #239
- US rank
- #3785
Category grades
Schools grade is shown separately in the Schools card above.
Census & demographics
- Census place
- Tamarac, FL
- County
- Broward County · 1,963,430 people
- Metro
- Miami-Fort Lauderdale-Pompano Beach, FL
- Population (ZIP)
- 54,450
- Household income
- $58,388
- Rent vs Own
- Severe rent burden
- 2809.0
Population outlook (Broward County) Hauer SSP2
- Today (2025)
- 2,207,033 people
- By 2030
- 2,360,704 · +7.0%
- By 2040
- 2,661,208 · +20.6%
- By 2050
- 2,946,698 · +33.5%
- By 2075
- 3,602,273 · +63.2%
- By 2100
- 3,970,984 · +79.9%
Race, ethnicity, and origin ACS 2023
- Neighborhood character
- Diverse neighborhood (Simpson 0.58)
- Race & ethnicity
- Black 61% Hispanic / Latino 17% White 15% Two or more races 11% Asian 4%
- Hispanic origin (detail)
- Puerto Rican 4% Cuban 2% Dominican 1%
- Common ancestry
- Hispanic 13% Romanian 1% Italian 1%
- Foreign-born
- 46% · Canada, Jamaica, Vietnam
- Languages at home
- 64% English-only · Spanish 15% French/Haitian/Cajun 15% Other Indo-European 2%
Political lean MEDSL · Broward
- 2024 margin
- D (+17.0) · D 58.0% · R 41.0%
- 2008→2024 swing
- -17.8pp toward R · 2008: 34.7pp · 2024: 17.0pp
- All cycles
- 2024: D+17.0 2020: D+29.8 2016: D+35.0 2012: D+34.9 2008: D+34.7
Not yet ingested
- Civics
- —
Market trends
- HPI YoY
- ▼ -202.84%
- Current HPI
- 328.4307
- Rent YoY
- ▼ -1.38%
- Metro
- Miami-Fort Lauderdale-Pompano Beach, FL
- State GDP YoY
- ▲ 3.28%
- F500 in state
- 36
Industry mix (Fortune 500 HQ in FL)
| Industry | F500 HQs | Revenue |
|---|---|---|
| Industrial Technology | 2 | $29B |
|
||
| Insurance | 2 | $17B |
|
||
| Retail | 1 | $60B |
|
||
| Technology Distribution | 1 | $58B |
|
||
| Homebuilding | 1 | $35B |
|
||
| Technology Manufacturing | 1 | $35B |
|
||
Price history
+408.9% since first listed6 events — show timeline
- 2026-05-23 Price Changed $285,000 Beaches MLS
- 2026-03-25 Listed $295,000 Beaches MLS
- 2006-04-10 Sold (Public Records) $223,000 Public Records
- 2006-04-10 Sold (Public Records) $223,000 Public Records
- 1993-07-20 Sold (Public Records) $55,000 Public Records
- 1990-01-02 Sold (Public Records) $56,000 Public Records
Property tax history
+7.5%/yrLatest (2025): $1,358 · +4.7% YoY. Source: county tax records.
Cash-flow waterfall
monthlySold comps — $/sqft
last 12 mo · ≤1 miLoading sold comps…