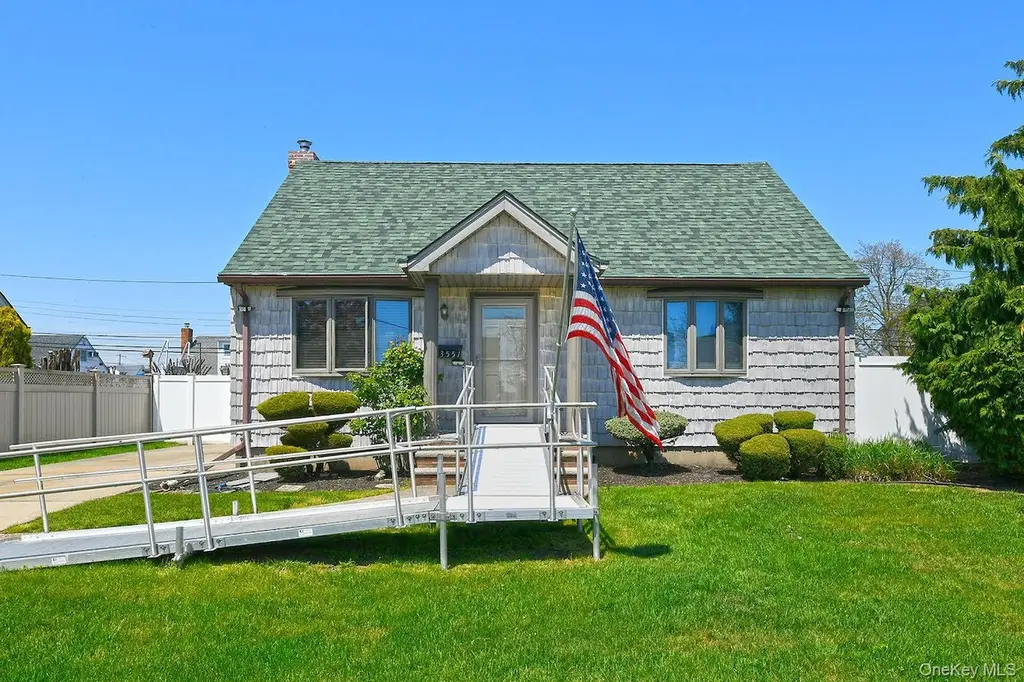
3551 Condor Rd · Levittown, NY
Flood risk 1/10 · Minimal
- FEMA flood zone
- X (unshaded)
- Chance of flooding over 30 yrs
- 0.0%
- Est. flood insurance / yr
- $473 – $860
Fire risk 1/10 · Minimal
- Est. fire insurance / yr
- $691 – $1,283
Heat risk 6/10 · Moderate
- Hot days now (above 94°F)
- 7 days/yr
- Hot days in 30 yrs
- 16 days/yr
Wind risk 6/10 · Moderate
- Chance of severe wind over 30 yrs
- 53.0%
Air-quality risk 4/10 · Minor
- Unhealthy air days now
- 3 days/yr
- Unhealthy air days in 30 yrs
- 5 days/yr
Risk factors via First Street. Map © Google.
Why this score? — see what drove the D+ grade
The composite is a weighted blend of 9 inputs, each scored 0–100. Each bar is that input's sub-score; the figure is the points it added to the 100-point composite (weight × sub-score).
- ARV discount +15.0/15.0
- Cash flow +12.5/30.0
- Schools +6.6/10.0
- Livability +4.1/5.0
- DSCR +3.7/10.0
- 1% rule +2.5/10.0
- Rent growth +2.5/5.0
- Condition / age +2.5/5.0
- Appreciation +0.0/10.0
$599,000
🖨 Deal sheet 📄 Offer letter ✓ Due diligence
Listing remarks
Welcome to 3551 Condor Road, a lovingly maintained classic Miller Cape Cod nestled on a quiet street in the heart of Levittown and located within the Island Trees School District. Offering four bedrooms, one full bathroom, and a full basement, this home features a functional layout with a first-floor primary bedroom, comfortable living area, and an eat-in kitchen. Recent updates and amenities include a 5-year-young roof, new chimney liner, 100-amp electric service, and in-ground sprinklers in both the front and rear yards. Step outside to enjoy the fully fenced, private backyard complete with a patio and awning, perfect for relaxing or entertaining. Conveniently located near shopping, resta
Key facts
- 6,000 sq ft lot
- Built 1949
- Listed 5 days
Property features AI
Exterior
- Parking: Driveway
- Utilities: Public sewer; Electricity connected; Water connected
- Home design: Single family residence
- Construction: Vinyl siding; Full (finished) basement; Crawl attic
- Exterior features: Full vinyl fence
Interior
- Kitchen: Convection oven; Cooktop (electric); Electric range/oven; Microwave; Refrigerator; Stainless steel appliances
- Bedrooms: Total rooms: 6
- Bathrooms: 1 full bathroom
- Heating & cooling: Oil heating; No central air
- Interior features: First-floor bedroom; Storm door(s); Patio
Neighborhood map
What this means for you Summary
Snapshot
- This is a 4-bed/1.0-bath single-family listed at $599k.
Deal economics
- At list price, monthly cash flow is $-87 ($-1k/yr) — negative.
- To cash-flow at today's rent, offer at most $584k (2.6% below list).
- To meet the 1% rule (rent ≥ 1% of price), the offer needs to be $451k (24.7% below list).
- Recommended offer: $451k (24.7% below list) — sets the bar for 1% rule.
- Cap rate 6.1% vs local median 3.4% in Levittown — top-decile yield for the area; either an underpriced asset or a hidden risk that comps aren't pricing in. Stress-test before assuming the spread holds.
Location & tenants
- Location reads 82/100 on livability (#73 in NY, #1,134 nationally) — a professional / high-income tenant draw. Strengths: schools A+, commute A+, employment A+; Watch: amenities D+, cost of living F.
- Island Trees Union Free School District (suburban): math 72% / reading 74% proficiency, ranked #79 of 590 in NY (top 13%) — strong family-tenant draw, lease renewals of 3-5y typical; only 13% free/reduced lunch — higher-income household profile.
- Market conditions: 229 active listings in the ZIP; 7 comparable units currently listed for rent nearby; rentals leasing fast (median 6d on market — plan ~1-2 weeks tenant-placement turnaround); high-income renter base; 824 units permitted in Nassau County in 2024 (153 in 5+ unit buildings).
- This rent runs 37% of the median local income ($146k/yr) — at the standard rent-burdened threshold; future hikes will face affordability resistance.
Forward outlook
- Local home prices are declining (-3.0%/yr); year-one equity from $4k of loan paydown is wiped out by about $18k of value loss. Plan a longer hold.
- Nassau County population projected at +7% by 2050 — modest demand growth; plan on rents tracking national, not racing it.
Negotiation context
- Only 6 days on market — expect competitive offers; lowballing is unlikely to land.
- Current owner paid $68k; list at $599k implies a 774% gain — meaningful room to come down on a strong offer.
Risks & watch-outs
- Watch-outs: built in 1949 — expect roof / HVAC / electrical / plumbing capex.
- Climate carrying-cost: major wind risk, 53% chance of damaging wind over 30y; extreme-heat days projected 7→16/yr by 2055 (HVAC capex compounding) — expect insurance premiums to compound above CPI over the hold.
Questions for the listing agent
- What do current leases actually rent for vs. the listed asking? Can we see a recent rent roll and the last 12 months of T-12 income?
- Built in 1949 — when were the roof, HVAC, electrical panel, plumbing, and water heater last replaced?
- Is there a deadline driving the sale (1031 exchange, divorce, estate, relocation)? That informs how much negotiation room exists.
- Schools are A-rated — typically a magnet for longer-tenancy family renters. What's the average tenant stay here, and is there a school-zone premium baked into asking?
- The area grade is low — what's the realistic commute time and amenity access for the typical tenant pool here? Any planned neighborhood developments (good or bad) we should know about?
- What's the average days-on-market for RENTAL listings here right now (not sales)? A rising rental-DOM trend means longer vacancies and softer asking-rent achievability than the comps imply.
- What's the recent tenant-quality profile in this submarket — average credit score on applications, eviction rate, late-payment / NSF rate, and stable-employment percentage? A property-management company in the area should have these aggregated.
- How much new for-sale + rental construction is in the pipeline within 1–3 miles? Heavy new supply typically softens prices + rents 12–24 months out; constrained supply supports both.
Investment metrics
- 1% rule
- 0.75% ✗
- Cap rate
- 6.12%
- Cash-on-cash
- -0.62%
- DSCR
- 0.97
- GRM
- 11.1
CMA / ARV
- ARV (median comp)
- $754,613
- List price
- $599,000
- Delta
- -20.62%
- Verdict
- UNDERPRICED
- Comps
- 20 within 1.0 mi
Show comp detail 12 sales within ~0.75 mi
| Address | Dist | Beds/Ba | Sqft | Sold | Price | $/sf | Match |
|---|---|---|---|---|---|---|---|
| 125 Meridian Rd | 0.16mi | 4/1.0 | 1,154 (+7%) | 7mo | $629,000 | $545 | 74 |
| 1 Ranch Ln | 0.44mi | 3/1.0 (-1) | 1,050 (-2%) | 3mo | $558,000 | $531 | 68 |
| 38 Celestial Ln | 0.18mi | 4/2.0 | 1,200 (+12%) | 2mo | $675,000 | $563 | 67 |
| 140 Jerusalem Ave | 0.57mi | 3/1.0 (-1) | 1,050 (-2%) | 2mo | $615,000 | $586 | 63 |
| 7 Constable Ln | 0.68mi | 4/1.5 | 1,114 (+4%) | 1mo | $710,000 | $637 | 60 |
| 59 Corncrib Ln | 0.64mi | 4/1.5 | 1,134 (+6%) | 0mo | $680,000 | $600 | 59 |
| 15 Hewmann Pl | 0.69mi | 3/1.0 (-1) | 1,079 (+0%) | 6mo | $650,000 | $602 | 57 |
| 59 Cotton Ln | 0.64mi | 4/1.0 | 1,154 (+7%) | 6mo | $700,000 | $607 | 53 |
| 111 Michael Pl | 0.50mi | 3/2.0 (-1) | 1,140 (+6%) | 6mo | $735,000 | $645 | 53 |
| 89 Tanners Ln | 0.75mi | 3/1.0 (-1) | 1,050 (-2%) | 6mo | $610,000 | $581 | 52 |
| 12 Meridian Rd | 0.49mi | 4/2.0 | 1,200 (+12%) | 4mo | $768,000 | $640 | 50 |
| 113 Hickory Ln | 0.64mi | 3/1.5 (-1) | 1,182 (+10%) | 0mo | $650,000 | $550 | 46 |
Match score weights: distance 35% · size 25% · config 20% · recency 20%. Top-matched comps best support the ARV.
Projected returns pro-forma
-3.0% appreciation · 3.0% rent growth · sell at horizon
- IRR
- -17.4%
- Equity multiple
- 0.39×
- Total profit
- $-102,837
- Equity at exit
- $89,313
- IRR
- -9.5%
- Equity multiple
- 0.42×
- Total profit
- $-97,624
- Equity at exit
- $51,791
Cash invested: $167,720 (down + closing). Projections, not guarantees.
Landlord ↔ Tenant lean methodology
- Overall (STATE)
- 15 Strongly Tenant-Friendly
- State New York
- 15 Strongly Tenant-Friendly · D+10
- County
- — inherits STATE
- City
- — inherits STATE
ZIP-level market 11756
- Active inventory
- 229
- Price-to-rent
- 11.1×
Monthly cashflow live
- Estimated rent
- $4,513 high interval (Pro) →
- Mortgage (P&I)
- −$3,141
- Tax from tax record
- −$262 /mo · $3,141/yr
- Insurance
- −$250
- HOA
- −$0
- Vacancy / Maint / Mgmt
- −$948
- Net cashflow
- $-87
Break-even live
UW: 25.0% down · 7.5% · 30yr · 1.5% tax · 5.0% vac · 8.0% maint · 8.0% mgmt
Financing live
Cash to close
- Down payment
- $149,750
- Closing costs
- $17,970
- Reserves months
- —
- Total cash needed
- —
Loan-product check · same deal, 3 products live
Conventional
25% down · 7.5% · 30yr
- Down + closing
- —
- Monthly P&I
- —
- Monthly cashflow
- —
- DSCR
- —
- Eligible?
- —
Personal DTI + credit; lowest rate.
DSCR
20% down · 8.5% · 30yr
- Down + closing
- —
- Monthly P&I
- —
- Monthly cashflow
- —
- DSCR
- —
- Eligible?
- —
No personal income docs; deal must DSCR.
Hard money
10% down · 12.0% · 12mo
- Down + closing
- —
- Monthly P&I
- —
- Monthly cashflow
- —
- DSCR
- —
- Eligible?
- —
Short-term bridge; refi at stabilization.
Rent comps 7 comps
| Address | Beds | Baths | Sqft | Rent | $/sqft | DOM | Units | Dist |
|---|---|---|---|---|---|---|---|---|
| 3685 Prairie Path Bethpage, NY | 3.0 | 2.0 | 1300 | $4,500 | $3.46 | 43d | 1 | 0.56mi |
| 8 Farmedge Rd Bethpage, NY | 4.0 | 2.0 | 1269 | $4,500 | $3.55 | 1d | 1 | 0.58mi |
| 152 Harrison Ave Unit A Bethpage, NY | 4.0 | 2.0 | 1200 | $4,200 | $3.50 | 43d | 1 | 0.98mi |
| 68 Summer Ln Hicksville, NY | 4.0 | 1.5 | 1236 | $4,750 | $3.84 | 20d | 1 | 1.27mi |
| 68 Summer Ln Hicksville, NY | 4.0 | 1.5 | 1236 | $4,700 | $3.80 | 1d | 1 | 1.27mi |
| 68 Summer Ln Hicksville, NY | 4.0 | 1.5 | 1236 | $4,700 | $3.80 | 6d | 1 | 1.27mi |
| 22 Shelter Ln Levittown, NY | 3.0 | 1.5 | 1050 | $4,500 | $4.29 | 1d | 1 | 1.49mi |
Listing history 8 events
-
2026-06-17days on market $599,000 Active 6 DOM
-
2026-06-16days on market $599,000 Active 5 DOM
-
2026-06-15days on market $599,000 Active 4 DOM
-
2026-06-13days on market $599,000 Active 2 DOM
-
2026-06-13remarks 699-char remark
-
2026-06-13statusdays on market $599,000 Active 1 DOM
-
2026-05-01historical
-
1983-08-01soldstatus $68,500
ⓘ Source: listings_history table (triggers on properties + properties_extension) + one-shot
backfill from property_details.listing_events for pre-trigger history.
Tax reassessment forecast NY · Partial reset (capped growth)
- Current annual tax
- $3,141 · $262/mo
- Projected year-2 tax
- $6,632 · $553/mo
- Expected delta
- +$3,491/yr (+$291/mo · 111.1%)
ⓘ Screening estimate from a state-policy table — verify with the county assessor before closing.
Climate risk First Street
- Flood 1/10 Low FEMA zone X (unshaded) · 0% chance over 30 yrs
- Wildfire 1/10 Low
- Heat 6/10 Major 7 d/yr ≥94°F today · 16 d/yr by 30 yrs out
- Wind 6/10 Major 53% chance of damaging wind over 30 yrs
- Air quality 4/10 Moderate 3 unhealthy d/yr today · 5 by 30 yrs out
Nearby sold comps map
Loading sold comps map…
Walkable amenities ~0.75 mi
Loading nearby amenities…
Taxation est. · year 1
- Rental income
- $54,160
- − Mortgage interest
- −$33,553
- − Property taxes
- −$3,141
- − Insurance
- −$2,995
- − Repairs & maintenance
- −$4,333
- − Management
- −$4,333
- − Depreciation
- −$17,425
- Taxable loss
- −$11,620
- Est. tax savings @ 24.0%
- +$2,789
- After-tax cash flow
- $1,745/yr
For passive investors: Depreciation is non-cash, so a rental often shows a tax loss while cash-flowing — sheltering income. Rental losses are passive: they offset passive income freely, and up to $25,000/yr can offset ordinary (W-2) income if you actively participate and your MAGI is under $100k (phasing out to $0 by $150k); unused losses carry forward. On sale, claimed depreciation is recaptured at up to 25%, and gains may owe capital-gains tax (a 1031 exchange can defer both). Figures are a year-1 estimate at your 24.0% rate — not tax advice; consult a CPA.
Schools (NCES district)
- District
- Island Trees Union Free School District
- NCES district ID
- 3615510
- Math proficiency
- 72% ▼ -4.00%
- Reading proficiency
- 74% ▬ 0.00%
- Median HH income
- $96,206
- Composite
- 66.27/100
- National rank
- #427
- State rank
- #79 of 590 in NY
Livability — Levittown
- Score
- 82/100
- State rank
- #73
- US rank
- #1134
Category grades
Schools grade is shown separately in the Schools card above.
Census & demographics
- Census place
- Levittown, NY
- County
- Nassau County · 653,051 people
- City population
- 42,665
- Metro
- New York-Newark-Jersey City, NY-NJ-PA
- Population (ZIP)
- 42,665
- Household income
- $146,019
- Rent vs Own
- Severe rent burden
- 116.0
Population outlook (Nassau County) Hauer SSP2
- Today (2025)
- 1,409,302 people
- By 2030
- 1,431,482 · +1.6%
- By 2040
- 1,471,607 · +4.4%
- By 2050
- 1,502,845 · +6.6%
- By 2075
- 1,575,403 · +11.8%
- By 2100
- 1,554,356 · +10.3%
Race, ethnicity, and origin ACS 2023
- Neighborhood character
- Majority White (65%)
- Race & ethnicity
- White 65% Hispanic / Latino 18% Asian 12% Two or more races 10% Black 2%
- Hispanic origin (detail)
- Puerto Rican 4% Dominican 2%
- Common ancestry
- Romanian 4% Scotch-Irish 3% Lithuanian 1%
- Foreign-born
- 17% · Canada, China, Jamaica
- Languages at home
- 76% English-only · Spanish 11% Other Indo-European 5% Chinese 3%
Political lean MEDSL · Nassau
- 2024 margin
- Toss-up / Even · D 47.9% · R 52.1%
- 2008→2024 swing
- -12.6pp toward R · 2008: 8.4pp · 2024: -4.2pp
- All cycles
- 2024: R+4.2 2020: D+9.5 2016: D+5.3 2012: D+6.7 2008: D+8.4
Not yet ingested
- Civics
- —
Market trends
- HPI YoY
- ▼ -796.99%
- Current HPI
- 335.718
- Rent YoY
- —
- Metro
- New York-Newark-Jersey City, NY-NJ-PA
- State GDP YoY
- ▲ 2.60%
- F500 in state
- 92
Industry mix (Fortune 500 HQ in NY)
| Industry | F500 HQs | Revenue |
|---|---|---|
| Financial Services | 10 | $950B |
|
||
| Consumer Goods | 9 | $162B |
|
||
| Insurance | 4 | $225B |
|
||
| Telecommunications | 2 | $144B |
|
||
| Pharmaceuticals | 2 | $112B |
|
||
| Media / Entertainment | 2 | $69B |
|
||
Price history
3 events — show timeline
- 2026-06-11 Relisted — OneKey® MLS as Distributed by MLS Grid
- 2026-05-01 Coming Soon — OneKey® MLS as Distributed by MLS Grid
- 1983-08-01 Sold (Public Records) $68,500 Public Records
Property tax history
-4.5%/yrLatest (2024): $3,141 · -21.3% YoY. Source: county tax records.
Cash-flow waterfall
monthlySold comps — $/sqft
last 12 mo · ≤1 miLoading sold comps…