302 Glenbrook · San Antonio, TX
Flood risk 1/10 · Minimal
- FEMA flood zone
- X (unshaded)
- Chance of flooding over 30 yrs
- 0.0%
- Est. flood insurance / yr
- $507 – $1,088
Fire risk 3/10 · Minor
- Est. fire insurance / yr
- $1,222 – $2,270
Heat risk 8/10 · Major
- Hot days now (above 108°F)
- 7 days/yr
- Hot days in 30 yrs
- 22 days/yr
Wind risk 8/10 · Major
- Chance of severe wind over 30 yrs
- 80.0%
Air-quality risk 2/10 · Minimal
- Unhealthy air days now
- 0 days/yr
- Unhealthy air days in 30 yrs
- 2 days/yr
Risk factors via First Street. Map © Google.
Why this score? — see what drove the C- grade
The composite is a weighted blend of 9 inputs, each scored 0–100. Each bar is that input's sub-score; the figure is the points it added to the 100-point composite (weight × sub-score).
- Cash flow +13.2/30.0
- ARV discount +10.6/15.0
- Appreciation +10.0/10.0
- DSCR +4.0/10.0
- Livability +4.0/5.0
- 1% rule +3.8/10.0
- Rent growth +2.6/5.0
- Condition / age +2.5/5.0
- Schools +1.4/10.0
$158,999
🖨 Deal sheet 📄 Offer letter ✓ Due diligence
Listing remarks MLS
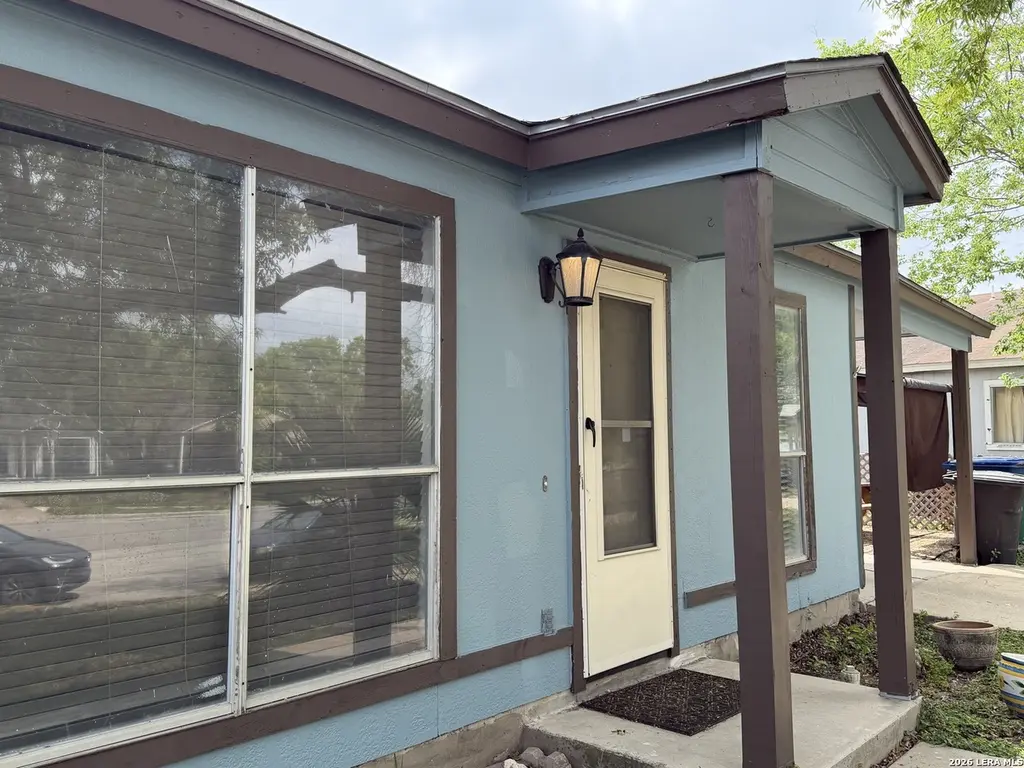
Welcome to 302 Glenbrook, a charming single-story home located in the quiet East Houston Estates community. This 3-bedroom, 1-bath residence offers approximately 1,050 sq. ft. of living space on a spacious 1/4-acre lot, giving you plenty of room to enjoy both indoors and out. Inside, you'll find a practical floor plan with a bright living area, cozy bedrooms, and a functional kitchen ready for your personal touch. Central heating and cooling ensure year-round comfort. The large backyard provides endless possibilities! Whether you envision a garden, outdoor entertaining space, or future expansion. A convenient carport offers covered parking. This home is perfect for first-time buyers, downsizers, or investors looking for a solid property with great potential. Don't miss this opportunity to own an affordable home with space to grow in San Antonio!
Key facts
- Functional kitchen
- Large backyard
- Single-story home
Tags
Neighborhood map
What this means for you Summary
Snapshot
- This is a 3-bed/1.0-bath single-family listed at $159k.
Deal economics
- At list price, monthly cash flow is $-4 ($-47/yr) — negative.
- To cash-flow at today's rent, offer at most $158k (0.4% below list).
- To meet the 1% rule (rent ≥ 1% of price), the offer needs to be $140k (12.0% below list).
- Recommended offer: $140k (12.0% below list) — sets the bar for market timing.
- Cap rate 6.3% vs local median 3.8% in San Antonio — top-decile yield for the area; either an underpriced asset or a hidden risk that comps aren't pricing in. Stress-test before assuming the spread holds.
Location & tenants
- Location reads 80/100 on livability (#31 in TX, #1,616 nationally) — a professional / high-income tenant draw. Strengths: amenities A+, commute A+, cost of living A+; Watch: schools C-, crime F.
- San Antonio ISD (urban): math 12% / reading 22% proficiency, ranked #805 of 826 in TX (top 98%) — low school quality limits family demand, transient renter base, plan for 1-2y turnover; 80% free/reduced lunch — lower-income household profile, screen leases tightly.
- Market conditions: Rents flat; 113 active listings in the ZIP; 20 comparable units currently listed for rent nearby; rentals at typical pace (median 24d on market — plan ~3-4 weeks tenant-placement turnaround); lower-income renter base — watch delinquency; 8,308 units permitted in Bexar County in 2024 (2,506 in 5+ unit buildings).
- This rent runs 40% of the median local income ($42k/yr) — at the standard rent-burdened threshold; future hikes will face affordability resistance.
Forward outlook
- In year one you build about $17k of equity ($1k loan paydown + $16k appreciation (10.0% local appreciation)).
- Bexar County population projected at +50% by 2050 — long-run rental-demand tailwind backs the buy-and-hold thesis.
- At projected returns (10.0% appreciation + 0.5% rent growth), your $45k cash investment doubles in ~3 years — after that, you're playing with house money.
- By year 3, paydown + projected appreciation supports a ~$43k cash-out refi (75% LTV) — recoverable capital for the next deal without selling this one.
Negotiation context
- It's been on market 264 days — a 12% lower offer ($140k) is reasonable based on typical stale-listing flexibility.
- 2 sale attempts with the ask held roughly flat each time — persistent listings suggest the price (not the market) is what's stuck; bring a comps-based counter.
Risks & watch-outs
- Climate carrying-cost: severe wind risk, 80% chance of damaging wind over 30y; extreme-heat days projected 7→22/yr by 2055 (HVAC capex compounding) — expect insurance premiums to compound above CPI over the hold.
Questions for the listing agent
- What do current leases actually rent for vs. the listed asking? Can we see a recent rent roll and the last 12 months of T-12 income?
- It's been on market 264 days. Have you received any prior offers? Is the seller open to a 12% concession, seller financing, or rate buy-down credit?
- Why hasn't it sold? Are there any deal-killer items the seller is aware of (foundation, flood, title, zoning, code violations)?
- Is there a deadline driving the sale (1031 exchange, divorce, estate, relocation)? That informs how much negotiation room exists.
- Crime grade is F in this area — have there been break-ins, vandalism, or insurance claims at this property in the last 3 years? What carrier currently insures it and at what premium?
- What's the average days-on-market for RENTAL listings here right now (not sales)? A rising rental-DOM trend means longer vacancies and softer asking-rent achievability than the comps imply.
- What's the recent tenant-quality profile in this submarket — average credit score on applications, eviction rate, late-payment / NSF rate, and stable-employment percentage? A property-management company in the area should have these aggregated.
- How much new for-sale + rental construction is in the pipeline within 1–3 miles? Heavy new supply typically softens prices + rents 12–24 months out; constrained supply supports both.
Investment metrics
- 1% rule
- 0.88% ✗
- Cap rate
- 6.26%
- Cash-on-cash
- -0.11%
- DSCR
- 1.00
- GRM
- 9.5
CMA / ARV
- ARV (median comp)
- $170,639
- List price
- $158,999
- Delta
- -6.82%
- Verdict
- FAIR
- Comps
- 20 within 1.0 mi
Show comp detail 12 sales within ~0.75 mi
| Address | Dist | Beds/Ba | Sqft | Sold | Price | $/sf | Match |
|---|---|---|---|---|---|---|---|
| 4818 John Victor | 0.26mi | 3/2.0 | 1,067 (+2%) | 8mo | $190,000 | $178 | 75 |
| 4818 Billy Dr | 0.29mi | 2/1.0 (-1) | 1,100 (+5%) | 2mo | $85,000 | $77 | 72 |
| 4906 Frostwood | 0.07mi | 3/2.0 | 1,190 (+13%) | 6mo | $115,000 | $97 | 66 |
| 4903 Huntsmoor Ct | 0.15mi | 3/1.0 | 1,177 (+12%) | 10mo | $160,000 | $136 | 65 |
| 4903 Melvin Dr | 0.16mi | 3/1.0 | 1,155 (+10%) | 15mo | $140,000 | $121 | 63 |
| 330 Glenbrook | 0.07mi | 3/2.0 | 912 (-13%) | 11mo | $177,000 | $194 | 61 |
| 4606 Old Coach | 0.64mi | 3/1.0 | 1,008 (-4%) | 8mo | $60,000 | $60 | 57 |
| 4518 Charles Williams | 0.64mi | 3/1.0 | 968 (-8%) | 2mo | $129,500 | $134 | 56 |
| 4851 Alfred | 0.23mi | 3/2.0 | 908 (-14%) | 15mo | $149,900 | $165 | 50 |
| 4730 Belinda Lee | 0.39mi | 4/2.0 (+1) | 1,078 (+3%) | 24mo | $150,000 | $139 | 48 |
| 4607 Belinda Lee | 0.56mi | 3/2.0 | 1,192 (+14%) | 2mo | $140,000 | $117 | 46 |
| 303 Glenoak Dr | 0.74mi | 3/1.5 | 1,027 (-2%) | 18mo | $195,000 | $190 | 44 |
Match score weights: distance 35% · size 25% · config 20% · recency 20%. Top-matched comps best support the ARV.
Projected returns pro-forma
10.0% appreciation · 0.53% rent growth · sell at horizon
- IRR
- 23.4%
- Equity multiple
- 2.86×
- Total profit
- $82,976
- Equity at exit
- $143,239
- IRR
- 20.3%
- Equity multiple
- 6.35×
- Total profit
- $238,387
- Equity at exit
- $308,900
Cash invested: $44,520 (down + closing). Projections, not guarantees.
Landlord ↔ Tenant lean methodology
- Overall (STATE)
- 87 Strongly Landlord-Friendly
- State Texas
- 87 Strongly Landlord-Friendly · R+5
- County
- — inherits STATE
- City
- — inherits STATE
ZIP-level market 78220
- Home prices YoY
- 9.1%
- Rents YoY
- 0.5%
- Active inventory
- 113
- Price-to-rent
- 9.5×
Monthly cashflow live
- Estimated rent
- $1,400 high interval (Pro) →
- Mortgage (P&I)
- −$834
- Tax from tax record
- −$210 /mo · $2,516/yr
- Insurance
- −$66
- HOA
- −$0
- Vacancy / Maint / Mgmt
- −$294
- Net cashflow
- $-4
Break-even live
UW: 25.0% down · 7.5% · 30yr · 1.5% tax · 5.0% vac · 8.0% maint · 8.0% mgmt
Financing live
Cash to close
- Down payment
- $39,750
- Closing costs
- $4,770
- Reserves months
- —
- Total cash needed
- —
Loan-product check · same deal, 3 products live
Conventional
25% down · 7.5% · 30yr
- Down + closing
- —
- Monthly P&I
- —
- Monthly cashflow
- —
- DSCR
- —
- Eligible?
- —
Personal DTI + credit; lowest rate.
DSCR
20% down · 8.5% · 30yr
- Down + closing
- —
- Monthly P&I
- —
- Monthly cashflow
- —
- DSCR
- —
- Eligible?
- —
No personal income docs; deal must DSCR.
Hard money
10% down · 12.0% · 12mo
- Down + closing
- —
- Monthly P&I
- —
- Monthly cashflow
- —
- DSCR
- —
- Eligible?
- —
Short-term bridge; refi at stabilization.
Rent comps 20 comps
| Address | Beds | Baths | Sqft | Rent | $/sqft | DOM | Units | Dist |
|---|---|---|---|---|---|---|---|---|
| 707 SE Loop 410 San Antonio, TX | 1.0–4.0 | 1.0–2.0 | 1139 | $1,216 | $1.07 | 4d | 1 | 0.26mi |
| 4606 Hollyspring Dr San Antonio, TX | 3.0 | 2.0 | 1098 | $1,400 | $1.28 | 23d | 1 | 0.56mi |
| 4835 Lord Rd Unit 710 San Antonio, TX | 2.0 | 2.0 | 949 | $874 | $0.92 | 2d | 1 | 0.57mi |
| 4611 E Houston St San Antonio, TX | 2.0–4.0 | 2.0 | 1286 | $1,290 | $1.00 | 1d | 23 | 0.59mi |
| 4610 Lavender Ln San Antonio, TX | 3.0 | 2.0 | 1337 | $1,400 | $1.05 | 23d | 1 | 0.59mi |
| 2906 Lavender Ln San Antonio, TX | 3.0 | 2.5 | 1247 | $1,595 | $1.28 | 16d | 1 | 0.77mi |
| 4319 Algruth Dr San Antonio, TX | 3.0 | 2.0 | 1021 | $1,800 | $1.76 | 23d | 1 | 0.94mi |
| 302 Kenmar Dr San Antonio, TX | 3.0 | 1.0 | 970 | $1,375 | $1.42 | 23d | 1 | 1.01mi |
| 4426 N Hein Rd Apt 2204 San Antonio, TX | 2.0 | 1.0 | 723 | $1,250 | $1.73 | 43d | 1 | 1.04mi |
| 334 Tomrob Dr San Antonio, TX | 3.0 | 1.0 | 1064 | $1,300 | $1.22 | 14d | 1 | 1.11mi |
| 4326 Spring Oak Dr San Antonio, TX | 3.0 | 1.0 | 1168 | $1,300 | $1.11 | 23d | 1 | 1.12mi |
| 5847 Tree View St San Antonio, TX | 3.0 | 2.0 | 1362 | $1,900 | $1.40 | 17d | 1 | 1.12mi |
| 368 Readwell Dr San Antonio, TX | 3.0 | 1.0 | 1067 | $1,200 | $1.12 | 43d | 1 | 1.16mi |
| 4938 Bernadine Dr San Antonio, TX | 3.0 | 2.0 | 1078 | $2,000 | $1.86 | 23d | 1 | 1.19mi |
| 4519 Creekmoor Dr San Antonio, TX | 3.0 | 2.0 | 1239 | $1,395 | $1.13 | 11d | 1 | 1.35mi |
| 262 Orchard Rd San Antonio, TX | 3.0 | 1.0 | 1134 | $1,250 | $1.10 | 43d | 1 | 1.35mi |
| 4251 Wild Oak Dr San Antonio, TX | 4.0 | 1.0 | 1117 | $1,250 | $1.12 | 43d | 1 | 1.37mi |
| 4619 Dietrich Rd San Antonio, TX | 1.0–3.0 | 1.0–1.5 | 775 | $999 | $1.29 | 43d | 1 | 1.49mi |
| 1311 W Hein Rd Unit 18 San Antonio, TX | 2.0 | 1.5 | 900 | $895 | $0.99 | 43d | 1 | 1.50mi |
| 1311 W Hein Rd Unit 4 San Antonio, TX | 2.0 | 2.0 | 1000 | $1,000 | $1.00 | 43d | 1 | 1.50mi |
Listing history 20 events
-
2026-06-18days on market $158,999 Active 264 DOM
-
2026-06-17days on market $158,999 Active 263 DOM
-
2026-06-16days on market $158,999 Active 262 DOM
-
2026-06-15days on market $158,999 Active 261 DOM
-
2026-06-13days on market $158,999 Active 259 DOM
-
2026-06-09days on market $158,999 Active 255 DOM
-
2026-06-08days on market $158,999 Active 254 DOM
-
2026-06-07days on market $158,999 Active 253 DOM
-
2026-06-04days on market $158,999 Active 250 DOM
-
2026-06-03days on market $158,999 Active 249 DOM
-
2026-06-02days on market $158,999 Active 248 DOM
-
2026-06-01days on market $158,999 Active 247 DOM
-
2026-05-31days on market $158,999 Active 246 DOM
-
2026-04-10price $158,999 861-char remark
Show marketing remark (861 chars)
Welcome to 302 Glenbrook, a charming single-story home located in the quiet East Houston Estates community. This 3-bedroom, 1-bath residence offers approximately 1,050 sq. ft. of living space on a spacious 1/4-acre lot, giving you plenty of room to enjoy both indoors and out. Inside, you'll find a practical floor plan with a bright living area, cozy bedrooms, and a functional kitchen ready for your personal touch. Central heating and cooling ensure year-round comfort. The large backyard provides endless possibilities! Whether you envision a garden, outdoor entertaining space, or future expansion. A convenient carport offers covered parking. This home is perfect for first-time buyers, downsizers, or investors looking for a solid property with great potential. Don't miss this opportunity to own an affordable home with space to grow in San Antonio!
-
2026-04-09status Back on Market 861-char remark
Show marketing remark (861 chars)
Welcome to 302 Glenbrook, a charming single-story home located in the quiet East Houston Estates community. This 3-bedroom, 1-bath residence offers approximately 1,050 sq. ft. of living space on a spacious 1/4-acre lot, giving you plenty of room to enjoy both indoors and out. Inside, you'll find a practical floor plan with a bright living area, cozy bedrooms, and a functional kitchen ready for your personal touch. Central heating and cooling ensure year-round comfort. The large backyard provides endless possibilities! Whether you envision a garden, outdoor entertaining space, or future expansion. A convenient carport offers covered parking. This home is perfect for first-time buyers, downsizers, or investors looking for a solid property with great potential. Don't miss this opportunity to own an affordable home with space to grow in San Antonio!
-
2026-04-01historical 861-char remark
Show marketing remark (861 chars)
Welcome to 302 Glenbrook, a charming single-story home located in the quiet East Houston Estates community. This 3-bedroom, 1-bath residence offers approximately 1,050 sq. ft. of living space on a spacious 1/4-acre lot, giving you plenty of room to enjoy both indoors and out. Inside, you'll find a practical floor plan with a bright living area, cozy bedrooms, and a functional kitchen ready for your personal touch. Central heating and cooling ensure year-round comfort. The large backyard provides endless possibilities! Whether you envision a garden, outdoor entertaining space, or future expansion. A convenient carport offers covered parking. This home is perfect for first-time buyers, downsizers, or investors looking for a solid property with great potential. Don't miss this opportunity to own an affordable home with space to grow in San Antonio!
-
2025-09-19$159,999 New 861-char remark
Show marketing remark (861 chars)
Welcome to 302 Glenbrook, a charming single-story home located in the quiet East Houston Estates community. This 3-bedroom, 1-bath residence offers approximately 1,050 sq. ft. of living space on a spacious 1/4-acre lot, giving you plenty of room to enjoy both indoors and out. Inside, you'll find a practical floor plan with a bright living area, cozy bedrooms, and a functional kitchen ready for your personal touch. Central heating and cooling ensure year-round comfort. The large backyard provides endless possibilities! Whether you envision a garden, outdoor entertaining space, or future expansion. A convenient carport offers covered parking. This home is perfect for first-time buyers, downsizers, or investors looking for a solid property with great potential. Don't miss this opportunity to own an affordable home with space to grow in San Antonio!
-
2021-06-30soldstatus
-
1999-04-27soldstatus
-
1990-02-01soldstatus
ⓘ Source: listings_history table (triggers on properties + properties_extension) + one-shot
backfill from property_details.listing_events for pre-trigger history.
Tax reassessment forecast TX · Resets to sale price
- Current annual tax
- $2,516 · $210/mo
- Projected year-2 tax
- $2,910 · $242/mo
- Expected delta
- +$394/yr (+$33/mo · 15.7%)
ⓘ Screening estimate from a state-policy table — verify with the county assessor before closing.
Climate risk First Street
- Flood 1/10 Low FEMA zone X (unshaded) · 0% chance over 30 yrs
- Wildfire 3/10 Moderate
- Heat 8/10 Severe 7 d/yr ≥108°F today · 22 d/yr by 30 yrs out
- Wind 8/10 Severe 80% chance of damaging wind over 30 yrs
- Air quality 2/10 Low 0 unhealthy d/yr today · 2 by 30 yrs out
Nearby sold comps map
Loading sold comps map…
Walkable amenities ~0.75 mi
Loading nearby amenities…
Taxation est. · year 1
- Rental income
- $16,796
- − Mortgage interest
- −$8,906
- − Property taxes
- −$2,516
- − Insurance
- −$795
- − Repairs & maintenance
- −$1,344
- − Management
- −$1,344
- − Depreciation
- −$4,625
- Taxable loss
- −$2,734
- Est. tax savings @ 24.0%
- +$656
- After-tax cash flow
- $609/yr
For passive investors: Depreciation is non-cash, so a rental often shows a tax loss while cash-flowing — sheltering income. Rental losses are passive: they offset passive income freely, and up to $25,000/yr can offset ordinary (W-2) income if you actively participate and your MAGI is under $100k (phasing out to $0 by $150k); unused losses carry forward. On sale, claimed depreciation is recaptured at up to 25%, and gains may owe capital-gains tax (a 1031 exchange can defer both). Figures are a year-1 estimate at your 24.0% rate — not tax advice; consult a CPA.
Schools (NCES district)
- District
- San Antonio ISD
- NCES district ID
- 4838730
- Math proficiency
- 12% ▼ -21.00%
- Reading proficiency
- 22% ▼ -7.00%
- Median HH income
- $30,952
- Composite
- 13.57/100
- National rank
- #9512
- State rank
- #805 of 826 in TX
Livability — San Antonio
- Score
- 80/100
- State rank
- #31
- US rank
- #1616
Category grades
Schools grade is shown separately in the Schools card above.
Census & demographics
- Census place
- San Antonio, TX
- County
- Bexar County · 1,990,555 people
- City population
- 1,806,925
- Metro
- San Antonio-New Braunfels, TX
- Population (ZIP)
- 19,423
- Household income
- $41,710
- Rent vs Own
- Severe rent burden
- 705.0
Population outlook (Bexar County) Hauer SSP2
- Today (2025)
- 2,336,851 people
- By 2030
- 2,560,728 · +9.6%
- By 2040
- 3,020,569 · +29.3%
- By 2050
- 3,493,522 · +49.5%
- By 2075
- 4,668,459 · +99.8%
- By 2100
- 5,533,242 · +136.8%
Race, ethnicity, and origin ACS 2023
- Neighborhood character
- Majority Hispanic (60%)
- Race & ethnicity
- Hispanic / Latino 60% Black 30% Two or more races 22% White 8%
- Hispanic origin (detail)
- Mexican 47% Puerto Rican 1%
- Foreign-born
- 11% · Canada
- Languages at home
- 63% English-only · Spanish 36%
Political lean MEDSL · Bexar
- 2024 margin
- Lean D (+9.8) · D 54.3% · R 44.6% · Other 1.1%
- 2008→2024 swing
- +4.2pp toward D · 2008: 5.6pp · 2024: 9.8pp
- All cycles
- 2024: D+9.8 2020: D+18.2 2016: D+13.5 2012: D+4.6 2008: D+5.6
Not yet ingested
- Civics
- —
Market trends
- HPI YoY
- ▲ 23.86%
- Current HPI
- 284.9844
- Rent YoY
- ▲ 0.53%
- Metro
- San Antonio-New Braunfels, TX
- State GDP YoY
- ▲ 3.95%
- F500 in state
- 110
Industry mix (Fortune 500 HQ in TX)
| Industry | F500 HQs | Revenue |
|---|---|---|
| Energy | 16 | $1,198B |
|
||
| Technology | 5 | $198B |
|
||
| Engineering / Construction | 4 | $72B |
|
||
| Energy Services | 3 | $60B |
|
||
| Utilities | 3 | $41B |
|
||
| Healthcare | 2 | $330B |
|
||
Price history
-0.6% since first listed7 events — show timeline
- 2026-04-10 Price Changed $158,999 LERA
- 2026-04-09 Relisted — LERA
- 2026-04-01 Listing Removed — LERA
- 2025-09-19 Listed $159,999 LERA
- 2021-06-30 Sold (Public Records) — Public Records
- 1999-04-27 Sold (Public Records) — Public Records
- 1990-02-01 Sold (Public Records) — Public Records
Property tax history
+4.9%/yrLatest (2025): $2,516 · +10.0% YoY. Source: county tax records.
Cash-flow waterfall
monthlySold comps — $/sqft
last 12 mo · ≤1 miLoading sold comps…