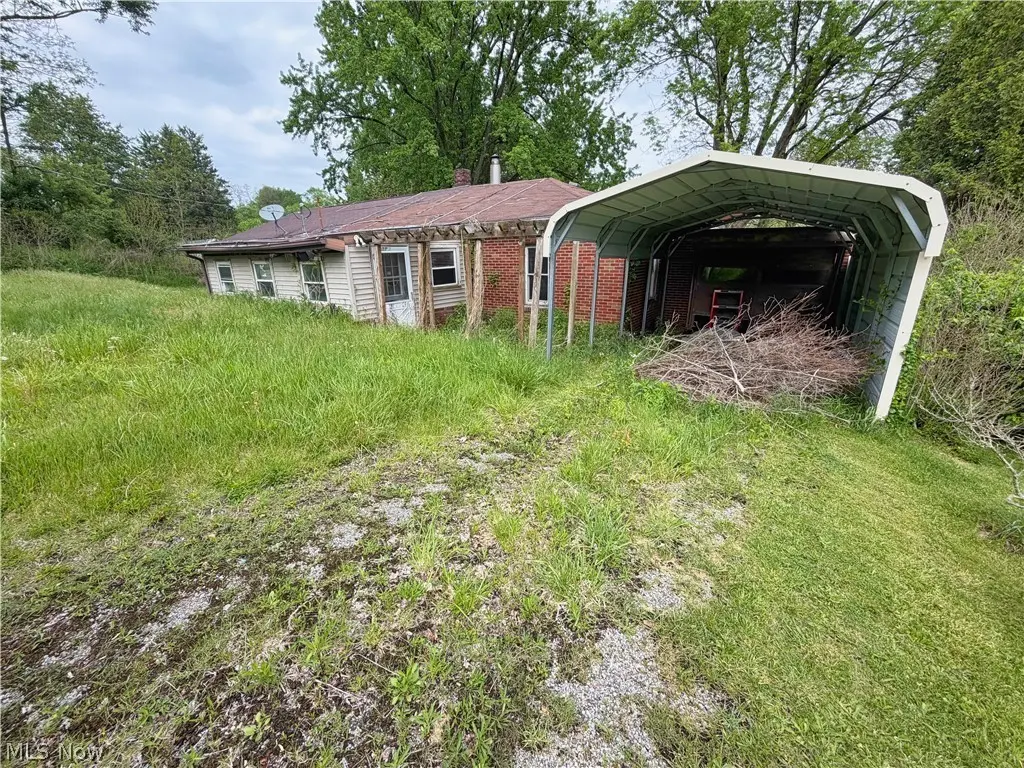
16816 Andrews Ave · East Liverpool, OH
Flood risk 1/10 · Minimal
- FEMA flood zone
- X (unshaded)
- Chance of flooding over 30 yrs
- 0.0%
- Est. flood insurance / yr
- $473 – $860
Fire risk 1/10 · Minimal
- Est. fire insurance / yr
- $713 – $1,323
Heat risk 3/10 · Minor
- Hot days now (above 97°F)
- 7 days/yr
- Hot days in 30 yrs
- 17 days/yr
Wind risk 1/10 · Minimal
- Chance of severe wind over 30 yrs
- —
Air-quality risk 2/10 · Minimal
- Unhealthy air days now
- 1 days/yr
- Unhealthy air days in 30 yrs
- 2 days/yr
Risk factors via First Street. Map © Google.
Why this score? — see what drove the B grade
The composite is a weighted blend of 9 inputs, each scored 0–100. Each bar is that input's sub-score; the figure is the points it added to the 100-point composite (weight × sub-score).
- Cash flow +30.0/30.0
- 1% rule +10.0/10.0
- DSCR +10.0/10.0
- ARV discount +7.5/15.0
- Schools +5.4/10.0
- Livability +3.4/5.0
- Rent growth +2.5/5.0
- Condition / age +2.5/5.0
- Appreciation +0.0/10.0
$28,900
🖨 Deal sheet 📄 Offer letter ✓ Due diligence
Key facts
- 1 acre lot
- Garage
- Built 1951
Property features AI
Exterior
- Parking: Attached or detached garage with 1 car space
- Utilities: Public water; Public sewer
- Home design: Single-story; Fixer condition
- Construction: Vinyl siding construction; Built per public records
- Exterior features: Vinyl siding; Driveway (unpaved)
Interior
- Bedrooms: 2 main-level bedrooms
- Bathrooms: 1 full bathroom (main level)
- Interior features: Partial basement
Neighborhood map
What this means for you Summary
Snapshot
- This is a 2-bed/2.0-bath single-family listed at $29k.
Deal economics
- At list price, monthly cash flow is $634 ($8k/yr) — positive.
- The deal already cash-flows at list — no discount required.
- Meets the 1% rule at list price ($1k rent vs $29k).
- Recommended offer: $28k (3.0% below list) — sets the bar for market timing.
- Cap rate 32.6% vs local median 9.8% in East Liverpool — top-decile yield for the area; either an underpriced asset or a hidden risk that comps aren't pricing in. Stress-test before assuming the spread holds.
Location & tenants
- Location reads 67/100 on livability (#613 in OH) — a middle-class / working-renter tenant base. Strengths: cost of living A+, housing A+, health & safety A+; Watch: amenities F, commute F, employment F.
- Beaver Local (rural): math 66% / reading 61% proficiency, ranked #237 of 656 in OH (top 36%) — acceptable for families but not a draw, mixed tenant base, ~2y average lease.
- Market conditions: 114 active listings in the ZIP; 49 units permitted in Columbiana County in 2024 (0 in 5+ unit buildings).
Forward outlook
- Local home prices are declining (-3.0%/yr); year-one equity from $200 of loan paydown is wiped out by about $867 of value loss. Plan a longer hold.
- Columbiana County population projected at -23% by 2050 — secular population decline; favor cash flow + early exit over multi-decade hold.
- At projected returns (-3.0% appreciation + 3.0% rent growth), your $8k cash investment doubles in ~2 years — after that, you're playing with house money.
Negotiation context
- It's been on market 42 days — a 3% lower offer ($28k) is reasonable based on typical stale-listing flexibility.
- 4 sale attempts since 3y ago with the ask held roughly flat each time — persistent listings suggest the price (not the market) is what's stuck; bring a comps-based counter.
Risks & watch-outs
- Watch-outs: built in 1951 — expect roof / HVAC / electrical / plumbing capex.
Questions for the listing agent
- It's been on market 42 days. Have you received any prior offers? Is the seller open to a 3% concession, seller financing, or rate buy-down credit?
- Built in 1951 — when were the roof, HVAC, electrical panel, plumbing, and water heater last replaced?
- Is there a deadline driving the sale (1031 exchange, divorce, estate, relocation)? That informs how much negotiation room exists.
- What's the average days-on-market for RENTAL listings here right now (not sales)? A rising rental-DOM trend means longer vacancies and softer asking-rent achievability than the comps imply.
- What's the recent tenant-quality profile in this submarket — average credit score on applications, eviction rate, late-payment / NSF rate, and stable-employment percentage? A property-management company in the area should have these aggregated.
- How much new for-sale + rental construction is in the pipeline within 1–3 miles? Heavy new supply typically softens prices + rents 12–24 months out; constrained supply supports both.
Investment metrics
- 1% rule
- 3.65% ✓
- Cap rate
- 32.62%
- Cash-on-cash
- 94.02%
- DSCR
- 5.18
- GRM
- 2.3
CMA / ARV
- ARV (median comp)
- $207,161
- List price
- $28,900
- Delta
- -86.05%
- Verdict
- UNDERPRICED
- Comps
- 20 within 1.0 mi
Show comp detail 6 sales within ~0.75 mi
| Address | Dist | Beds/Ba | Sqft | Sold | Price | $/sf | Match |
|---|---|---|---|---|---|---|---|
| 1130 Dairy Ln | 0.55mi | 3/2.5 (+1) | 1,827 (-0%) | 10mo | $260,000 | $142 | 59 |
| 3120 Curry St | 0.43mi | 3/2.0 (+1) | 1,829 (-0%) | 20mo | $232,500 | $127 | 58 |
| 1116 Dairy Ln | 0.57mi | 3/2.5 (+1) | 1,920 (+5%) | 2mo | $290,000 | $151 | 57 |
| 421 Watterson St | 0.57mi | 3/1.5 (+1) | 1,800 (-2%) | 17mo | $245,000 | $136 | 49 |
| 701 Mayberry Ln | 0.56mi | 3/1.5 (+1) | 1,706 (-7%) | 12mo | $180,000 | $106 | 45 |
| 3170 Hampton Ct | 0.73mi | 3/2.5 (+1) | 1,960 (+7%) | 5mo | $285,000 | $145 | 44 |
Match score weights: distance 35% · size 25% · config 20% · recency 20%. Top-matched comps best support the ARV.
Projected returns pro-forma
-3.0% appreciation · 3.0% rent growth · sell at horizon
- IRR
- 94.9%
- Equity multiple
- 5.41×
- Total profit
- $35,714
- Equity at exit
- $4,309
- IRR
- 97.6%
- Equity multiple
- 11.28×
- Total profit
- $83,160
- Equity at exit
- $2,499
Cash invested: $8,092 (down + closing). Projections, not guarantees.
Landlord ↔ Tenant lean methodology
- Overall (STATE)
- 73 Landlord-Friendly
- State Ohio
- 73 Landlord-Friendly · R+6
- County
- — inherits STATE
- City
- — inherits STATE
ZIP-level market 43920
- Home prices YoY
- -29.3%
- Active inventory
- 114
- Price-to-rent
- 2.3×
Monthly cashflow live
- Estimated rent
- $1,055 medium interval (Pro) →
- Mortgage (P&I)
- −$152
- Tax est. 1.5%
- −$36 /mo · $434/yr
- Insurance
- −$12
- HOA
- −$0
- Vacancy / Maint / Mgmt
- −$222
- Net cashflow
- $634
Break-even live
Sensitivity live
| Price | -10% $654 | -5% $644 | +0% $634 | +5% $624 | +10% $614 |
|---|---|---|---|---|---|
| Rent | -10% $551 | -5% $592 | +0% $634 | +5% $676 | +10% $717 |
| Rate | -1.0pp $649 | -0.5pp $641 | base $634 | +0.5pp $627 | +1.0pp $619 |
UW: 25.0% down · 7.5% · 30yr · 1.5% tax · 5.0% vac · 8.0% maint · 8.0% mgmt
Financing live
Cash to close
- Down payment
- $7,225
- Closing costs
- $867
- Reserves months
- —
- Total cash needed
- —
Loan-product check · same deal, 3 products live
Conventional
25% down · 7.5% · 30yr
- Down + closing
- —
- Monthly P&I
- —
- Monthly cashflow
- —
- DSCR
- —
- Eligible?
- —
Personal DTI + credit; lowest rate.
DSCR
20% down · 8.5% · 30yr
- Down + closing
- —
- Monthly P&I
- —
- Monthly cashflow
- —
- DSCR
- —
- Eligible?
- —
No personal income docs; deal must DSCR.
Hard money
10% down · 12.0% · 12mo
- Down + closing
- —
- Monthly P&I
- —
- Monthly cashflow
- —
- DSCR
- —
- Eligible?
- —
Short-term bridge; refi at stabilization.
Listing history 29 events
-
2026-06-18days on market $28,900 Active 42 DOM
-
2026-06-17days on market $28,900 Active 41 DOM
-
2026-06-16days on market $28,900 Active 40 DOM
-
2026-06-15days on market $28,900 Active 39 DOM
-
2026-06-13days on market $28,900 Active 37 DOM
-
2026-06-09days on market $28,900 Active 33 DOM
-
2026-06-08days on market $28,900 Active 32 DOM
-
2026-06-07days on market $28,900 Active 31 DOM
-
2026-06-05days on market $28,900 Active 28 DOM
-
2026-06-03days on market $28,900 Active 27 DOM
-
2026-06-02days on market $28,900 Active 26 DOM
-
2026-06-01days on market $28,900 Active 25 DOM
-
2026-05-31days on market $28,900 Active 24 DOM
-
2026-05-05$28,900 Active 14-char remark
-
2024-10-20historical
-
2024-10-03historical Contingent
-
2024-08-20price $39,900
-
2024-07-31price $44,900
-
2024-06-29price $49,900
-
2024-06-12price $55,000
-
2024-05-28$59,000 Active
-
2023-06-01historical
-
2023-05-06status Active
-
2023-04-17status Pending
-
2023-03-27price $49,900
-
2023-03-04price $54,900
-
2023-01-24price $59,999
-
2023-01-04$69,000 Active
-
1998-07-08soldstatus $46,000
ⓘ Source: listings_history table (triggers on properties + properties_extension) + one-shot
backfill from property_details.listing_events for pre-trigger history.
Climate risk First Street
- Flood 1/10 Low FEMA zone X (unshaded) · 0% chance over 30 yrs
- Wildfire 1/10 Low
- Heat 3/10 Moderate 7 d/yr ≥97°F today · 17 d/yr by 30 yrs out
- Wind 1/10 Low
- Air quality 2/10 Low 1 unhealthy d/yr today · 2 by 30 yrs out
Nearby sold comps map
Loading sold comps map…
Walkable amenities ~0.75 mi
Loading nearby amenities…
Taxation est. · year 1
- Rental income
- $12,664
- − Mortgage interest
- −$1,619
- − Property taxes
- −$434
- − Insurance
- −$144
- − Repairs & maintenance
- −$1,013
- − Management
- −$1,013
- − Depreciation
- −$841
- Taxable income
- $7,600
- Est. tax owed @ 24.0%
- −$1,824
- After-tax cash flow
- $5,784/yr
For passive investors: Depreciation is non-cash, so a rental often shows a tax loss while cash-flowing — sheltering income. Rental losses are passive: they offset passive income freely, and up to $25,000/yr can offset ordinary (W-2) income if you actively participate and your MAGI is under $100k (phasing out to $0 by $150k); unused losses carry forward. On sale, claimed depreciation is recaptured at up to 25%, and gains may owe capital-gains tax (a 1031 exchange can defer both). Figures are a year-1 estimate at your 24.0% rate — not tax advice; consult a CPA.
Schools (NCES district)
- District
- Beaver Local
- NCES district ID
- 3904642
- Math proficiency
- 66% ▼ -9.00%
- Reading proficiency
- 61% ▼ -9.00%
- Median HH income
- $49,304
- Composite
- 53.94/100
- National rank
- #1402
- State rank
- #237 of 656 in OH
Livability — East Liverpool
- Score
- 67/100
- State rank
- #613
- US rank
- #10580
Category grades
Schools grade is shown separately in the Schools card above.
Census & demographics
- County
- Columbiana · 99,532 people
- Population (ZIP)
- 21,124
- Household income
- $50,820
- Rent vs Own
- Severe rent burden
- 12.6
Population outlook (Columbiana County) Hauer SSP2
- Today (2025)
- 98,353 people
- By 2030
- 94,225 · -4.2%
- By 2040
- 85,169 · -13.4%
- By 2050
- 76,157 · -22.6%
- By 2075
- 58,451 · -40.6%
- By 2100
- 42,805 · -56.5%
Race, ethnicity, and origin ACS 2023
- Neighborhood character
- Predominantly White (90%)
- Race & ethnicity
- White 90% Two or more races 6% Black 3% Hispanic / Latino 1%
- Common ancestry
- Romanian 2% Slovak 2% Serbian 2%
- Foreign-born
- 0%
Political lean MEDSL · Columbiana
- 2024 margin
- Solid R (+49.0) · D 25.1% · R 74.1%
- 2008→2024 swing
- -41.4pp toward R · 2008: -7.6pp · 2024: -49.0pp
- All cycles
- 2024: R+49.0 2020: R+44.9 2016: R+41.6 2012: R+12.0 2008: R+7.6
Not yet ingested
- Civics
- —
Market trends
- HPI YoY
- ▼ -81.53%
- Current HPI
- 196.3908
- Rent YoY
- —
- Metro
- —
- State GDP YoY
- ▲ 1.98%
- F500 in state
- 48
Industry mix (Fortune 500 HQ in OH)
| Industry | F500 HQs | Revenue |
|---|---|---|
| Insurance | 3 | $145B |
|
||
| Industrial Machinery | 3 | $49B |
|
||
| Financial Services | 3 | $24B |
|
||
| Consumer Goods | 2 | $93B |
|
||
| Aerospace / Defense | 2 | $47B |
|
||
| Utilities | 2 | $33B |
|
||
Price history
-37.2% since first listed16 events — show timeline
- 2026-05-05 Listed $28,900 MLSNOW
- 2024-10-20 Listing Removed — MLSNOW
- 2024-10-03 Contingent — MLSNOW
- 2024-08-20 Price Changed $39,900 MLSNOW
- 2024-07-31 Price Changed $44,900 MLSNOW
- 2024-06-29 Price Changed $49,900 MLSNOW
- 2024-06-12 Price Changed $55,000 MLSNOW
- 2024-05-28 Listed $59,000 MLSNOW
- 2023-06-01 Listing Removed — MLSNOW
- 2023-05-06 Relisted — MLSNOW
- 2023-04-17 Pending — MLSNOW
- 2023-03-27 Price Changed $49,900 MLSNOW
- 2023-03-04 Price Changed $54,900 MLSNOW
- 2023-01-24 Price Changed $59,999 MLSNOW
- 2023-01-04 Listed $69,000 MLSNOW
- 1998-07-08 Sold (Public Records) $46,000 Public Records
Property tax history
+4.3%/yrLatest (2025): $2,351 · +12.4% YoY. Source: county tax records.
Cash-flow waterfall
monthlySold comps — $/sqft
last 12 mo · ≤1 miLoading sold comps…