 Duplex
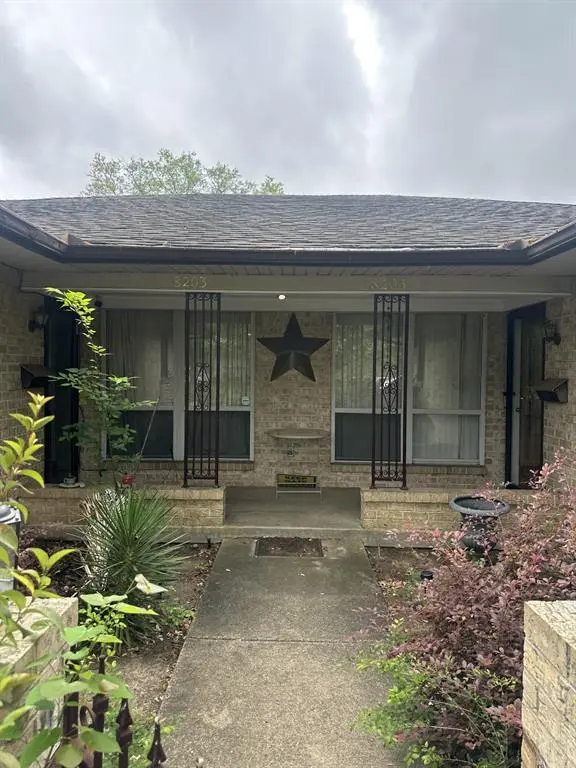
8203 Lullwater Dr · Dallas, TX
Flood risk 1/10 · Minimal
- FEMA flood zone
- X (unshaded)
- Chance of flooding over 30 yrs
- 0.0%
- Est. flood insurance / yr
- $507 – $1,088
Fire risk 1/10 · Minimal
- Est. fire insurance / yr
- $1,222 – $2,270
Heat risk 7/10 · Major
- Hot days now (above 109°F)
- 7 days/yr
- Hot days in 30 yrs
- 23 days/yr
Wind risk 6/10 · Moderate
- Chance of severe wind over 30 yrs
- 27.0%
Air-quality risk 3/10 · Minor
- Unhealthy air days now
- 3 days/yr
- Unhealthy air days in 30 yrs
- 3 days/yr
Risk factors via First Street. Map © Google.
Why this score? — see what drove the D grade
The composite is a weighted blend of 9 inputs, each scored 0–100. Each bar is that input's sub-score; the figure is the points it added to the 100-point composite (weight × sub-score).
- ARV discount +15.0/15.0
- Cash flow +8.8/30.0
- Livability +4.0/5.0
- 1% rule +2.9/10.0
- Schools +2.8/10.0
- Rent growth +2.5/5.0
- Condition / age +2.5/5.0
- DSCR +2.4/10.0
- Appreciation +0.0/10.0
$450,000
🖨 Deal sheet (PDF) 📄 Offer letter ✓ Due diligence
Multi-family units
County records classify this as Multi-Family (2-4 Unit). Listing-text estimate: 2 units. confirmed
Listing remarks MLS
Fantastic investment property! Almost 4000 sf duplex in Lake Highlands. This property has been well-maintained 1 unit @1432 sf is 2/2 2/an open kit to the family rm. Mstr has sep bath w/ huge WIC. Nice cov. patio w/ sm back yard. Larger unit @2422sf is a 3/3 w/ 2 fam. rms. Mstr & upstairs bdrm have
Key facts
- Spacious layouts
- Full duplex
- 0.26 acre lot
Tags
Property features AI
Finance
- Other: Two buildings with a total of 2 units
- Financial info: Property listed as residential income with duplex sub-type; Gross annual income: 66,660; Gross annual expenses: 15,833; Insurance expense: 2,747; Net operating income: 48,080; Capitalization rate: 10.68%
- HOA & community: No association
Exterior
- Parking: Attached garage facing rear (2 covered spaces, 2 total spaces)
- Security: Smoke detector(s)
- Utilities: City water; City sewer; Curbs; Concrete
- Home design: Duplex (residential income); One story
- Construction: Built in 1968; Brick and siding construction; Composition roof; Pillar/post/pier foundation
- Exterior features: Covered porch(es); Front covered porch; Gutters; Wood fencing; Few trees; Interior lot; Landscaped
Interior
- Kitchen: Dishwasher; Disposal; Electric cooktop; Electric oven
- Flooring: Carpet; Ceramic tile; Vinyl
- Heating & cooling: Central air; Ceiling fans; Electric cooling; Space heater
- Interior features: Eat-in kitchen; High-speed internet available; Skylights
Neighborhood map
What this means for you Summary
Snapshot
- This is a 1×2bd/2ba + 1×3bd/1ba units multifamily listed at $450k.
Deal economics
- At list price, monthly cash flow is $-368 ($-4k/yr) — negative. Per door: $-184/mo.
- To cash-flow at today's rent, offer at most $385k (14.4% below list).
- To meet the 1% rule (rent ≥ 1% of price), the offer needs to be $356k (21.0% below list).
- Recommended offer: $356k (21.0% below list) — sets the bar for 1% rule.
- Cap rate 5.3% vs local median 2.3% in Dallas — top-decile yield for the area; either an underpriced asset or a hidden risk that comps aren't pricing in. Stress-test before assuming the spread holds.
Location & tenants
- Location reads 81/100 on livability (#24 in TX, #1,380 nationally) — a professional / high-income tenant draw. Strengths: amenities A+, commute A+, housing A+; Watch: crime F.
- Dallas ISD (urban): math 31% / reading 36% proficiency, ranked #559 of 826 in TX (top 68%) — families likely to look elsewhere, expect single-tenant / working-renter base with shorter leases; 83% free/reduced lunch — lower-income household profile, screen leases tightly.
- Zoned schools: Victor H Hexter El (math 45% / reading 58%, grade C-, #808 of 4,322 statewide, top 19%, 441 students, 51% FRL); Robert T Hill Middle (math 21% / reading 28%, grade F, #1,279 of 1,662 statewide, top 78%, 803 students, 87% FRL); Bryan Adams H S Leadership Academy (math 41% / reading 41%, grade F, #774 of 1,632 statewide, top 49%, 2,271 students, 89% FRL).
- Market conditions: Rents soft (-0.2%/yr); 186 active listings in the ZIP; 20 comparable units currently listed for rent nearby; rentals leasing fast (median 10d on market — plan ~1-2 weeks tenant-placement turnaround); solid renter incomes; 12,577 units permitted in Dallas County in 2024 (6,829 in 5+ unit buildings).
- This rent runs 40% of the median local income ($107k/yr) — at the standard rent-burdened threshold; future hikes will face affordability resistance.
Forward outlook
- Local home prices are declining (-3.0%/yr); year-one equity from $3k of loan paydown is wiped out by about $14k of value loss. Plan a longer hold.
- Dallas County population projected at +35% by 2050 — long-run rental-demand tailwind backs the buy-and-hold thesis.
Negotiation context
- Only 7 days on market — expect competitive offers; lowballing is unlikely to land.
- 2 sale attempts since 22y ago with the ask held roughly flat each time — persistent listings suggest the price (not the market) is what's stuck; bring a comps-based counter.
Risks & watch-outs
- Climate carrying-cost: major wind risk, 27% chance of damaging wind over 30y; extreme-heat days projected 7→23/yr by 2055 (HVAC capex compounding) — expect insurance premiums to compound above CPI over the hold.
Questions for the listing agent
- What do current leases actually rent for vs. the listed asking? Can we see a recent rent roll and the last 12 months of T-12 income?
- Can we see the unit-by-unit rent roll, current vacancy, and any below-market leases? What's the average tenancy length?
- What capital expenditures (roof, boiler, parking lot, exteriors) have been made in the last 5 years, and what's planned in the next 2?
- Built in 1968 — when were the roof, HVAC, electrical panel, plumbing, and water heater last replaced?
- Is there a deadline driving the sale (1031 exchange, divorce, estate, relocation)? That informs how much negotiation room exists.
- Crime grade is F in this area — have there been break-ins, vandalism, or insurance claims at this property in the last 3 years? What carrier currently insures it and at what premium?
- The area grade is low — what's the realistic commute time and amenity access for the typical tenant pool here? Any planned neighborhood developments (good or bad) we should know about?
- What's the average days-on-market for RENTAL listings here right now (not sales)? A rising rental-DOM trend means longer vacancies and softer asking-rent achievability than the comps imply.
- What's the recent tenant-quality profile in this submarket — average credit score on applications, eviction rate, late-payment / NSF rate, and stable-employment percentage? A property-management company in the area should have these aggregated.
- How much new apartment / multifamily construction is in the pipeline within 1–3 miles? Heavy new supply (>2% of stock underway) typically softens rents 12–24 months out; light construction supports rent growth.
Investment metrics
- 1% rule
- 0.79% ✗
- Cap rate
- 5.31%
- Cash-on-cash
- -3.50%
- DSCR
- 0.84
- GRM
- 10.5
CMA / ARV
- ARV (median comp)
- $554,483
- List price
- $450,000
- Delta
- -18.84%
- Verdict
- UNDERPRICED
- Comps
- 14 within 1.0 mi
Projected returns pro-forma
-3.0% appreciation · 0.0% rent growth · sell at horizon
- IRR
- -25.6%
- Equity multiple
- 0.15×
- Total profit
- $-106,660
- Equity at exit
- $67,096
- IRR
- -35.9%
- Equity multiple
- -0.29×
- Total profit
- $-162,915
- Equity at exit
- $38,908
Cash invested: $126,000 (down + closing). Projections, not guarantees.
Landlord ↔ Tenant lean methodology
- Overall (STATE)
- 87 Strongly Landlord-Friendly
- State Texas
- 87 Strongly Landlord-Friendly · R+5
- County
- — inherits STATE
- City
- — inherits STATE
ZIP-level market 75218
- Rents YoY
- -0.2%
- Active inventory
- 186
- Price-to-rent
- 21.9×
Monthly cashflow live
- Estimated rent
- $3,556 high interval (Pro) →
- Mortgage (P&I)
- −$2,360
- Tax from tax record
- −$630 /mo · $7,554/yr
- Insurance
- −$188
- HOA
- −$0
- Vacancy / Maint / Mgmt
- −$747
- Net cashflow
- $-368
Break-even live
Sensitivity live
| Price | -10% $-113 | -5% $-240 | +0% $-368 | +5% $-495 | +10% $-622 |
|---|---|---|---|---|---|
| Rent | -10% $-649 | -5% $-508 | +0% $-368 | +5% $-227 | +10% $-87 |
| Rate | -1.0pp $-141 | -0.5pp $-253 | base $-368 | +0.5pp $-484 | +1.0pp $-603 |
2-unit breakdown (identical units grouped — click to expand)
| Units | Beds | Baths | Est. rent |
|---|---|---|---|
| 1× unit | 2 | 2 | $1,711 |
| 1× unit | 3 | 1 | $1,845 |
| Total (2 units) | $3,556 | ||
UW: 25.0% down · 7.5% · 30yr · 1.5% tax · 5.0% vac · 8.0% maint · 8.0% mgmt
Financing live
Cash to close
- Down payment
- $112,500
- Closing costs
- $13,500
- Reserves months
- —
- Total cash needed
- —
Loan-product check · same deal, 3 products live
Conventional
25% down · 7.5% · 30yr
- Down + closing
- —
- Monthly P&I
- —
- Monthly cashflow
- —
- DSCR
- —
- Eligible?
- —
Personal DTI + credit; lowest rate.
DSCR
20% down · 8.5% · 30yr
- Down + closing
- —
- Monthly P&I
- —
- Monthly cashflow
- —
- DSCR
- —
- Eligible?
- —
No personal income docs; deal must DSCR.
Hard money
10% down · 12.0% · 12mo
- Down + closing
- —
- Monthly P&I
- —
- Monthly cashflow
- —
- DSCR
- —
- Eligible?
- —
Short-term bridge; refi at stabilization.
Rent comps 20 comps
| Address | Beds | Baths | Sqft | Rent | $/sqft | DOM | Units | Dist |
|---|---|---|---|---|---|---|---|---|
| 10765 E NW Hwy Dallas, TX | 2.0–3.0 | 1.5–2.0 | 1250 | $1,485 | $1.19 | 4d | 2 | 0.37mi |
| 8834 Liptonshire Dr Dallas, TX | 4.0 | 2.5 | 1674 | $3,900 | $2.33 | 26d | 1 | 0.64mi |
| 8717 Hackney Ln Dallas, TX | 3.0 | 2.0 | 1402 | $2,800 | $2.00 | 21d | 1 | 0.78mi |
| 11125 Cactus Ln Dallas, TX | 4.0 | 2.5 | 1833 | $2,900 | $1.58 | 0d | 1 | 0.90mi |
| 11125 Cactus Ln Dallas, TX | 4.0 | 2.5 | 1833 | $2,900 | $1.58 | 1d | 1 | 0.90mi |
| 10505 Swallow Ln Dallas, TX | 3.0 | 2.0 | 2258 | $3,200 | $1.42 | 9d | 1 | 0.94mi |
| 9210 Larchwood Dr Dallas, TX | 3.0 | 2.0 | 1598 | $3,000 | $1.88 | 19d | 1 | 0.95mi |
| 8945 Flicker Ln Dallas, TX | 4.0 | 2.0 | 1513 | $2,245 | $1.48 | 9d | 1 | 1.06mi |
| 8945 Flicker Ln Dallas, TX | 4.0 | 2.0 | 1513 | $2,245 | $1.48 | 5d | 1 | 1.06mi |
| 10626 Longmeadow Dr Dallas, TX | 4.0 | 2.0 | 1754 | $3,300 | $1.88 | 6d | 1 | 1.08mi |
| 10903 Lake Gardens Dr Dallas, TX | 2.0 | 2.0 | 1400 | $1,800 | $1.29 | 46d | 1 | 1.15mi |
| 11517 Fernald Ave Dallas, TX | 4.0 | 2.0 | 1426 | $2,080 | $1.46 | 8d | 1 | 1.20mi |
| 11517 Fernald Ave Dallas, TX | 4.0 | 2.0 | 1426 | $2,146 | $1.50 | 9d | 1 | 1.20mi |
| 11352 Quail Run St Dallas, TX | 3.0 | 2.0 | 1673 | $1,800 | $1.08 | 26d | 1 | 1.20mi |
| 11350 Quail Run St Unit 11352QR Dallas, TX | 3.0 | 2.0 | 1673 | $1,800 | $1.08 | 26d | 1 | 1.20mi |
| 11348 McCree Rd Dallas, TX | 3.0 | 2.5 | 1834 | $2,500 | $1.36 | 46d | 1 | 1.23mi |
| 10715 Garland Rd Dallas, TX | 1.0–2.0 | 1.0–2.0 | 1049 | $3,300 | $3.14 | 1d | 200 | 1.24mi |
| 11317 McCree Rd Dallas, TX | 4.0 | 2.0 | 1910 | $2,274 | $1.19 | 9d | 1 | 1.24mi |
| 11015 Wallbrook Dr Dallas, TX | 3.0 | 2.0 | 1856 | $2,200 | $1.19 | 46d | 1 | 1.25mi |
| 939 N Buckner Blvd Dallas, TX | 4.0 | 2.5 | 2650 | $12,500 | $4.72 | 0d | 1 | 1.30mi |
Listing history 5 events
-
2026-05-12$450,000 Active 1323-char remark
-
2004-08-05soldstatus
-
2004-07-30soldstatus 305-char remark
Show marketing remark (305 chars)
Fantastic investment property! Almost 4000 sf duplex in Lake Highlands. This property has been well-maintained 1 unit @1432 sf is 2/2 2/an open kit to the family rm. Mstr has sep bath w/ huge WIC. Nice cov. patio w/ sm back yard. Larger unit @2422sf is a 3/3 w/ 2 fam. rms. Mstr & upstairs bdrm have
-
2004-06-29historical 305-char remark
Show marketing remark (305 chars)
Fantastic investment property! Almost 4000 sf duplex in Lake Highlands. This property has been well-maintained 1 unit @1432 sf is 2/2 2/an open kit to the family rm. Mstr has sep bath w/ huge WIC. Nice cov. patio w/ sm back yard. Larger unit @2422sf is a 3/3 w/ 2 fam. rms. Mstr & upstairs bdrm have
-
2004-06-28$269,000 305-char remark
Show marketing remark (305 chars)
Fantastic investment property! Almost 4000 sf duplex in Lake Highlands. This property has been well-maintained 1 unit @1432 sf is 2/2 2/an open kit to the family rm. Mstr has sep bath w/ huge WIC. Nice cov. patio w/ sm back yard. Larger unit @2422sf is a 3/3 w/ 2 fam. rms. Mstr & upstairs bdrm have
ⓘ Source: listings_history table (triggers on properties + properties_extension) + one-shot
backfill from property_details.listing_events for pre-trigger history.
Tax reassessment forecast TX · Resets to sale price
- Current annual tax
- $7,554 · $630/mo
- Projected year-2 tax
- $8,235 · $686/mo
- Expected delta
- +$681/yr (+$57/mo · 9.0%)
ⓘ Screening estimate from a state-policy table — verify with the county assessor before closing.
Climate risk First Street
- Flood 1/10 Low FEMA zone X (unshaded) · 0% chance over 30 yrs
- Wildfire 1/10 Low
- Heat 7/10 Severe 7 d/yr ≥109°F today · 23 d/yr by 30 yrs out
- Wind 6/10 Major 27% chance of damaging wind over 30 yrs
- Air quality 3/10 Moderate 3 unhealthy d/yr today · 3 by 30 yrs out
Nearby sold comps map
Loading sold comps map…
Walkable amenities ~0.75 mi
Loading nearby amenities…
Taxation est. · year 1
- Rental income
- $42,672
- − Mortgage interest
- −$25,207
- − Property taxes
- −$7,554
- − Insurance
- −$2,250
- − Repairs & maintenance
- −$3,414
- − Management
- −$3,414
- − Depreciation
- −$13,091
- Taxable loss
- −$12,258
- Est. tax savings @ 24.0%
- +$2,942
- After-tax cash flow
- $-1,470/yr
For passive investors: Depreciation is non-cash, so a rental often shows a tax loss while cash-flowing — sheltering income. Rental losses are passive: they offset passive income freely, and up to $25,000/yr can offset ordinary (W-2) income if you actively participate and your MAGI is under $100k (phasing out to $0 by $150k); unused losses carry forward. On sale, claimed depreciation is recaptured at up to 25%, and gains may owe capital-gains tax (a 1031 exchange can defer both). Figures are a year-1 estimate at your 24.0% rate — not tax advice; consult a CPA.
Schools (NCES district)
- District
- Dallas ISD
- NCES district ID
- 4816230
- Math proficiency
- 31% ▼ -16.00%
- Reading proficiency
- 36% ▼ -4.00%
- Median HH income
- $42,881
- Composite
- 28.41/100
- National rank
- #6763
- State rank
- #559 of 826 in TX
Livability — Dallas
- Score
- 81/100
- State rank
- #24
- US rank
- #1380
Category grades
Schools grade is shown separately in the Schools card above.
Census & demographics
- Census place
- Dallas, TX
- County
- Dallas County · 2,612,404 people
- City population
- 1,168,437
- Metro
- Dallas-Fort Worth-Arlington, TX
- Population (ZIP)
- 22,544
- Household income
- $107,366
- Rent vs Own
- Severe rent burden
- 943.0
Population outlook (Dallas County) Hauer SSP2
- Today (2025)
- 2,979,839 people
- By 2030
- 3,191,823 · +7.1%
- By 2040
- 3,619,611 · +21.5%
- By 2050
- 4,026,915 · +35.1%
- By 2075
- 4,957,073 · +66.4%
- By 2100
- 5,508,725 · +84.9%
Race, ethnicity, and origin ACS 2023
- Neighborhood character
- Majority White (60%)
- Race & ethnicity
- White 60% Hispanic / Latino 30% Two or more races 12% Black 6%
- Hispanic origin (detail)
- Mexican 21%
- Common ancestry
- Italian 2% Serbian 2% Slovak 2%
- Foreign-born
- 12% · Canada, China
- Languages at home
- 76% English-only · Spanish 22%
Political lean MEDSL · Dallas
- 2024 margin
- Strong D (+22.2) · D 60.2% · R 38.0% · Other 1.8%
- 2008→2024 swing
- +6.9pp toward D · 2008: 15.3pp · 2024: 22.2pp
- All cycles
- 2024: D+22.2 2020: D+31.6 2016: D+26.2 2012: D+15.4 2008: D+15.3
Not yet ingested
- Civics
- —
Market trends
- HPI YoY
- ▼ -578.40%
- Current HPI
- 325.633
- Rent YoY
- ▼ -0.20%
- Metro
- Dallas-Fort Worth-Arlington, TX
- State GDP YoY
- ▲ 3.95%
- F500 in state
- 110
Industry mix (Fortune 500 HQ in TX)
| Industry | F500 HQs | Revenue |
|---|---|---|
| Energy | 16 | $1,198B |
|
||
| Technology | 5 | $198B |
|
||
| Engineering / Construction | 4 | $72B |
|
||
| Energy Services | 3 | $60B |
|
||
| Utilities | 3 | $41B |
|
||
| Healthcare | 2 | $330B |
|
||
Price history
+67.3% since first listed7 events — show timeline
- 2026-06-05 Sold (MLS) — NTREIS
- 2026-05-19 Pending — NTREIS
- 2026-05-12 Listed $450,000 NTREIS
- 2004-08-05 Sold (Public Records) — Public Records
- 2004-07-30 Sold (MLS) — NTREIS
- 2004-06-29 Listing Removed — NTREIS
- 2004-06-28 Listed $269,000 NTREIS
Property tax history
+7.1%/yrLatest (2025): $7,554 · -0.4% YoY. Source: county tax records.
Cash-flow waterfall
monthlySold comps — $/sqft
last 12 mo · ≤1 miLoading sold comps…