121 Bull Path · Northwest Harbor, NY
Flood risk 3/10 · Minor
- FEMA flood zone
- X (unshaded)
- Chance of flooding over 30 yrs
- 0.2%
- Est. flood insurance / yr
- $473 – $860
Fire risk 3/10 · Minor
- Est. fire insurance / yr
- $691 – $1,283
Heat risk 4/10 · Minor
- Hot days now (above 90°F)
- 7 days/yr
- Hot days in 30 yrs
- 18 days/yr
Wind risk 8/10 · Major
- Chance of severe wind over 30 yrs
- 80.0%
Air-quality risk 3/10 · Minor
- Unhealthy air days now
- 2 days/yr
- Unhealthy air days in 30 yrs
- 3 days/yr
Risk factors via First Street. Map © Google.
Why this score? — see what drove the C+ grade
The composite is a weighted blend of 9 inputs, each scored 0–100. Each bar is that input's sub-score; the figure is the points it added to the 100-point composite (weight × sub-score).
- Cash flow +24.2/30.0
- DSCR +7.8/10.0
- ARV discount +7.5/15.0
- Schools +5.8/10.0
- 1% rule +5.2/10.0
- Rent growth +5.0/5.0
- Livability +3.0/5.0
- Condition / age +2.5/5.0
- Appreciation +0.0/10.0
$2,300,000
🖨 Deal sheet 📄 Offer letter ✓ Due diligence
Listing remarks
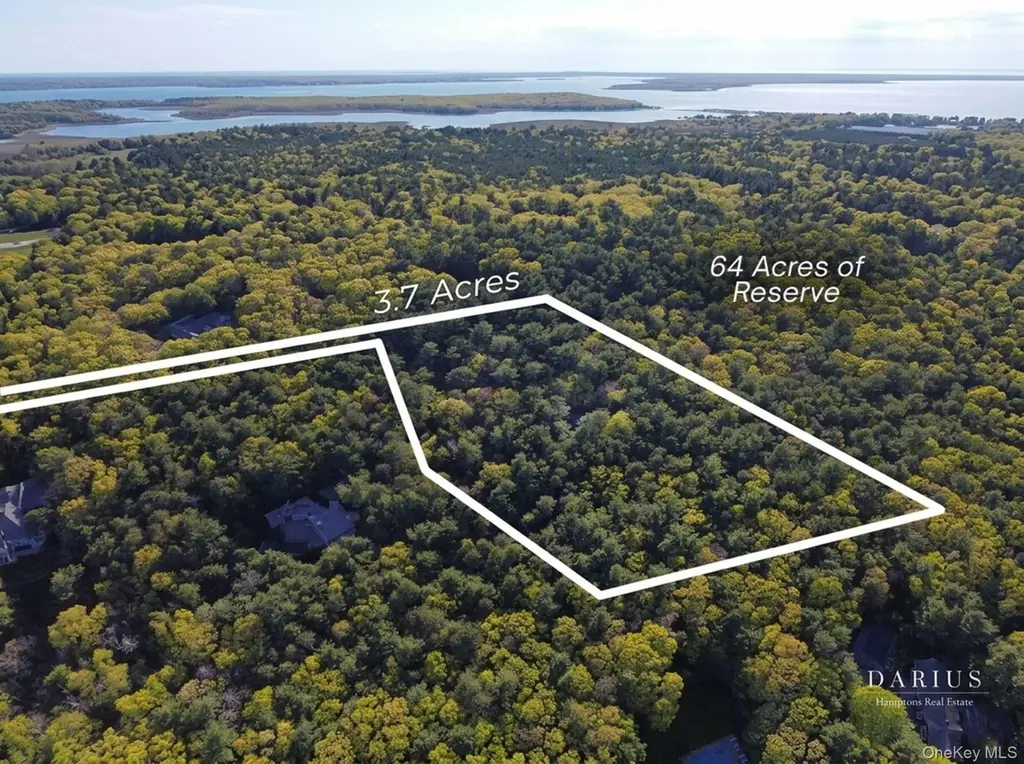
Boarding 64 acres of reserve to the west, 121 Bull Path in East Hampton offers 3.7 acres of majestic mature pine forest and rare privacy. The property presently features a charming 1,700 +/- SF saltbox with four bedrooms and two bathrooms, but the true opportunity may be what comes next: the potential to create a new residence of up to 10,000 +/- SF on this extraordinary lot. With the ability to clear up to 24,373 +/- SF, the possibilities are substantial - pool, pool house, outdoor living spaces, and more, all surrounded by privacy-affording towering pines that would take generations to replace. A property with this scale, privacy, and flexibility is becoming increasingly difficult to find
Key facts
- Pool house
- 64 acres of reserve
- 3.72 acre lot
Tags
Neighborhood map
What this means for you Summary
Snapshot
- This is a 4-bed/3.0-bath single-family listed at $2.30M.
Deal economics
- At list price, monthly cash flow is $5k ($55k/yr) — positive.
- The deal already cash-flows at list — no discount required.
- Meets the 1% rule at list price ($23k rent vs $2.30M).
- Recommended offer: $2.27M (1.5% below list) — sets the bar for market timing.
Location & tenants
- Location reads 60/100 on livability (#1,007 in NY) — a middle-class / working-renter tenant base. Strengths: crime A+, employment A+; Watch: amenities F, commute F, cost of living F.
- East Hampton Union Free School District (town): math 62% / reading 66% proficiency, ranked #159 of 590 in NY (top 27%) — acceptable for families but not a draw, mixed tenant base, ~2y average lease.
- Zoned schools: John M Marshall Elementary School (math 57% / reading 62%, grade B-, #745 of 2,108 statewide, top 39%, 548 students, 51% FRL); East Hampton Middle School (math 39% / reading 60%, grade C, #280 of 729 statewide, top 40%, 265 students, 42% FRL); East Hampton High School (math 94% / reading 98%, grade A+, #71 of 1,100 statewide, top 7%, 1,015 students, 40% FRL) — zoned schools average 44% FRL vs 26% district-wide (18 pts higher); higher-poverty schools than district average — tighter screening recommended.
- Market conditions: Rents rising fast (+12.3%/yr); 135 active listings in the ZIP; 5 comparable units currently listed for rent nearby; rentals at typical pace (median 25d on market — plan ~3-4 weeks tenant-placement turnaround); high-income renter base; 1,366 units permitted in Suffolk County in 2024 (216 in 5+ unit buildings).
- At $23,426/mo this rent would consume 216% of the median local household income ($130k/yr) (locally 896% of renters already pay >50% of income on rent) — very limited rent-growth headroom before tenants either downsize or default.
Forward outlook
- Local home prices are declining (-3.0%/yr); year-one equity from $16k of loan paydown is wiped out by about $69k of value loss. Plan a longer hold.
- Suffolk County population projected to shrink 5% by 2050 — rents likely to lag national; underwrite the cash flow, not the appreciation.
- At projected returns (-3.0% appreciation + 8.0% rent growth), your $644k cash investment doubles in ~8 years — after that, you're playing with house money.
Negotiation context
- It's been on market 23 days — a 2% lower offer ($2.27M) is reasonable based on typical stale-listing flexibility.
- Current owner paid $1.05M; list at $2.30M implies a 119% gain — meaningful room to come down on a strong offer.
Risks & watch-outs
- Climate carrying-cost: severe wind risk, 80% chance of damaging wind over 30y — expect insurance premiums to compound above CPI over the hold.
Questions for the listing agent
- Is there a deadline driving the sale (1031 exchange, divorce, estate, relocation)? That informs how much negotiation room exists.
- Schools are D-rated, which usually means shorter tenancies and higher turnover. Who's the typical renter profile here, and what's been the actual vacancy rate?
- What's the average days-on-market for RENTAL listings here right now (not sales)? A rising rental-DOM trend means longer vacancies and softer asking-rent achievability than the comps imply.
- What's the recent tenant-quality profile in this submarket — average credit score on applications, eviction rate, late-payment / NSF rate, and stable-employment percentage? A property-management company in the area should have these aggregated.
- How much new for-sale + rental construction is in the pipeline within 1–3 miles? Heavy new supply typically softens prices + rents 12–24 months out; constrained supply supports both.
Investment metrics
- 1% rule
- 1.02% ✓
- Cap rate
- 8.69%
- Cash-on-cash
- 8.56%
- DSCR
- 1.38
- GRM
- 8.2
CMA / ARV
No comps found within radius.
Projected returns pro-forma
-3.0% appreciation · 8.0% rent growth · sell at horizon
- IRR
- 1.6%
- Equity multiple
- 1.07×
- Total profit
- $42,682
- Equity at exit
- $342,937
- IRR
- 15.3%
- Equity multiple
- 2.51×
- Total profit
- $973,686
- Equity at exit
- $198,862
Cash invested: $644,000 (down + closing). Projections, not guarantees.
Landlord ↔ Tenant lean methodology
- Overall (STATE)
- 15 Strongly Tenant-Friendly
- State New York
- 15 Strongly Tenant-Friendly · D+10
- County
- — inherits STATE
- City
- — inherits STATE
ZIP-level market 11937
- Rents YoY
- 12.3%
- Active inventory
- 135
- Price-to-rent
- 8.2×
Monthly cashflow live
- Estimated rent
- $23,426 medium interval (Pro) →
- Mortgage (P&I)
- −$12,061
- Tax from tax record
- −$895 /mo · $10,736/yr
- Insurance
- −$958
- HOA
- −$0
- Vacancy / Maint / Mgmt
- −$4,919
- Net cashflow
- $4,592
Break-even live
UW: 25.0% down · 7.5% · 30yr · 1.5% tax · 5.0% vac · 8.0% maint · 8.0% mgmt
Financing live
Cash to close
- Down payment
- $575,000
- Closing costs
- $69,000
- Reserves months
- —
- Total cash needed
- —
Loan-product check · same deal, 3 products live
Conventional
25% down · 7.5% · 30yr
- Down + closing
- —
- Monthly P&I
- —
- Monthly cashflow
- —
- DSCR
- —
- Eligible?
- —
Personal DTI + credit; lowest rate.
DSCR
20% down · 8.5% · 30yr
- Down + closing
- —
- Monthly P&I
- —
- Monthly cashflow
- —
- DSCR
- —
- Eligible?
- —
No personal income docs; deal must DSCR.
Hard money
10% down · 12.0% · 12mo
- Down + closing
- —
- Monthly P&I
- —
- Monthly cashflow
- —
- DSCR
- —
- Eligible?
- —
Short-term bridge; refi at stabilization.
Rent comps 5 comps
| Address | Beds | Baths | Sqft | Rent | $/sqft | DOM | Units | Dist |
|---|---|---|---|---|---|---|---|---|
| 10 Villa Ave East Hampton, NY | 3.0 | 4.0 | 2200 | $35,000 | $15.91 | 25d | 1 | 0.25mi |
| 33 Oak Hill Ln East Hampton, NY | 4.0 | 3.0 | 2350 | $55,000 | $23.40 | 25d | 1 | 0.54mi |
| 3 Oak Hill Ln East Hampton, NY | 4.0 | 3.5 | 2000 | $90,000 | $45.00 | 44d | 1 | 0.69mi |
| 8 White Pine Rd East Hampton, NY | 5.0 | 3.5 | 2000 | $60,000 | $30.00 | 25d | 1 | 0.73mi |
| 36 Barnes Ave East Hampton, NY | 4.0 | 3.0 | 2346 | $55,000 | $23.44 | 25d | 1 | 0.92mi |
Listing history 12 events
-
2026-06-13statusdays on market $2,300,000 Pending 23 DOM
-
2026-06-09days on market $2,300,000 Active 20 DOM
-
2026-06-08days on market $2,300,000 Active 19 DOM
-
2026-06-07days on market $2,300,000 Active 18 DOM
-
2026-06-04days on market $2,300,000 Active 15 DOM
-
2026-06-03days on market $2,300,000 Active 14 DOM
-
2026-06-02days on market $2,300,000 Active 13 DOM
-
2026-06-01days on market $2,300,000 Active 12 DOM
-
2026-05-31days on market $2,300,000 Active 11 DOM
-
2026-05-20$2,300,000 Active
-
2011-05-25soldstatus $1,051,000
-
2004-01-20soldstatus $937,500
ⓘ Source: listings_history table (triggers on properties + properties_extension) + one-shot
backfill from property_details.listing_events for pre-trigger history.
Tax reassessment forecast NY · Partial reset (capped growth)
- Current annual tax
- $10,736 · $895/mo
- Projected year-2 tax
- $24,803 · $2,067/mo
- Expected delta
- +$14,067/yr (+$1,172/mo · 131.0%)
ⓘ Screening estimate from a state-policy table — verify with the county assessor before closing.
Climate risk First Street
- Flood 3/10 Moderate FEMA zone X (unshaded) · 20% chance over 30 yrs
- Wildfire 3/10 Moderate
- Heat 4/10 Moderate 7 d/yr ≥90°F today · 18 d/yr by 30 yrs out
- Wind 8/10 Severe 80% chance of damaging wind over 30 yrs
- Air quality 3/10 Moderate 2 unhealthy d/yr today · 3 by 30 yrs out
Nearby sold comps map
Loading sold comps map…
Walkable amenities ~0.75 mi
Loading nearby amenities…
Taxation est. · year 1
- Rental income
- $281,106
- − Mortgage interest
- −$128,836
- − Property taxes
- −$10,736
- − Insurance
- −$11,500
- − Repairs & maintenance
- −$22,488
- − Management
- −$22,488
- − Depreciation
- −$66,909
- Taxable income
- $18,148
- Est. tax owed @ 24.0%
- −$4,355
- After-tax cash flow
- $50,745/yr
For passive investors: Depreciation is non-cash, so a rental often shows a tax loss while cash-flowing — sheltering income. Rental losses are passive: they offset passive income freely, and up to $25,000/yr can offset ordinary (W-2) income if you actively participate and your MAGI is under $100k (phasing out to $0 by $150k); unused losses carry forward. On sale, claimed depreciation is recaptured at up to 25%, and gains may owe capital-gains tax (a 1031 exchange can defer both). Figures are a year-1 estimate at your 24.0% rate — not tax advice; consult a CPA.
Schools (NCES district)
- District
- East Hampton Union Free School District
- NCES district ID
- 3609660
- Math proficiency
- 62% ▼ -5.00%
- Reading proficiency
- 66% ▲ 2.00%
- Median HH income
- $86,309
- Composite
- 57.85/100
- National rank
- #1046
- State rank
- #159 of 590 in NY
Livability — Northwest Harbor
- Score
- 60/100
- State rank
- #1007
- US rank
- #19577
Category grades
Schools grade is shown separately in the Schools card above.
Census & demographics
- Census place
- Northwest Harbor, NY
- County
- Suffolk County · 679,920 people
- Metro
- New York-Newark-Jersey City, NY-NJ-PA
- Population (ZIP)
- 21,882
- Household income
- $129,883
- Rent vs Own
- Severe rent burden
- 896.0
Population outlook (Suffolk County) Hauer SSP2
- Today (2025)
- 1,505,262 people
- By 2030
- 1,498,318 · -0.5%
- By 2040
- 1,471,101 · -2.3%
- By 2050
- 1,424,848 · -5.3%
- By 2075
- 1,337,157 · -11.2%
- By 2100
- 1,217,720 · -19.1%
Race, ethnicity, and origin ACS 2023
- Neighborhood character
- Majority White (61%)
- Race & ethnicity
- White 61% Hispanic / Latino 32% Two or more races 23% Black 2% Asian 2%
- Hispanic origin (detail)
- Mexican 2% Puerto Rican 1%
- Common ancestry
- Romanian 5% Scotch-Irish 4% Italian 2%
- Foreign-born
- 25% · Canada, Guatemala, Jamaica
- Languages at home
- 68% English-only · Spanish 28% Other Indo-European 1% Russian/Polish/Slavic 1%
Political lean MEDSL · Suffolk
- 2024 margin
- Lean R (+10.0) · D 45.0% · R 55.0%
- 2008→2024 swing
- -16.0pp toward R · 2008: 6.0pp · 2024: -10.0pp
- All cycles
- 2024: R+10.0 2020: R+0.0 2016: R+8.2 2012: D+2.9 2008: D+6.0
Not yet ingested
- Civics
- —
Market trends
- HPI YoY
- ▼ -285.21%
- Current HPI
- 444.1499
- Rent YoY
- ▲ 12.28%
- Metro
- New York-Newark-Jersey City, NY-NJ-PA
- State GDP YoY
- ▲ 2.60%
- F500 in state
- 92
Industry mix (Fortune 500 HQ in NY)
| Industry | F500 HQs | Revenue |
|---|---|---|
| Financial Services | 10 | $950B |
|
||
| Consumer Goods | 9 | $162B |
|
||
| Insurance | 4 | $225B |
|
||
| Telecommunications | 2 | $144B |
|
||
| Pharmaceuticals | 2 | $112B |
|
||
| Media / Entertainment | 2 | $69B |
|
||
Price history
+145.3% since first listed3 events — show timeline
- 2026-05-20 Listed $2,300,000 OneKey® MLS as Distributed by MLS Grid
- 2011-05-25 Sold (Public Records) $1,051,000 Public Records
- 2004-01-20 Sold (Public Records) $937,500 Public Records
Property tax history
+0.4%/yrLatest (2025): $10,736 · +0.0% YoY. Source: county tax records.
Cash-flow waterfall
monthlySold comps — $/sqft
last 12 mo · ≤1 miLoading sold comps…