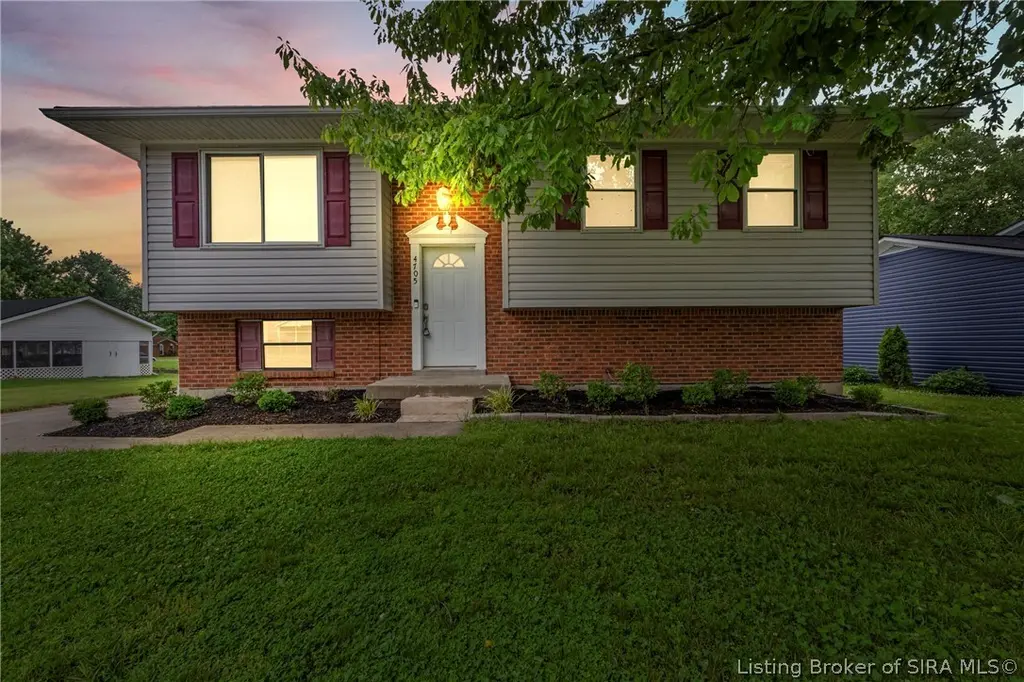
4705 Fallow Dr · Jeffersonville, IN
Flood risk 1/10 · Minimal
- FEMA flood zone
- X (shaded)
- Chance of flooding over 30 yrs
- 0.0%
- Est. flood insurance / yr
- $507 – $1,088
Fire risk 1/10 · Minimal
- Est. fire insurance / yr
- $717 – $1,331
Heat risk 5/10 · Moderate
- Hot days now (above 105°F)
- 7 days/yr
- Hot days in 30 yrs
- 20 days/yr
Wind risk 2/10 · Minimal
- Chance of severe wind over 30 yrs
- 2.0%
Air-quality risk 3/10 · Minor
- Unhealthy air days now
- 2 days/yr
- Unhealthy air days in 30 yrs
- 4 days/yr
Risk factors via First Street. Map © Google.
Why this score? — see what drove the D+ grade
The composite is a weighted blend of 9 inputs, each scored 0–100. Each bar is that input's sub-score; the figure is the points it added to the 100-point composite (weight × sub-score).
- Cash flow +13.9/30.0
- ARV discount +13.8/15.0
- DSCR +4.2/10.0
- Livability +4.2/5.0
- 1% rule +3.2/10.0
- Schools +2.7/10.0
- Rent growth +2.6/5.0
- Condition / age +2.5/5.0
- Appreciation +0.0/10.0
$235,000
🖨 Deal sheet 📄 Offer letter ✓ Due diligence
Listing remarks MLS
Open House 5/20/2018 from 2-4PM! Updated and ready to move in! This cute home has fresh paint, new flooring, light fixtures and a new entry door. Living area, kitchen, dining, 3 bedrooms and 1.5 baths on the main floor. Lower level offers a large family room, full bath/laundry, bonus room and storage. An oversized deck is accessible from the master bedroom and kitchen, making morning coffee and entertaining a breeze. New roof in 2014, vinyl siding in 2010 and windows updated in 2003. Location is perfect; minutes from downtown Louisville, shopping, entertainment and restaurants!
Key facts
- Fenced-in backyard
- 0.27 acre lot
- Built 1979
Tags
Property features AI
Finance
- Other: Zoned residential
Exterior
- Parking: Paved driveway
- Utilities: Public water; Public sewer
- Home design: Residential property; Below-grade finished area (basement) present; Above-grade finished living area present
- Construction: Brick, frame and vinyl siding construction; Poured foundation; Below-grade finished area approximately 900; Above-grade finished area approximately 996
- Exterior features: Deck; Patio/deck; Yard fenced; Shed(s); Paved driveway; Paved road access
Interior
- Kitchen: Kitchen (First level) — 9 x 12; Dishwasher; Oven; Range; Refrigerator
- Bedrooms: Bedroom (First level) — 9 x 11; Bedroom (First level) — 8.5 x 11; Bedroom (First level) — 12 x 11.5
- Flooring: Engineered hardwood throughout main living areas
- Bathrooms: 2 full bathrooms; 1 half bathroom
- Heating & cooling: Forced air heating; Central air conditioning
- Interior features: Primary bedroom with private bath; Main level primary bedroom; Finished basement; Total of 8 rooms
- Laundry & utility: Laundry on main level
Neighborhood map
What this means for you Summary
Snapshot
- This is a 4-bed/2.0-bath single-family listed at $235k.
Deal economics
- At list price, monthly cash flow is $24 ($285/yr) — positive.
- The deal already cash-flows at list — no discount required.
- To meet the 1% rule (rent ≥ 1% of price), the offer needs to be $193k (17.9% below list).
- Recommended offer: $193k (17.9% below list) — sets the bar for 1% rule.
- Cap rate 6.4% vs local median 3.5% in Jeffersonville — top-decile yield for the area; either an underpriced asset or a hidden risk that comps aren't pricing in. Stress-test before assuming the spread holds.
Location & tenants
- Location reads 83/100 on livability (#8 in IN, #843 nationally) — a professional / high-income tenant draw. Strengths: commute A+, cost of living A+, housing A+; Watch: schools C-.
- Greater Clark County Schools (suburban): math 26% / reading 37% proficiency, ranked #224 of 301 in IN (top 74%) — families likely to look elsewhere, expect single-tenant / working-renter base with shorter leases.
- Market conditions: Rents flat; 425 active listings in the ZIP; 7 comparable units currently listed for rent nearby; rentals leasing fast (median 3d on market — plan ~1-2 weeks tenant-placement turnaround); 911 units permitted in Clark County in 2024 (133 in 5+ unit buildings).
- This rent runs 33% of the median local income ($70k/yr) — at the standard rent-burdened threshold; future hikes will face affordability resistance.
Forward outlook
- Local home prices are declining (-3.0%/yr); year-one equity from $2k of loan paydown is wiped out by about $7k of value loss. Plan a longer hold.
- Clark County population projected at +17% by 2050 — long-run rental-demand tailwind backs the buy-and-hold thesis.
Negotiation context
- It's been on market 16 days — a 2% lower offer ($231k) is reasonable based on typical stale-listing flexibility.
- 2 sale attempts since 8y ago with the ask held roughly flat each time — persistent listings suggest the price (not the market) is what's stuck; bring a comps-based counter.
- Current owner paid $145k; list at $235k implies a 62% gain — meaningful room to come down on a strong offer.
Risks & watch-outs
- Climate carrying-cost: extreme-heat days projected 7→20/yr by 2055 (HVAC capex compounding) — expect insurance premiums to compound above CPI over the hold.
Questions for the listing agent
- Built in 1979 — when were the roof, HVAC, electrical panel, plumbing, and water heater last replaced?
- Is there a deadline driving the sale (1031 exchange, divorce, estate, relocation)? That informs how much negotiation room exists.
- The area grade is low — what's the realistic commute time and amenity access for the typical tenant pool here? Any planned neighborhood developments (good or bad) we should know about?
- What's the average days-on-market for RENTAL listings here right now (not sales)? A rising rental-DOM trend means longer vacancies and softer asking-rent achievability than the comps imply.
- What's the recent tenant-quality profile in this submarket — average credit score on applications, eviction rate, late-payment / NSF rate, and stable-employment percentage? A property-management company in the area should have these aggregated.
- How much new for-sale + rental construction is in the pipeline within 1–3 miles? Heavy new supply typically softens prices + rents 12–24 months out; constrained supply supports both.
Investment metrics
- 1% rule
- 0.82% ✗
- Cap rate
- 6.41%
- Cash-on-cash
- 0.43%
- DSCR
- 1.02
- GRM
- 10.1
CMA / ARV
- ARV (on-the-fly)
- $273,024
- Comps found
- 12
Show comp detail 12 sales within ~0.75 mi
| Address | Dist | Beds/Ba | Sqft | Sold | Price | $/sf | Match |
|---|---|---|---|---|---|---|---|
| 5211 Graves Rd | 0.46mi | 4/2.0 | 1,857 (-2%) | 2mo | $283,000 | $152 | 73 |
| 4608 Crescent Ave | 0.36mi | 4/2.5 | 1,800 (-5%) | 5mo | $269,900 | $150 | 68 |
| 2903 Crums Ln | 0.21mi | 3/1.5 (-1) | 1,725 (-9%) | 2mo | $248,500 | $144 | 66 |
| 2911 Crums Ln | 0.28mi | 3/2.0 (-1) | 1,662 (-12%) | 3mo | $280,000 | $168 | 59 |
| 3138 Red Barn Loop | 0.70mi | 3/2.5 (-1) | 1,873 (-1%) | 1mo | $265,000 | $141 | 58 |
| 3708 Holmans Ln | 0.75mi | 3/2.0 (-1) | 1,877 (-1%) | 2mo | $250,000 | $133 | 57 |
| 3113 Wheatfield Blvd | 0.58mi | 3/2.5 (-1) | 1,996 (+5%) | 3mo | $260,000 | $130 | 54 |
| 3902 Shepherds Run | 0.71mi | 4/2.5 | 1,960 (+3%) | 6mo | $243,400 | $124 | 54 |
| 3140 Wheatfield Blvd | 0.68mi | 4/2.5 | 2,034 (+7%) | 3mo | $275,000 | $135 | 52 |
| 4509 Crescent Ave | 0.36mi | 3/2.0 (-1) | 1,615 (-15%) | 4mo | $249,900 | $155 | 50 |
| 5105 Woodstone Circle Lot#111 | 0.58mi | 4/3.0 | 2,060 (+9%) | 7mo | $369,900 | $180 | 49 |
| 4513 Belmar Dr | 0.48mi | 3/2.0 (-1) | 1,669 (-12%) | 5mo | $210,000 | $126 | 48 |
Match score weights: distance 35% · size 25% · config 20% · recency 20%. Top-matched comps best support the ARV.
Projected returns pro-forma
-3.0% appreciation · 0.58% rent growth · sell at horizon
- IRR
- -18.2%
- Equity multiple
- 0.37×
- Total profit
- $-41,204
- Equity at exit
- $35,039
- IRR
- -15.6%
- Equity multiple
- 0.21×
- Total profit
- $-52,059
- Equity at exit
- $20,319
Cash invested: $65,800 (down + closing). Projections, not guarantees.
Landlord ↔ Tenant lean methodology
- Overall (STATE)
- 90 Strongly Landlord-Friendly
- State Indiana
- 90 Strongly Landlord-Friendly · R+11
- County
- — inherits STATE
- City
- — inherits STATE
ZIP-level market 47130
- Rents YoY
- 0.6%
- Active inventory
- 425
- Price-to-rent
- 10.1×
Monthly cashflow live
- Estimated rent
- $1,930 high interval (Pro) →
- Mortgage (P&I)
- −$1,232
- Tax from tax record
- −$170 /mo · $2,046/yr
- Insurance
- −$98
- HOA
- −$0
- Vacancy / Maint / Mgmt
- −$405
- Net cashflow
- $24
Break-even live
UW: 25.0% down · 7.5% · 30yr · 1.5% tax · 5.0% vac · 8.0% maint · 8.0% mgmt
Financing live
Cash to close
- Down payment
- $58,750
- Closing costs
- $7,050
- Reserves months
- —
- Total cash needed
- —
Loan-product check · same deal, 3 products live
Conventional
25% down · 7.5% · 30yr
- Down + closing
- —
- Monthly P&I
- —
- Monthly cashflow
- —
- DSCR
- —
- Eligible?
- —
Personal DTI + credit; lowest rate.
DSCR
20% down · 8.5% · 30yr
- Down + closing
- —
- Monthly P&I
- —
- Monthly cashflow
- —
- DSCR
- —
- Eligible?
- —
No personal income docs; deal must DSCR.
Hard money
10% down · 12.0% · 12mo
- Down + closing
- —
- Monthly P&I
- —
- Monthly cashflow
- —
- DSCR
- —
- Eligible?
- —
Short-term bridge; refi at stabilization.
Rent comps 7 comps
| Address | Beds | Baths | Sqft | Rent | $/sqft | DOM | Units | Dist |
|---|---|---|---|---|---|---|---|---|
| 2610 Veterans Pkwy Jeffersonville, IN | 4.0 | 2.0 | 2262 | $2,150 | $0.95 | 43d | 1 | 0.53mi |
| 4903 Hamburg Pike Jeffersonville, IN | 1.0–3.0 | 1.0–2.0 | 1172 | $1,820 | $1.55 | 1d | 21 | 0.53mi |
| 3908 Haystack Dr Jeffersonville, IN | 3.0 | 2.5 | 1584 | $1,950 | $1.23 | 3d | 1 | 0.60mi |
| 4501 Town Center Blvd Jeffersonville, IN | 1.0–3.0 | 1.0–2.0 | 1172 | $1,930 | $1.65 | 1d | 62 | 0.79mi |
| 3620 Alannah Gardens Ct Jeffersonville, IN | 3.0 | 2.0 | 1300 | $1,850 | $1.42 | 43d | 1 | 0.85mi |
| 2102 Bradford St Unit 94B Clarksville, IN | 3.0 | 2.0 | 1568 | $1,259 | $0.80 | 3d | 1 | 1.31mi |
| 201 Orchard Hills Dr Jeffersonville, IN | 1.0–3.0 | 1.0–2.5 | 1015 | $1,584 | $1.56 | 3d | 7 | 1.39mi |
Listing history 8 events
-
2026-06-07pricedays on market $235,000 Active 16 DOM
-
2026-06-03days on market $240,000 Active 12 DOM
-
2026-06-02days on market $240,000 Active 11 DOM
-
2026-06-01days on market $240,000 Active 10 DOM
-
2026-05-31days on market $240,000 Active 9 DOM
-
2026-05-22$240,000 Active
-
2018-06-22soldstatus $145,000 585-char remark
Show marketing remark (585 chars)
Open House 5/20/2018 from 2-4PM! Updated and ready to move in! This cute home has fresh paint, new flooring, light fixtures and a new entry door. Living area, kitchen, dining, 3 bedrooms and 1.5 baths on the main floor. Lower level offers a large family room, full bath/laundry, bonus room and storage. An oversized deck is accessible from the master bedroom and kitchen, making morning coffee and entertaining a breeze. New roof in 2014, vinyl siding in 2010 and windows updated in 2003. Location is perfect; minutes from downtown Louisville, shopping, entertainment and restaurants!
-
2018-05-16$144,900 585-char remark
Show marketing remark (585 chars)
Open House 5/20/2018 from 2-4PM! Updated and ready to move in! This cute home has fresh paint, new flooring, light fixtures and a new entry door. Living area, kitchen, dining, 3 bedrooms and 1.5 baths on the main floor. Lower level offers a large family room, full bath/laundry, bonus room and storage. An oversized deck is accessible from the master bedroom and kitchen, making morning coffee and entertaining a breeze. New roof in 2014, vinyl siding in 2010 and windows updated in 2003. Location is perfect; minutes from downtown Louisville, shopping, entertainment and restaurants!
ⓘ Source: listings_history table (triggers on properties + properties_extension) + one-shot
backfill from property_details.listing_events for pre-trigger history.
Tax reassessment forecast IN · Partial reset (capped growth)
- Current annual tax
- $2,046 · $170/mo
- Projected year-2 tax
- $2,046 · $170/mo
- Expected delta
- $0/yr ($0/mo · 0.0%)
ⓘ Screening estimate from a state-policy table — verify with the county assessor before closing.
Climate risk First Street
- Flood 1/10 Low FEMA zone X (shaded) · 0% chance over 30 yrs
- Wildfire 1/10 Low
- Heat 5/10 Major 7 d/yr ≥105°F today · 20 d/yr by 30 yrs out
- Wind 2/10 Low 2% chance of damaging wind over 30 yrs
- Air quality 3/10 Moderate 2 unhealthy d/yr today · 4 by 30 yrs out
Nearby sold comps map
Loading sold comps map…
Walkable amenities ~0.75 mi
Loading nearby amenities…
Taxation est. · year 1
- Rental income
- $23,157
- − Mortgage interest
- −$13,164
- − Property taxes
- −$2,046
- − Insurance
- −$1,175
- − Repairs & maintenance
- −$1,853
- − Management
- −$1,853
- − Depreciation
- −$6,836
- Taxable loss
- −$3,769
- Est. tax savings @ 24.0%
- +$905
- After-tax cash flow
- $1,189/yr
For passive investors: Depreciation is non-cash, so a rental often shows a tax loss while cash-flowing — sheltering income. Rental losses are passive: they offset passive income freely, and up to $25,000/yr can offset ordinary (W-2) income if you actively participate and your MAGI is under $100k (phasing out to $0 by $150k); unused losses carry forward. On sale, claimed depreciation is recaptured at up to 25%, and gains may owe capital-gains tax (a 1031 exchange can defer both). Figures are a year-1 estimate at your 24.0% rate — not tax advice; consult a CPA.
Schools (NCES district)
- District
- Greater Clark County Schools
- NCES district ID
- 1803940
- Math proficiency
- 26% ▼ -15.00%
- Reading proficiency
- 37% ▼ -13.00%
- Median HH income
- $47,838
- Composite
- 27.2/100
- National rank
- #7020
- State rank
- #224 of 301 in IN
Livability — Jeffersonville
- Score
- 83/100
- State rank
- #8
- US rank
- #843
Category grades
Schools grade is shown separately in the Schools card above.
Census & demographics
- Census place
- Jeffersonville, IN
- County
- Clark County · 108,879 people
- City population
- 50,514
- Metro
- Louisville/Jefferson County, KY-IN
- Population (ZIP)
- 50,514
- Household income
- $70,290
- Rent vs Own
- Severe rent burden
- 1088.0
Population outlook (Clark County) Hauer SSP2
- Today (2025)
- 126,401 people
- By 2030
- 131,455 · +4.0%
- By 2040
- 140,471 · +11.1%
- By 2050
- 147,677 · +16.8%
- By 2075
- 161,702 · +27.9%
- By 2100
- 164,078 · +29.8%
Race, ethnicity, and origin ACS 2023
- Neighborhood character
- Predominantly White (73%)
- Race & ethnicity
- White 73% Black 12% Two or more races 8% Hispanic / Latino 6% Asian 2%
- Hispanic origin (detail)
- Mexican 3% Puerto Rican 1%
- Common ancestry
- Slovak 3% Lithuanian 2% Romanian 2%
- Foreign-born
- 4% · Canada
- Languages at home
- 95% English-only · Spanish 3% Other Indo-European 1%
Political lean MEDSL · Clark
- 2024 margin
- Strong R (+20.4) · D 38.9% · R 59.3% · Other 1.8%
- 2008→2024 swing
- -13.3pp toward R · 2008: -7.1pp · 2024: -20.4pp
- All cycles
- 2024: R+20.4 2020: R+18.3 2016: R+22.0 2012: R+9.9 2008: R+7.1
Not yet ingested
- Civics
- —
Market trends
- HPI YoY
- ▼ -149.13%
- Current HPI
- 218.1985
- Rent YoY
- ▲ 0.58%
- Metro
- Louisville/Jefferson County, KY-IN
- State GDP YoY
- ▲ 2.90%
- F500 in state
- 18
Industry mix (Fortune 500 HQ in IN)
| Industry | F500 HQs | Revenue |
|---|---|---|
| Industrial Machinery | 2 | $37B |
|
||
| Healthcare | 1 | $177B |
|
||
| Pharmaceuticals | 1 | $45B |
|
||
| Metals / Steel | 1 | $18B |
|
||
| Agriculture | 1 | $17B |
|
||
| Packaging | 1 | $12B |
|
||
Price history
+65.6% since first listed3 events — show timeline
- 2026-05-22 Listed $240,000 SIRA
- 2018-06-22 Sold (MLS) $145,000 SIRA
- 2018-05-16 Listed $144,900 SIRA
Property tax history
+4.7%/yrLatest (2024): $2,046 · -0.7% YoY. Source: county tax records.
Cash-flow waterfall
monthlySold comps — $/sqft
last 12 mo · ≤1 miLoading sold comps…