2108 Taylor St · Chattanooga, TN
Flood risk 5/10 · Moderate
- FEMA flood zone
- X (unshaded)
- Chance of flooding over 30 yrs
- 0.24%
- Est. flood insurance / yr
- $507 – $1,088
Fire risk 3/10 · Minor
- Est. fire insurance / yr
- $949 – $1,763
Heat risk 6/10 · Moderate
- Hot days now (above 105°F)
- 7 days/yr
- Hot days in 30 yrs
- 19 days/yr
Wind risk 4/10 · Minor
- Chance of severe wind over 30 yrs
- 10.0%
Air-quality risk 4/10 · Minor
- Unhealthy air days now
- 3 days/yr
- Unhealthy air days in 30 yrs
- 4 days/yr
Risk factors via First Street. Map © Google.
Why this score? — see what drove the B grade
The composite is a weighted blend of 9 inputs, each scored 0–100. Each bar is that input's sub-score; the figure is the points it added to the 100-point composite (weight × sub-score).
- Cash flow +30.0/30.0
- ARV discount +14.6/15.0
- DSCR +10.0/10.0
- 1% rule +7.4/10.0
- Livability +3.9/5.0
- Rent growth +3.8/5.0
- Schools +2.7/10.0
- Condition / age +2.5/5.0
- Appreciation +0.0/10.0
$110,000
🖨 Deal sheet 📄 Offer letter ✓ Due diligence
Listing remarks
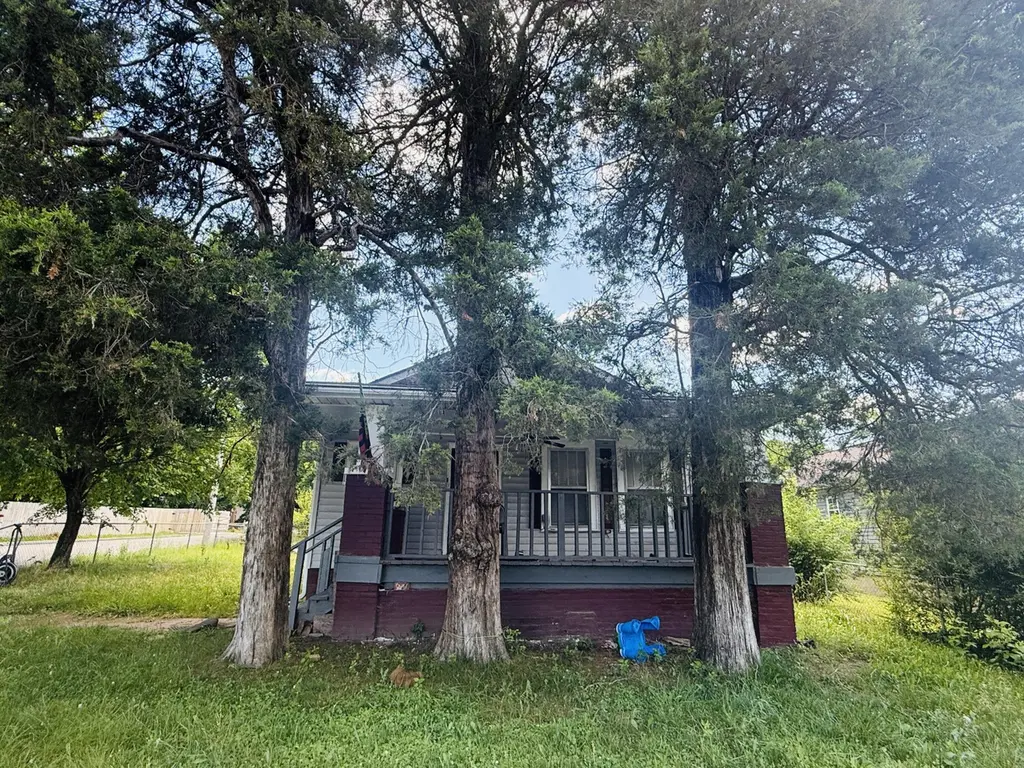
INVESTORS SPECIAL! This 3-bedroom 1-bath is in need of an almost complete renovation, but it has some key components worth mentioning, like the original hardwood flooring throughout the main area and the more recent roof and bath. This one needs some TLC otherwise. 1801 Taylor is a 1100 sft home that sits on a flat corner lot with a shade soaked front porch. The additional value is found in the oversized and flat residential lot with plenty of space to subdivide and build a new home while renovating the existing structure. 2 projects 1 parcel. The possibilities are endless. Motivated sellers, bring all offers. Property is an estate sale and is being sold strictly as-is.
Key facts
- Estate sale
- Great layout
- Plenty of space
Tags
Property features AI
Exterior
- Parking: Off-street parking; On-street parking
- Utilities: Public water; Public sewer; Electricity available; Water available; Sewer available; Cable available
- Home design: Single-family residence; Residential property; Fixer condition
- Construction: Shingle siding; Block foundation; Shingle roof; Built area above grade: 1,225
- Exterior features: Covered front porch; Chain link fencing; Paved, public maintained city street frontage; Corner, level lot (50 x 160)
Interior
- Flooring: Carpet; Hardwood
- Bathrooms: 1 full bathroom
- Heating & cooling: Central air conditioning
- Interior features: Rain gutters; 9 total rooms
Neighborhood map
What this means for you Summary
Snapshot
- This is a 3-bed/1.0-bath single-family listed at $110k.
Deal economics
- At list price, monthly cash flow is $434 ($5k/yr) — positive.
- The deal already cash-flows at list — no discount required.
- Meets the 1% rule at list price ($1k rent vs $110k).
- Cap rate 11.0% vs local median 3.4% in Chattanooga — top-decile yield for the area; either an underpriced asset or a hidden risk that comps aren't pricing in. Stress-test before assuming the spread holds.
Location & tenants
- Location reads 78/100 on livability (#3 in TN, #2,582 nationally) — a middle-class / working-renter tenant base. Strengths: amenities A+, commute A+, cost of living A+; Watch: employment D+, crime F.
- Hamilton County (urban): math 31% / reading 31% proficiency, ranked #42 of 139 in TN (top 30%) — families likely to look elsewhere, expect single-tenant / working-renter base with shorter leases.
- Zoned schools: Hardy Elementary School (math 8% / reading 2%, grade F, #896 of 952 statewide, top 96%, 435 students, 0% FRL); Orchard Knob Middle (math 5% / reading 6%, grade F, #291 of 333 statewide, top 88%, 334 students, 0% FRL); Brainerd High School (math 2% / reading 12%, grade F, #294 of 332 statewide, top 91%, 635 students, 0% FRL) — zoned schools average 0% FRL vs 52% district-wide (52 pts lower); this property's tenant base skews higher-income than the district average.
- Zoned-school proficiency averages 6% at this address vs 31% district-wide (-25 pts) — the specific schools serving this property underperform the Hamilton County average; the district grade overstates school quality for this exact location.
- Market conditions: Rents rising fast (+5.1%/yr); 127 active listings in the ZIP; 30 comparable units currently listed for rent nearby; rentals at typical pace (median 24d on market — plan ~3-4 weeks tenant-placement turnaround); lower-income renter base — watch delinquency; 2,133 units permitted in Hamilton County in 2024 (405 in 5+ unit buildings).
- This rent runs 37% of the median local income ($45k/yr) — at the standard rent-burdened threshold; future hikes will face affordability resistance.
Forward outlook
- Local home prices are declining (-3.0%/yr); year-one equity from $761 of loan paydown is wiped out by about $3k of value loss. Plan a longer hold.
- Hamilton County population projected at +23% by 2050 — long-run rental-demand tailwind backs the buy-and-hold thesis.
- At projected returns (-3.0% appreciation + 5.1% rent growth), your $31k cash investment doubles in ~7 years — after that, you're playing with house money.
Negotiation context
- Only 14 days on market — expect competitive offers; lowballing is unlikely to land.
- Current owner paid $14k; list at $110k implies a 686% gain — meaningful room to come down on a strong offer.
Risks & watch-outs
- Watch-outs: built in 1920 — expect roof / HVAC / electrical / plumbing capex.
- Climate carrying-cost: moderate flood risk; extreme-heat days projected 7→19/yr by 2055 (HVAC capex compounding) — expect insurance premiums to compound above CPI over the hold.
Questions for the listing agent
- Built in 1920 — when were the roof, HVAC, electrical panel, plumbing, and water heater last replaced?
- Is there a deadline driving the sale (1031 exchange, divorce, estate, relocation)? That informs how much negotiation room exists.
- Schools are F-rated, which usually means shorter tenancies and higher turnover. Who's the typical renter profile here, and what's been the actual vacancy rate?
- Crime grade is F in this area — have there been break-ins, vandalism, or insurance claims at this property in the last 3 years? What carrier currently insures it and at what premium?
- What's the average days-on-market for RENTAL listings here right now (not sales)? A rising rental-DOM trend means longer vacancies and softer asking-rent achievability than the comps imply.
- What's the recent tenant-quality profile in this submarket — average credit score on applications, eviction rate, late-payment / NSF rate, and stable-employment percentage? A property-management company in the area should have these aggregated.
- How much new for-sale + rental construction is in the pipeline within 1–3 miles? Heavy new supply typically softens prices + rents 12–24 months out; constrained supply supports both.
Investment metrics
- 1% rule
- 1.24% ✓
- Cap rate
- 11.03%
- Cash-on-cash
- 16.93%
- DSCR
- 1.75
- GRM
- 6.7
CMA / ARV
- ARV (on-the-fly)
- $130,650
- Comps found
- 2
Show comp detail 2 sales within ~0.75 mi
| Address | Dist | Beds/Ba | Sqft | Sold | Price | $/sf | Match |
|---|---|---|---|---|---|---|---|
| 1802 Wheeler Ave | 0.48mi | 3/1.0 | 1,092 (+9%) | 2mo | $83,000 | $76 | 61 |
| 2513 Olive St | 0.52mi | 3/1.0 | 1,118 (+11%) | 4mo | $145,000 | $130 | 54 |
Match score weights: distance 35% · size 25% · config 20% · recency 20%. Top-matched comps best support the ARV.
Projected returns pro-forma
-3.0% appreciation · 5.13% rent growth · sell at horizon
- IRR
- 10.3%
- Equity multiple
- 1.42×
- Total profit
- $12,789
- Equity at exit
- $16,401
- IRR
- 20.9%
- Equity multiple
- 2.93×
- Total profit
- $59,387
- Equity at exit
- $9,511
Cash invested: $30,800 (down + closing). Projections, not guarantees.
Landlord ↔ Tenant lean methodology
- Overall (STATE)
- 87 Strongly Landlord-Friendly
- State Tennessee
- 87 Strongly Landlord-Friendly · R+13
- County
- — inherits STATE
- City
- — inherits STATE
ZIP-level market 37406
- Home prices YoY
- -23.8%
- Rents YoY
- 5.1%
- Active inventory
- 127
- Price-to-rent
- 6.7×
Monthly cashflow live
- Estimated rent
- $1,367 high interval (Pro) →
- Mortgage (P&I)
- −$577
- Tax from tax record
- −$22 /mo · $270/yr
- Insurance
- −$46
- HOA
- −$0
- Vacancy / Maint / Mgmt
- −$287
- Net cashflow
- $434
Break-even live
UW: 25.0% down · 7.5% · 30yr · 1.5% tax · 5.0% vac · 8.0% maint · 8.0% mgmt
Financing live
Cash to close
- Down payment
- $27,500
- Closing costs
- $3,300
- Reserves months
- —
- Total cash needed
- —
Loan-product check · same deal, 3 products live
Conventional
25% down · 7.5% · 30yr
- Down + closing
- —
- Monthly P&I
- —
- Monthly cashflow
- —
- DSCR
- —
- Eligible?
- —
Personal DTI + credit; lowest rate.
DSCR
20% down · 8.5% · 30yr
- Down + closing
- —
- Monthly P&I
- —
- Monthly cashflow
- —
- DSCR
- —
- Eligible?
- —
No personal income docs; deal must DSCR.
Hard money
10% down · 12.0% · 12mo
- Down + closing
- —
- Monthly P&I
- —
- Monthly cashflow
- —
- DSCR
- —
- Eligible?
- —
Short-term bridge; refi at stabilization.
Rent comps 30 comps
| Address | Beds | Baths | Sqft | Rent | $/sqft | DOM | Units | Dist |
|---|---|---|---|---|---|---|---|---|
| 2305 Glass St Chattanooga, TN | 2.0 | 1.0 | 738 | $1,050 | $1.42 | 23d | 1 | 0.13mi |
| 2400 Crutchfield St Chattanooga, TN | 3.0 | 1.0 | 984 | $1,200 | $1.22 | 21d | 1 | 0.15mi |
| 2603 Dodson Ave Chattanooga, TN | 4.0 | 1.0 | 1104 | $1,250 | $1.13 | 21d | 1 | 0.33mi |
| 2405 Harley St Chattanooga, TN | 2.0 | 1.0 | 700 | $1,199 | $1.71 | 13d | 1 | 0.45mi |
| 2512 Boone St Chattanooga, TN | 3.0 | 1.0 | 1060 | $1,150 | $1.08 | 13d | 1 | 0.55mi |
| 1707 Arlington Ave Unit B Chattanooga, TN | 2.0 | 1.0 | 760 | $1,000 | $1.32 | 23d | 1 | 0.56mi |
| 1706 Wheeler Ave Chattanooga, TN | 3.0 | 1.0 | 1317 | $1,625 | $1.23 | 23d | 1 | 0.58mi |
| 2113 Ocoee St Unit 2113 Chattanooga, TN | 2.0 | 1.0 | 780 | $950 | $1.22 | 23d | 1 | 0.58mi |
| 1601 Arlington Ave Chattanooga, TN | 3.0 | 1.0 | 1416 | $1,650 | $1.17 | 13d | 1 | 0.67mi |
| 2009 Camden St Chattanooga, TN | 3.0 | 1.5 | 1148 | $1,450 | $1.26 | 23d | 1 | 0.70mi |
| 1754 Ocoee St Chattanooga, TN | 3.0 | 1.5 | 1050 | $1,250 | $1.19 | 13d | 1 | 0.75mi |
| 1409 Bradt St Chattanooga, TN | 3.0 | 1.0 | 960 | $1,275 | $1.33 | 23d | 1 | 0.78mi |
| 3118 Noa St Chattanooga, TN | 3.0 | 2.5 | 1350 | $1,599 | $1.18 | 13d | 1 | 0.84mi |
| 3207 Curtis St Chattanooga, TN | 3.0 | 1.0 | 1128 | $1,375 | $1.22 | 23d | 1 | 0.87mi |
| 1310 Roanoke Ave Chattanooga, TN | 2.0 | 1.0 | 792 | $1,350 | $1.70 | 23d | 1 | 0.91mi |
| 1237 Wheeler Ave Unit B Chattanooga, TN | 2.0 | 1.0 | 845 | $1,125 | $1.33 | 23d | 1 | 0.96mi |
| 1301 N Orchard Knob Ave Chattanooga, TN | 2.0 | 1.0 | 864 | $1,095 | $1.27 | 23d | 1 | 0.97mi |
| 2215 Allin St Unit A Chattanooga, TN | 2.0 | 1.0 | 700 | $899 | $1.28 | 23d | 1 | 1.00mi |
| 2829 New Jersey Ave Chattanooga, TN | 3.0 | 2.0 | 1120 | $1,295 | $1.16 | 13d | 1 | 1.08mi |
| 1228 Sholar Ave Chattanooga, TN | 2.0 | 1.0 | 799 | $1,199 | $1.50 | 23d | 1 | 1.11mi |
| 1226 Sholar Ave Chattanooga, TN | 2.0 | 1.0 | 799 | $1,099 | $1.38 | 13d | 1 | 1.12mi |
| 2323 Green Forest Dr Chattanooga, TN | 2.0 | 2.5 | 1404 | $1,750 | $1.25 | 13d | 1 | 1.17mi |
| 2011 Milne St Unit b Chattanooga, TN | 3.0 | 1.0 | 976 | $1,345 | $1.38 | 13d | 1 | 1.24mi |
| 1001 N Hickory St Unit 2 Chattanooga, TN | 2.0 | 1.0 | 776 | $875 | $1.13 | 23d | 1 | 1.25mi |
| 1714 Portland St Unit C Chattanooga, TN | 2.0 | 1.0 | 700 | $1,125 | $1.61 | 23d | 1 | 1.26mi |
| 2105 Rawlings St Chattanooga, TN | 3.0 | 1.0 | 1064 | $1,300 | $1.22 | 13d | 1 | 1.29mi |
| 1800 Carson Ave Chattanooga, TN | 2.0 | 1.0 | 700 | $950 | $1.36 | 13d | 1 | 1.40mi |
| 2709 Citico Ave Chattanooga, TN | 2.0–3.0 | 1.0 | 1038 | $1,400 | $1.35 | 23d | 1 | 1.41mi |
| 2305 Citico Ave Unit A Chattanooga, TN | 2.0 | 1.0 | 748 | $1,095 | $1.46 | 13d | 1 | 1.42mi |
| 1203 Rockway Dr Unit 2 Chattanooga, TN | 2.0 | 1.0 | 940 | $1,250 | $1.33 | 13d | 1 | 1.50mi |
Listing history 15 events
-
2026-06-18days on market $110,000 Active 14 DOM
-
2026-06-17remarks 682-char remark
-
2026-06-17price $110,000 Active 13 DOM
-
2026-06-17days on market $125,000 Active 13 DOM
-
2026-06-16days on market $125,000 Active 12 DOM
-
2026-06-16price $125,000 Active 11 DOM
-
2026-06-15pricedays on market $130,000 Active 11 DOM
-
2026-06-14remarks 634-char remark
-
2026-06-14pricedays on market $135,000 Active 9 DOM
-
2026-06-10pricedays on market $145,000 Active 6 DOM
-
2026-06-09days on market $150,000 Active 5 DOM
-
2026-06-08pricedays on market $150,000 Active 4 DOM
-
2026-06-07days on market $155,000 Active 3 DOM
-
2026-06-05remarks 487-char remark
-
2026-06-05$155,000 Active 1 DOM
ⓘ Source: listings_history table (triggers on properties + properties_extension) + one-shot
backfill from property_details.listing_events for pre-trigger history.
Tax reassessment forecast TN · Resets to sale price
- Current annual tax
- $270 · $22/mo
- Projected year-2 tax
- $781 · $65/mo
- Expected delta
- +$511/yr (+$43/mo · 189.5%)
ⓘ Screening estimate from a state-policy table — verify with the county assessor before closing.
Climate risk First Street
- Flood 5/10 Major FEMA zone X (unshaded) · 24% chance over 30 yrs
- Wildfire 3/10 Moderate
- Heat 6/10 Major 7 d/yr ≥105°F today · 19 d/yr by 30 yrs out
- Wind 4/10 Moderate 10% chance of damaging wind over 30 yrs
- Air quality 4/10 Moderate 3 unhealthy d/yr today · 4 by 30 yrs out
Nearby sold comps map
Loading sold comps map…
Walkable amenities ~0.75 mi
Loading nearby amenities…
Taxation est. · year 1
- Rental income
- $16,400
- − Mortgage interest
- −$6,162
- − Property taxes
- −$270
- − Insurance
- −$550
- − Repairs & maintenance
- −$1,312
- − Management
- −$1,312
- − Depreciation
- −$3,200
- Taxable income
- $3,594
- Est. tax owed @ 24.0%
- −$863
- After-tax cash flow
- $4,351/yr
For passive investors: Depreciation is non-cash, so a rental often shows a tax loss while cash-flowing — sheltering income. Rental losses are passive: they offset passive income freely, and up to $25,000/yr can offset ordinary (W-2) income if you actively participate and your MAGI is under $100k (phasing out to $0 by $150k); unused losses carry forward. On sale, claimed depreciation is recaptured at up to 25%, and gains may owe capital-gains tax (a 1031 exchange can defer both). Figures are a year-1 estimate at your 24.0% rate — not tax advice; consult a CPA.
Schools (NCES district)
- District
- Hamilton County
- NCES district ID
- 4701590
- Math proficiency
- 31% ▼ -10.00%
- Reading proficiency
- 31% ▼ -3.00%
- Median HH income
- $47,456
- Composite
- 26.8/100
- National rank
- #7122
- State rank
- #42 of 139 in TN
Livability — Chattanooga
- Score
- 78/100
- State rank
- #3
- US rank
- #2582
Category grades
Schools grade is shown separately in the Schools card above.
Census & demographics
- Census place
- Chattanooga, TN
- County
- Hamilton County · 312,777 people
- City population
- 131,999
- Metro
- Chattanooga, TN-GA
- Population (ZIP)
- 13,364
- Household income
- $44,850
- Rent vs Own
- Severe rent burden
- 759.0
Population outlook (Hamilton County) Hauer SSP2
- Today (2025)
- 393,784 people
- By 2030
- 412,983 · +4.9%
- By 2040
- 449,502 · +14.1%
- By 2050
- 484,341 · +23.0%
- By 2075
- 565,746 · +43.7%
- By 2100
- 618,394 · +57.0%
Race, ethnicity, and origin ACS 2023
- Neighborhood character
- Predominantly Black (70%)
- Race & ethnicity
- Black 70% White 21% Hispanic / Latino 6% Two or more races 5%
- Hispanic origin (detail)
- Puerto Rican 1%
- Common ancestry
- Italian 1% Slovak 1%
- Foreign-born
- 5% · Canada
- Languages at home
- 92% English-only · Spanish 6% Other Indo-European 1%
Political lean MEDSL · Hamilton
- 2024 margin
- R (+13.1) · D 42.7% · R 55.7% · Other 1.6%
- 2008→2024 swing
- -1.2pp toward R · 2008: -11.8pp · 2024: -13.1pp
- All cycles
- 2024: R+13.1 2020: R+9.7 2016: R+16.6 2012: R+14.8 2008: R+11.8
Not yet ingested
- Civics
- —
Market trends
- HPI YoY
- ▼ -63.73%
- Current HPI
- 203.5858
- Rent YoY
- ▲ 5.13%
- Metro
- Chattanooga, TN-GA
- State GDP YoY
- ▲ 2.78%
- F500 in state
- 22
Industry mix (Fortune 500 HQ in TN)
| Industry | F500 HQs | Revenue |
|---|---|---|
| Healthcare | 3 | $91B |
|
||
| Retail | 3 | $72B |
|
||
| Transportation / Logistics | 1 | $88B |
|
||
| Paper / Packaging | 1 | $19B |
|
||
| Insurance | 1 | $13B |
|
||
| Energy | 1 | $12B |
|
||
Price history
+1007.1% since first listed2 events — show timeline
- 2026-06-04 Listed $155,000 GCAR
- 1993-10-06 Sold (Public Records) $14,000 Public Records
Property tax history
+2.8%/yrLatest (2025): $270 · +34.0% YoY. Source: county tax records.
Cash-flow waterfall
monthlySold comps — $/sqft
last 12 mo · ≤1 miLoading sold comps…