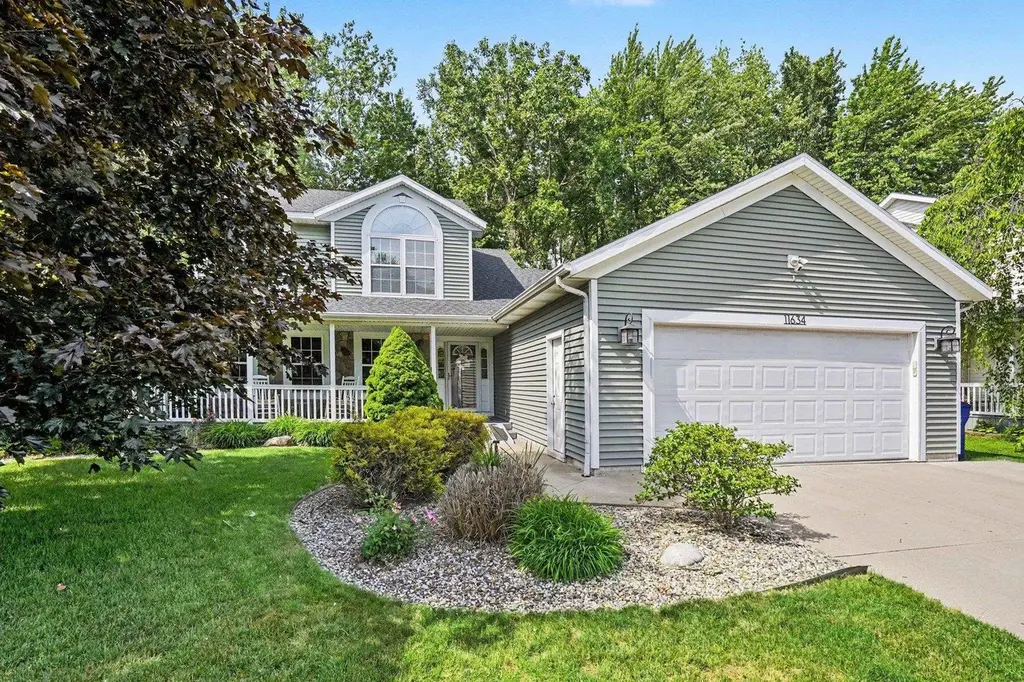
11634 Clubmoss Dr · Freeland, MI
Flood risk 1/10 · Minimal
- FEMA flood zone
- X (unshaded)
- Chance of flooding over 30 yrs
- 0.0%
- Est. flood insurance / yr
- $473 – $860
Fire risk 1/10 · Minimal
- Est. fire insurance / yr
- $784 – $1,456
Heat risk 2/10 · Minimal
- Hot days now (above 97°F)
- 7 days/yr
- Hot days in 30 yrs
- 14 days/yr
Wind risk 1/10 · Minimal
- Chance of severe wind over 30 yrs
- —
Air-quality risk 2/10 · Minimal
- Unhealthy air days now
- 1 days/yr
- Unhealthy air days in 30 yrs
- 1 days/yr
Risk factors via First Street. Map © Google.
Why this score? — see what drove the D grade
The composite is a weighted blend of 9 inputs, each scored 0–100. Each bar is that input's sub-score; the figure is the points it added to the 100-point composite (weight × sub-score).
- Cash flow +17.8/30.0
- DSCR +5.6/10.0
- Schools +5.1/10.0
- 1% rule +3.6/10.0
- Livability +3.6/5.0
- ARV discount +3.5/15.0
- Rent growth +2.5/5.0
- Condition / age +2.5/5.0
- Appreciation +0.0/10.0
$349,900
🖨 Deal sheet 📄 Offer letter ✓ Due diligence
Listing remarks MLS
PRICE REDUCED!!! 4 BR, 2 1/2 bath 2 story in newer, Freeland sub. Main floor master, with private bath. Main floor laundry and mud room, just off garage, which is finished and insulated. Hickory flooring in large living room w/ gas log fireplace. All granite counter tops, partially finished basement with bar. Enjoy your professionally landscaped yard, with sprinkler system, while relaxing on your patio, that includes a fire pit!! There are many custom features and upgrades in this Must See Charmer!
Key facts
- Main-floor laundry
- 8,712 sq ft lot
- 2 garage spots
Tags
Property features AI
Exterior
- Parking: Attached garage with electric in garage; Approximately 2.5 garage parking spaces
- Utilities: Public water; Public sanitary sewer; Natural gas heating
- Home design: Residential 2-story home; Built in 2000; Basement entry/foundation
- Construction: Vinyl siding exterior; Basement foundation; Built in 2000
- Exterior features: Vinyl siding; Patio; Porch; Lawn sprinkler; Shed/outbuilding; Subdivision lot (large lot frontage — about 70 ft)
Interior
- Kitchen: Kitchen on main level (11 x 12) with vinyl flooring; Dishwasher; Microwave; Range/Oven; Refrigerator
- Bedrooms: Main-level primary bedroom (16 x 13) with wood floors; Second-floor bedroom (17 x 11); Second-floor bedroom (approx. 12 wide); Second-floor bedroom (10 x 11)
- Flooring: Wood flooring in primary bedroom; Vinyl flooring in living room and kitchen
- Bathrooms: Two full bathrooms; One lavatory (total of three baths/lavatories); Main-level bathroom (10 x 4) with a 6 x 4 lavatory
- Heating & cooling: Forced air heating (natural gas); Central air conditioning
- Interior features: Two fireplaces (living room and basement); Full, partially finished basement
- Laundry & utility: Main-level laundry room (10 x 6) with washer and dryer
Neighborhood map
What this means for you Summary
Snapshot
- This is a 3-bed/2.5-bath single-family listed at $350k.
Deal economics
- At list price, monthly cash flow is $287 ($3k/yr) — positive.
- The deal already cash-flows at list — no discount required.
- To meet the 1% rule (rent ≥ 1% of price), the offer needs to be $300k (14.3% below list).
- Recommended offer: $300k (14.3% below list) — sets the bar for 1% rule.
- Cap rate 7.3% vs local median 3.2% in Freeland — top-decile yield for the area; either an underpriced asset or a hidden risk that comps aren't pricing in. Stress-test before assuming the spread holds.
Location & tenants
- Location reads 72/100 on livability (#230 in MI) — a middle-class / working-renter tenant base. Strengths: employment A+, cost of living A+, housing A+; Watch: health & safety C-, amenities F, commute F.
- Freeland Community School District (suburban): math 54% / reading 61% proficiency, ranked #46 of 540 in MI (top 8%) — acceptable for families but not a draw, mixed tenant base, ~2y average lease; only 15% free/reduced lunch — higher-income household profile.
- Market conditions: 94 active listings in the ZIP; 1 comparable units currently listed for rent nearby; 154 units permitted in Saginaw County in 2024 (0 in 5+ unit buildings).
Forward outlook
- Local home prices are declining (-3.0%/yr); year-one equity from $2k of loan paydown is wiped out by about $10k of value loss. Plan a longer hold.
- Saginaw County population projected at -25% by 2050 — secular population decline; favor cash flow + early exit over multi-decade hold.
Negotiation context
- Only 7 days on market — expect competitive offers; lowballing is unlikely to land.
- 7 sale attempts since 27y ago with the ask held roughly flat each time — persistent listings suggest the price (not the market) is what's stuck; bring a comps-based counter.
- Current owner paid $178k; list at $350k implies a 97% gain — meaningful room to come down on a strong offer.
Questions for the listing agent
- Is there a deadline driving the sale (1031 exchange, divorce, estate, relocation)? That informs how much negotiation room exists.
- The area grade is low — what's the realistic commute time and amenity access for the typical tenant pool here? Any planned neighborhood developments (good or bad) we should know about?
- What's the average days-on-market for RENTAL listings here right now (not sales)? A rising rental-DOM trend means longer vacancies and softer asking-rent achievability than the comps imply.
- What's the recent tenant-quality profile in this submarket — average credit score on applications, eviction rate, late-payment / NSF rate, and stable-employment percentage? A property-management company in the area should have these aggregated.
- How much new for-sale + rental construction is in the pipeline within 1–3 miles? Heavy new supply typically softens prices + rents 12–24 months out; constrained supply supports both.
Investment metrics
- 1% rule
- 0.86% ✗
- Cap rate
- 7.28%
- Cash-on-cash
- 3.52%
- DSCR
- 1.16
- GRM
- 9.7
CMA / ARV
- ARV (on-the-fly)
- $321,261
- Comps found
- 11
Show comp detail 11 sales within ~0.75 mi
| Address | Dist | Beds/Ba | Sqft | Sold | Price | $/sf | Match |
|---|---|---|---|---|---|---|---|
| S Valley Spring Ln | 0.17mi | 4/3.0 (+1) | 1,857 (0%) | 18mo | $539,960 | $291 | 70 |
| 7798 Rockcress Dr | 0.12mi | 3/2.0 | 2,026 (+9%) | 18mo | $248,500 | $123 | 62 |
| 11681 Magnolia Dr | 0.18mi | 4/2.5 (+1) | 1,936 (+4%) | 22mo | $335,000 | $173 | 61 |
| 7830 Mielke Rd | 0.17mi | 2/2.0 (-1) | 1,800 (-3%) | 23mo | $225,000 | $125 | 61 |
| 11480 Wilkinson Rd | 0.40mi | 3/2.5 | 2,086 (+12%) | 0mo | $389,000 | $186 | 61 |
| 11216 Thornberry Dr | 0.50mi | 4/3.0 (+1) | 1,784 (-4%) | 6mo | $350,000 | $196 | 58 |
| 11167 Thornberry Dr | 0.56mi | 3/2.5 | 1,884 (+2%) | 20mo | $307,500 | $163 | 54 |
| 11050 Wilkinson Rd | 0.71mi | 4/2.5 (+1) | 1,704 (-8%) | 2mo | $329,000 | $193 | 46 |
| 11901 Scott Rd | 0.64mi | 3/2.0 | 1,657 (-11%) | 8mo | $525,900 | $317 | 43 |
| 8530 Delaney Dr | 0.64mi | 4/2.0 (+1) | 1,650 (-11%) | 13mo | $219,000 | $133 | 34 |
| 7300 N Gleaner Rd | 0.70mi | 2/1.0 (-1) | 1,588 (-14%) | 22mo | $190,000 | $120 | 14 |
Match score weights: distance 35% · size 25% · config 20% · recency 20%. Top-matched comps best support the ARV.
Projected returns pro-forma
-3.0% appreciation · 3.0% rent growth · sell at horizon
- IRR
- -10.8%
- Equity multiple
- 0.61×
- Total profit
- $-38,570
- Equity at exit
- $52,171
- IRR
- -1.6%
- Equity multiple
- 0.89×
- Total profit
- $-10,689
- Equity at exit
- $30,253
Cash invested: $97,972 (down + closing). Projections, not guarantees.
Landlord ↔ Tenant lean methodology
- Overall (STATE)
- 62 Landlord-Friendly
- State Michigan
- 62 Landlord-Friendly · EVEN
- County
- — inherits STATE
- City
- — inherits STATE
ZIP-level market 48623
- Home prices YoY
- -26.7%
- Active inventory
- 94
- Price-to-rent
- 9.7×
Monthly cashflow live
- Estimated rent
- $3,000 medium interval (Pro) →
- Mortgage (P&I)
- −$1,835
- Tax from tax record
- −$102 /mo · $1,226/yr
- Insurance
- −$146
- HOA
- −$0
- Vacancy / Maint / Mgmt
- −$630
- Net cashflow
- $287
Break-even live
UW: 25.0% down · 7.5% · 30yr · 1.5% tax · 5.0% vac · 8.0% maint · 8.0% mgmt
Financing live
Cash to close
- Down payment
- $87,475
- Closing costs
- $10,497
- Reserves months
- —
- Total cash needed
- —
Loan-product check · same deal, 3 products live
Conventional
25% down · 7.5% · 30yr
- Down + closing
- —
- Monthly P&I
- —
- Monthly cashflow
- —
- DSCR
- —
- Eligible?
- —
Personal DTI + credit; lowest rate.
DSCR
20% down · 8.5% · 30yr
- Down + closing
- —
- Monthly P&I
- —
- Monthly cashflow
- —
- DSCR
- —
- Eligible?
- —
No personal income docs; deal must DSCR.
Hard money
10% down · 12.0% · 12mo
- Down + closing
- —
- Monthly P&I
- —
- Monthly cashflow
- —
- DSCR
- —
- Eligible?
- —
Short-term bridge; refi at stabilization.
Rent comps 1 comps
| Address | Beds | Baths | Sqft | Rent | $/sqft | DOM | Units | Dist |
|---|---|---|---|---|---|---|---|---|
| 8441 Cottonwood Dr Freeland, MI | 3.0 | 2.0 | 1600 | $3,000 | $1.88 | 43d | 1 | 1.32mi |
Listing history 7 events
-
2026-06-19days on market $349,900 Active 7 DOM
-
2026-06-18days on market $349,900 Active 6 DOM
-
2026-06-17days on market $349,900 Active 5 DOM
-
2026-06-16days on market $349,900 Active 4 DOM
-
2026-06-15days on market $349,900 Active 3 DOM
-
2026-06-13remarks 699-char remark
-
2026-06-13$349,900 Active 1 DOM
ⓘ Source: listings_history table (triggers on properties + properties_extension) + one-shot
backfill from property_details.listing_events for pre-trigger history.
Tax reassessment forecast MI · Partial reset (capped growth)
- Current annual tax
- $1,226 · $102/mo
- Projected year-2 tax
- $3,307 · $276/mo
- Expected delta
- +$2,081/yr (+$173/mo · 169.8%)
ⓘ Screening estimate from a state-policy table — verify with the county assessor before closing.
Climate risk First Street
- Flood 1/10 Low FEMA zone X (unshaded) · 0% chance over 30 yrs
- Wildfire 1/10 Low
- Heat 2/10 Low 7 d/yr ≥97°F today · 14 d/yr by 30 yrs out
- Wind 1/10 Low
- Air quality 2/10 Low 1 unhealthy d/yr today · 1 by 30 yrs out
Nearby sold comps map
Loading sold comps map…
Walkable amenities ~0.75 mi
Loading nearby amenities…
Taxation est. · year 1
- Rental income
- $36,000
- − Mortgage interest
- −$19,600
- − Property taxes
- −$1,226
- − Insurance
- −$1,750
- − Repairs & maintenance
- −$2,880
- − Management
- −$2,880
- − Depreciation
- −$10,179
- Taxable loss
- −$2,514
- Est. tax savings @ 24.0%
- +$603
- After-tax cash flow
- $4,049/yr
For passive investors: Depreciation is non-cash, so a rental often shows a tax loss while cash-flowing — sheltering income. Rental losses are passive: they offset passive income freely, and up to $25,000/yr can offset ordinary (W-2) income if you actively participate and your MAGI is under $100k (phasing out to $0 by $150k); unused losses carry forward. On sale, claimed depreciation is recaptured at up to 25%, and gains may owe capital-gains tax (a 1031 exchange can defer both). Figures are a year-1 estimate at your 24.0% rate — not tax advice; consult a CPA.
Schools (NCES district)
- District
- Freeland Community School District
- NCES district ID
- 2615060
- Math proficiency
- 54% ▼ -4.00%
- Reading proficiency
- 61% ▼ -3.00%
- Median HH income
- $70,875
- Composite
- 50.98/100
- National rank
- #1779
- State rank
- #46 of 540 in MI
Livability — Freeland
- Score
- 72/100
- State rank
- #230
- US rank
- #5824
Category grades
Schools grade is shown separately in the Schools card above.
Census & demographics
- Census place
- Freeland, MI
- City population
- 15,126
- Population (ZIP)
- 15,126
Population outlook (Saginaw County) Hauer SSP2
- Today (2025)
- 180,568 people
- By 2030
- 172,302 · -4.6%
- By 2040
- 153,919 · -14.8%
- By 2050
- 135,519 · -24.9%
- By 2075
- 97,199 · -46.2%
- By 2100
- 65,037 · -64.0%
Race, ethnicity, and origin ACS 2023
- Neighborhood character
- Predominantly White (86%)
- Race & ethnicity
- White 86% Two or more races 5% Black 5% Hispanic / Latino 3%
- Common ancestry
- Romanian 11% Lithuanian 5% Slovak 2%
- Foreign-born
- 0%
- Languages at home
- 97% English-only · Spanish 2%
Political lean MEDSL · Saginaw
- 2024 margin
- Toss-up / Even · D 47.7% · R 51.0% · Other 1.4%
- 2008→2024 swing
- -20.6pp toward R · 2008: 17.3pp · 2024: -3.3pp
- All cycles
- 2024: R+3.3 2020: D+0.3 2016: R+1.1 2012: D+11.9 2008: D+17.3
Not yet ingested
- Civics
- —
Market trends
- HPI YoY
- ▼ -78.02%
- Current HPI
- 213.8908
- Rent YoY
- —
- Metro
- —
- State GDP YoY
- ▲ 1.37%
- F500 in state
- 28
Industry mix (Fortune 500 HQ in MI)
| Industry | F500 HQs | Revenue |
|---|---|---|
| Automotive Parts | 3 | $48B |
|
||
| Automotive | 2 | $372B |
|
||
| Chemicals | 1 | $45B |
|
||
| Automotive Retail | 1 | $29B |
|
||
| Healthcare / Medical Devices | 1 | $23B |
|
||
| Automotive Technology | 1 | $20B |
|
||
Price history
+102.4% since first listed18 events — show timeline
- 2026-06-12 Listed $349,900 MiRealSource-MiMLS
- 2017-08-14 Sold (Public Records) $177,500 Public Records
- 2014-01-13 Sold (Public Records) $172,000 Public Records
- 2014-01-06 Sold (MLS) $172,000 MiRealSource-MiMLS
- 2014-01-06 Sold (MLS) $172,000 REALCOMP
- 2013-11-14 Listing Removed — MiRealSource-MiMLS
- 2013-09-14 Listed $179,900 MiRealSource-MiMLS
- 2013-09-14 Listed $179,900 REALCOMP
- 2000-05-04 Sold (Public Records) $168,000 Public Records
- 2000-05-04 Sold (Public Records) $28,000 Public Records
- 2000-04-27 Sold (MLS) $168,000 REALCOMP
- 2000-04-27 Sold (MLS) $168,000 MiRealSource-MiMLS
- 2000-03-15 Listed $169,900 REALCOMP
- 2000-03-15 Listed $169,900 MiRealSource-MiMLS
- 1999-12-01 Listing Removed — REALCOMP
- 1999-12-01 Listing Removed — MiRealSource-MiMLS
- 1999-11-30 Listed $172,900 REALCOMP
- 1999-11-30 Listed $172,900 MiRealSource-MiMLS
Property tax history
-6.5%/yrLatest (2025): $1,226 · -71.6% YoY. Source: county tax records.
Cash-flow waterfall
monthlySold comps — $/sqft
last 12 mo · ≤1 miLoading sold comps…