 Duplex
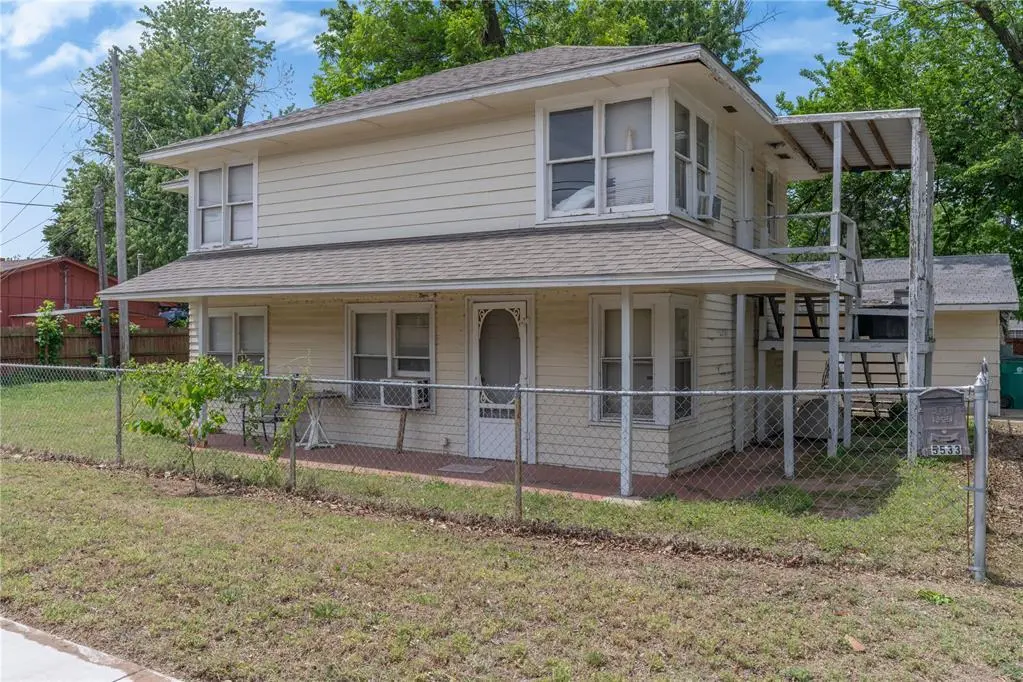
5533 S Walker Ave · Oklahoma City, OK
Flood risk 3/10 · Minor
- FEMA flood zone
- X (unshaded)
- Chance of flooding over 30 yrs
- 0.1%
- Est. flood insurance / yr
- $507 – $1,088
Fire risk 1/10 · Minimal
- Est. fire insurance / yr
- $2,463 – $4,575
Heat risk 6/10 · Moderate
- Hot days now (above 107°F)
- 7 days/yr
- Hot days in 30 yrs
- 19 days/yr
Wind risk 2/10 · Minimal
- Chance of severe wind over 30 yrs
- 4.0%
Air-quality risk 1/10 · Minimal
- Unhealthy air days now
- 0 days/yr
- Unhealthy air days in 30 yrs
- 0 days/yr
Risk factors via First Street. Map © Google.
Why this score? — see what drove the B grade
The composite is a weighted blend of 9 inputs, each scored 0–100. Each bar is that input's sub-score; the figure is the points it added to the 100-point composite (weight × sub-score).
- Cash flow +24.8/30.0
- ARV discount +10.5/15.0
- Appreciation +10.0/10.0
- DSCR +8.1/10.0
- 1% rule +6.0/10.0
- Livability +4.0/5.0
- Rent growth +3.6/5.0
- Condition / age +2.5/5.0
- Schools +0.7/10.0
$159,900
🖨 Deal sheet (PDF) 📄 Offer letter ✓ Due diligence
Multi-family units
County records classify this as Multi-Family (2-4 Unit). Listing-text estimate: 2 units. confirmed
Listing remarks MLS
Investors Special!! Great Opportunity At Great Price To Live In One & Lease One!! Includes Half Circle Drive & Detached 2 Car Garage! One Unit Down Has 2Beds & 1 Bath! One Unit Upstairs Has 2 Bed & 1 Bath! Your Own Home To Design & Fix Up To Your Own Style!!! Location Is Close To Grocery Stores, Shopping Centers & Restaurants!
Key facts
- Functional layout
- Turnkey addition
- 5,985 sq ft lot
Tags
Property features AI
Finance
- Other: Living area listed as 1,316 (assessor); Located 3 blocks north of SW 59th Street on Walker Avenue
- Financial info: Current listing price $159,900
Exterior
- Home design: Residential income property (duplex); Existing property
- Construction: Frame construction; Composition roof; Built (existing)
- Exterior features: Corner lot
Interior
- Bedrooms: Duplex with a total of 2 units
- Bathrooms: 2 full bathrooms
- Interior features: Two full bathrooms; Slab foundation
Neighborhood map
What this means for you Summary
Snapshot
- This is a 2 × 2-bed/1-bath units multifamily listed at $160k.
Deal economics
- At list price, monthly cash flow is $340 ($4k/yr) — positive. Per door: $170/mo.
- The deal already cash-flows at list — no discount required.
- Meets the 1% rule at list price ($2k rent vs $160k).
- Recommended offer: $155k (3.0% below list) — sets the bar for market timing.
Location & tenants
- Location reads 80/100 on livability (#3 in OK, #1,635 nationally) — a professional / high-income tenant draw. Strengths: amenities A+, commute A+, cost of living A+; Watch: crime F.
- Oklahoma City (urban): math 7% / reading 10% proficiency, ranked #254 of 270 in OK (top 94%) — low school quality limits family demand, transient renter base, plan for 1-2y turnover; 82% free/reduced lunch — lower-income household profile, screen leases tightly.
- Zoned schools: Fillmore Es (math 4% / reading 6%, grade F, #766 of 845 statewide, top 94%, 654 students, 0% FRL); Classen Ms of Advanced Studies (math 35% / reading 46%, grade F, #6 of 345 statewide, top 1%, 855 students, 0% FRL); Capitol Hill Hs (math 2% / reading 4%, grade F, #444 of 447 statewide, top 99%, 1,455 students, 0% FRL) — zoned schools average 0% FRL vs 82% district-wide (82 pts lower); this property's tenant base skews higher-income than the district average.
- Market conditions: Rents rising fast (+4.5%/yr); 85 active listings in the ZIP; 33 comparable units currently listed for rent nearby; rentals at typical pace (median 25d on market — plan ~3-4 weeks tenant-placement turnaround); lower-income renter base — watch delinquency; 5,365 units permitted in Oklahoma County in 2024 (569 in 5+ unit buildings).
Forward outlook
- In year one you build about $17k of equity ($1k loan paydown + $16k appreciation (10.0% local appreciation)).
- Oklahoma County population projected at +41% by 2050 — long-run rental-demand tailwind backs the buy-and-hold thesis.
- At projected returns (10.0% appreciation + 4.5% rent growth), your $45k cash investment doubles in ~3 years — after that, you're playing with house money.
- By year 3, paydown + projected appreciation supports a ~$43k cash-out refi (75% LTV) — recoverable capital for the next deal without selling this one.
Negotiation context
- It's been on market 45 days — a 3% lower offer ($155k) is reasonable based on typical stale-listing flexibility.
- 4 sale attempts since 11y ago with the ask held roughly flat each time — persistent listings suggest the price (not the market) is what's stuck; bring a comps-based counter.
- Current owner paid $110k; 45% above their basis — modest negotiation headroom, anchor on the comps not their cost.
Risks & watch-outs
- Watch-outs: built in 1946 — expect roof / HVAC / electrical / plumbing capex.
- Climate carrying-cost: extreme-heat days projected 7→19/yr by 2055 (HVAC capex compounding) — expect insurance premiums to compound above CPI over the hold.
Questions for the listing agent
- It's been on market 45 days. Have you received any prior offers? Is the seller open to a 3% concession, seller financing, or rate buy-down credit?
- Can we see the unit-by-unit rent roll, current vacancy, and any below-market leases? What's the average tenancy length?
- What capital expenditures (roof, boiler, parking lot, exteriors) have been made in the last 5 years, and what's planned in the next 2?
- Built in 1946 — when were the roof, HVAC, electrical panel, plumbing, and water heater last replaced?
- Is there a deadline driving the sale (1031 exchange, divorce, estate, relocation)? That informs how much negotiation room exists.
- Schools are F-rated, which usually means shorter tenancies and higher turnover. Who's the typical renter profile here, and what's been the actual vacancy rate?
- Crime grade is F in this area — have there been break-ins, vandalism, or insurance claims at this property in the last 3 years? What carrier currently insures it and at what premium?
- What's the average days-on-market for RENTAL listings here right now (not sales)? A rising rental-DOM trend means longer vacancies and softer asking-rent achievability than the comps imply.
- What's the recent tenant-quality profile in this submarket — average credit score on applications, eviction rate, late-payment / NSF rate, and stable-employment percentage? A property-management company in the area should have these aggregated.
- How much new apartment / multifamily construction is in the pipeline within 1–3 miles? Heavy new supply (>2% of stock underway) typically softens rents 12–24 months out; light construction supports rent growth.
Investment metrics
- 1% rule
- 1.10% ✓
- Cap rate
- 8.84%
- Cash-on-cash
- 9.11%
- DSCR
- 1.41
- GRM
- 7.6
CMA / ARV
- ARV (median comp)
- $171,179
- List price
- $159,900
- Delta
- -6.59%
- Verdict
- FAIR
- Comps
- 4 within 1.0 mi
Projected returns pro-forma
10.0% appreciation · 4.51% rent growth · sell at horizon
- IRR
- 31.6%
- Equity multiple
- 3.49×
- Total profit
- $111,450
- Equity at exit
- $144,051
- IRR
- 27.7%
- Equity multiple
- 8.08×
- Total profit
- $317,014
- Equity at exit
- $310,651
Cash invested: $44,772 (down + closing). Projections, not guarantees.
Landlord ↔ Tenant lean methodology
- Overall (STATE)
- 83 Strongly Landlord-Friendly
- State Oklahoma
- 83 Strongly Landlord-Friendly · R+20
- County
- — inherits STATE
- City
- — inherits STATE
ZIP-level market 73109
- Home prices YoY
- 9.5%
- Rents YoY
- 4.5%
- Active inventory
- 85
- Price-to-rent
- 15.1×
Monthly cashflow live
- Estimated rent
- $1,760 high interval (Pro) →
- Mortgage (P&I)
- −$839
- Tax from tax record
- −$145 /mo · $1,742/yr
- Insurance
- −$67
- HOA
- −$0
- Vacancy / Maint / Mgmt
- −$370
- Net cashflow
- $340
Break-even live
Sensitivity live
| Price | -10% $431 | -5% $385 | +0% $340 | +5% $295 | +10% $250 |
|---|---|---|---|---|---|
| Rent | -10% $201 | -5% $271 | +0% $340 | +5% $410 | +10% $479 |
| Rate | -1.0pp $421 | -0.5pp $381 | base $340 | +0.5pp $299 | +1.0pp $256 |
2-unit breakdown (identical units grouped — click to expand)
| Units | Beds | Baths | Est. rent |
|---|---|---|---|
| 2× units | 2 | 1 | $1,760 |
| #1 | 2 | 1 | $880 |
| #2 | 2 | 1 | $880 |
| Total (2 units) | $1,760 | ||
UW: 25.0% down · 7.5% · 30yr · 1.5% tax · 5.0% vac · 8.0% maint · 8.0% mgmt
Financing live
Cash to close
- Down payment
- $39,975
- Closing costs
- $4,797
- Reserves months
- —
- Total cash needed
- —
Loan-product check · same deal, 3 products live
Conventional
25% down · 7.5% · 30yr
- Down + closing
- —
- Monthly P&I
- —
- Monthly cashflow
- —
- DSCR
- —
- Eligible?
- —
Personal DTI + credit; lowest rate.
DSCR
20% down · 8.5% · 30yr
- Down + closing
- —
- Monthly P&I
- —
- Monthly cashflow
- —
- DSCR
- —
- Eligible?
- —
No personal income docs; deal must DSCR.
Hard money
10% down · 12.0% · 12mo
- Down + closing
- —
- Monthly P&I
- —
- Monthly cashflow
- —
- DSCR
- —
- Eligible?
- —
Short-term bridge; refi at stabilization.
Rent comps 33 comps
| Address | Beds | Baths | Sqft | Rent | $/sqft | DOM | Units | Dist |
|---|---|---|---|---|---|---|---|---|
| 5413 S Lee Ave Oklahoma City, OK | 3.0 | 2.0 | 1460 | $2,100 | $1.44 | 4d | 1 | 0.19mi |
| 620 SW 50th St Oklahoma City, OK | 2.0 | 1.0 | 977 | $1,100 | $1.13 | 4d | 1 | 0.38mi |
| 800 SW 52nd St Oklahoma City, OK | 2.0 | 1.0 | 920 | $995 | $1.08 | 25d | 1 | 0.40mi |
| 5113 S Sage Ave Oklahoma City, OK | 3.0 | 1.5 | 996 | $1,025 | $1.03 | 3d | 1 | 0.40mi |
| 24 SW 54th St Oklahoma City, OK | 3.0 | 1.5 | 1272 | $1,400 | $1.10 | 45d | 1 | 0.46mi |
| 733 SW 47th St Oklahoma City, OK | 3.0 | 1.5 | 1228 | $1,180 | $0.96 | 25d | 1 | 0.64mi |
| 624 SW 44th St Oklahoma City, OK | 2.0 | 1.0 | 1206 | $1,500 | $1.24 | 45d | 1 | 0.74mi |
| 632 SW 44th St Oklahoma City, OK | 2.0 | 1.0 | 958 | $1,000 | $1.04 | 5d | 1 | 0.75mi |
| 1004 SW 62nd St Oklahoma City, OK | 3.0 | 1.0 | 968 | $1,295 | $1.34 | 5d | 1 | 0.77mi |
| 4426 S Olie Ave Oklahoma City, OK | 2.0 | 2.0 | 1159 | $1,220 | $1.05 | 13d | 1 | 0.81mi |
| 625 SW 68th St Oklahoma City, OK | 3.0 | 2.0 | 1215 | $1,400 | $1.15 | 4d | 1 | 0.86mi |
| 1020 SW 65th St Oklahoma City, OK | 3.0 | 1.0 | 956 | $1,330 | $1.39 | 45d | 1 | 0.93mi |
| 7125 S Santa Fe Ave Oklahoma City, OK | 3.0 | 2.0 | 1100 | $1,200 | $1.09 | 45d | 1 | 1.07mi |
| 1112 SW 67th St Unit 4220 Oklahoma City, OK | 3.0 | 2.0 | 1300 | $1,395 | $1.07 | 5d | 1 | 1.11mi |
| 1402 SW 59th St Unit 3202 Oklahoma City, OK | 2.0 | 1.0 | 950 | $865 | $0.91 | 25d | 1 | 1.16mi |
| 1402 SW 59th St Apt 3201 Oklahoma City, OK | 2.0 | 1.0 | 950 | $865 | $0.91 | 45d | 1 | 1.16mi |
| 1402 SW 59th St Apt 1112 Oklahoma City, OK | 2.0 | 1.5 | 925 | $980 | $1.06 | 45d | 1 | 1.16mi |
| 1421 SW 52nd St Oklahoma City, OK | 3.0 | 2.0 | 1535 | $1,500 | $0.98 | 4d | 1 | 1.16mi |
| 1344 SW 62nd St Oklahoma City, OK | 3.0 | 1.0 | 878 | $1,300 | $1.48 | 4d | 1 | 1.22mi |
| 4101 S Shields Blvd Apt 3B Oklahoma City, OK | 3.0 | 2.0 | 957 | $1,025 | $1.07 | 5d | 1 | 1.25mi |
| 4101 S Shields Blvd Unit Shields 3B Oklahoma City, OK | 3.0 | 2.0 | 957 | $1,050 | $1.10 | 25d | 1 | 1.25mi |
| 1132 SW 40th St Oklahoma City, OK | 3.0 | 2.0 | 1436 | $1,350 | $0.94 | 25d | 1 | 1.25mi |
| 1433 SW 60th St Oklahoma City, OK | 3.0 | 2.0 | 942 | $1,400 | $1.49 | 45d | 1 | 1.26mi |
| 6144 Cielo Ter Oklahoma City, OK | 3.0 | 2.0 | 1149 | $1,450 | $1.26 | 4d | 1 | 1.27mi |
| 1432 SW 61st Ter Oklahoma City, OK | 3.0 | 1.5 | 891 | $1,145 | $1.29 | 45d | 1 | 1.30mi |
| 6052 Johnnie Ter Oklahoma City, OK | 3.0 | 2.0 | 1223 | $1,295 | $1.06 | 5d | 1 | 1.33mi |
| 6513 Ashby Ter Oklahoma City, OK | 3.0 | 2.0 | 1049 | $1,095 | $1.04 | 25d | 1 | 1.36mi |
| 6413 S Lindsay Ave Oklahoma City, OK | 3.0 | 1.0 | 1150 | $1,150 | $1.00 | 45d | 1 | 1.42mi |
| 717 Santa Rosa Dr Oklahoma City, OK | 1.0–3.0 | 1.0–1.5 | 1025 | $1,074 | $1.05 | 3d | 42 | 1.44mi |
| 3407 S Lee Ave Oklahoma City, OK | 2.0 | 1.0 | 900 | $980 | $1.09 | 45d | 1 | 1.44mi |
| 1105 W Interstate 240 Service Rd Unit 1111-1 Oklahoma City, OK | 2.0 | 1.0 | 950 | $895 | $0.94 | 25d | 1 | 1.45mi |
| 1105 W I-240 Service Rd Oklahoma City, OK | 2.0 | 2.0 | 1000 | $945 | $0.94 | 22d | 1 | 1.45mi |
| 1105 1/2 W Interstate 240 Service Rd Oklahoma City, OK | 1.0–2.0 | 1.0–2.0 | 875 | $945 | $1.08 | 17d | 14 | 1.45mi |
Listing history 24 events
-
2026-06-21days on market $159,900 Active 45 DOM
-
2026-06-18days on market $159,900 Active 42 DOM
-
2026-06-17days on market $159,900 Active 41 DOM
-
2026-06-16days on market $159,900 Active 40 DOM
-
2026-06-15days on market $159,900 Active 39 DOM
-
2026-06-13days on market $159,900 Active 37 DOM
-
2026-06-09days on market $159,900 Active 33 DOM
-
2026-06-08days on market $159,900 Active 32 DOM
-
2026-06-07days on market $159,900 Active 31 DOM
-
2026-06-05days on market $159,900 Active 28 DOM
-
2026-06-03days on market $159,900 Active 27 DOM
-
2026-06-02days on market $159,900 Active 26 DOM
-
2026-06-01days on market $159,900 Active 25 DOM
-
2026-05-31days on market $159,900 Active 24 DOM
-
2026-05-07$159,900 Active 527-char remark
-
2020-05-08soldstatus $110,000
-
2016-06-20soldstatus $32,500
-
2016-06-17soldstatus $32,000 Sold 358-char remark
Show marketing remark (358 chars)
Investors Special!! Great Opportunity At Great Price To Live In One & Lease One!! Includes Half Circle Drive & Detached 2 Car Garage! One Unit Down Has 2Beds & 1 Bath! One Unit Upstairs Has 2 Bed & 1 Bath! Your Own Home To Design & Fix Up To Your Own Style!!! Location Is Close To Grocery Stores, Shopping Centers & Restaurants!
-
2016-05-22status Pending 358-char remark
Show marketing remark (358 chars)
Investors Special!! Great Opportunity At Great Price To Live In One & Lease One!! Includes Half Circle Drive & Detached 2 Car Garage! One Unit Down Has 2Beds & 1 Bath! One Unit Upstairs Has 2 Bed & 1 Bath! Your Own Home To Design & Fix Up To Your Own Style!!! Location Is Close To Grocery Stores, Shopping Centers & Restaurants!
-
2016-05-06status Active 358-char remark
Show marketing remark (358 chars)
Investors Special!! Great Opportunity At Great Price To Live In One & Lease One!! Includes Half Circle Drive & Detached 2 Car Garage! One Unit Down Has 2Beds & 1 Bath! One Unit Upstairs Has 2 Bed & 1 Bath! Your Own Home To Design & Fix Up To Your Own Style!!! Location Is Close To Grocery Stores, Shopping Centers & Restaurants!
-
2016-05-01status Pending 358-char remark
Show marketing remark (358 chars)
Investors Special!! Great Opportunity At Great Price To Live In One & Lease One!! Includes Half Circle Drive & Detached 2 Car Garage! One Unit Down Has 2Beds & 1 Bath! One Unit Upstairs Has 2 Bed & 1 Bath! Your Own Home To Design & Fix Up To Your Own Style!!! Location Is Close To Grocery Stores, Shopping Centers & Restaurants!
-
2016-03-07$45,000 Active 358-char remark
Show marketing remark (358 chars)
Investors Special!! Great Opportunity At Great Price To Live In One & Lease One!! Includes Half Circle Drive & Detached 2 Car Garage! One Unit Down Has 2Beds & 1 Bath! One Unit Upstairs Has 2 Bed & 1 Bath! Your Own Home To Design & Fix Up To Your Own Style!!! Location Is Close To Grocery Stores, Shopping Centers & Restaurants!
-
2016-02-03historical
-
2015-11-07$55,000 Active
ⓘ Source: listings_history table (triggers on properties + properties_extension) + one-shot
backfill from property_details.listing_events for pre-trigger history.
Tax reassessment forecast OK · Resets to sale price
- Current annual tax
- $1,742 · $145/mo
- Projected year-2 tax
- $1,742 · $145/mo
- Expected delta
- $0/yr ($0/mo · 0.0%)
ⓘ Screening estimate from a state-policy table — verify with the county assessor before closing.
Climate risk First Street
- Flood 3/10 Moderate FEMA zone X (unshaded) · 10% chance over 30 yrs
- Wildfire 1/10 Low
- Heat 6/10 Major 7 d/yr ≥107°F today · 19 d/yr by 30 yrs out
- Wind 2/10 Low 4% chance of damaging wind over 30 yrs
- Air quality 1/10 Low 0 unhealthy d/yr today · 0 by 30 yrs out
Nearby sold comps map
Loading sold comps map…
Walkable amenities ~0.75 mi
Loading nearby amenities…
Taxation est. · year 1
- Rental income
- $21,120
- − Mortgage interest
- −$8,957
- − Property taxes
- −$1,742
- − Insurance
- −$800
- − Repairs & maintenance
- −$1,690
- − Management
- −$1,690
- − Depreciation
- −$4,652
- Taxable income
- $1,590
- Est. tax owed @ 24.0%
- −$382
- After-tax cash flow
- $3,699/yr
For passive investors: Depreciation is non-cash, so a rental often shows a tax loss while cash-flowing — sheltering income. Rental losses are passive: they offset passive income freely, and up to $25,000/yr can offset ordinary (W-2) income if you actively participate and your MAGI is under $100k (phasing out to $0 by $150k); unused losses carry forward. On sale, claimed depreciation is recaptured at up to 25%, and gains may owe capital-gains tax (a 1031 exchange can defer both). Figures are a year-1 estimate at your 24.0% rate — not tax advice; consult a CPA.
Schools (NCES district)
- District
- Oklahoma City
- NCES district ID
- 4022770
- Math proficiency
- 7% ▼ -5.00%
- Reading proficiency
- 10% ▼ -6.00%
- Median HH income
- $35,606
- Composite
- 7.0/100
- National rank
- #9970
- State rank
- #254 of 270 in OK
Livability — Oklahoma City
- Score
- 80/100
- State rank
- #3
- US rank
- #1635
Category grades
Schools grade is shown separately in the Schools card above.
Census & demographics
- Census place
- Oklahoma City, OK
- County
- Oklahoma County · 771,644 people
- City population
- 498,656
- Metro
- Oklahoma City, OK
- Population (ZIP)
- 21,378
- Household income
- $43,133
- Rent vs Own
- Severe rent burden
- 1473.0
Population outlook (Oklahoma County) Hauer SSP2
- Today (2025)
- 911,875 people
- By 2030
- 982,413 · +7.7%
- By 2040
- 1,130,468 · +24.0%
- By 2050
- 1,288,422 · +41.3%
- By 2075
- 1,711,482 · +87.7%
- By 2100
- 2,088,448 · +129.0%
Race, ethnicity, and origin ACS 2023
- Neighborhood character
- Diverse neighborhood (Simpson 0.55)
- Race & ethnicity
- Hispanic / Latino 62% Two or more races 24% White 23% Black 9% Native American 5%
- Hispanic origin (detail)
- Mexican 58%
- Common ancestry
- Italian 1% Hispanic 1% Scottish 1%
- Foreign-born
- 26% · Canada
- Languages at home
- 49% English-only · Spanish 50% Other Asian/Pacific 0%
Political lean MEDSL · Oklahoma
- 2024 margin
- Toss-up / Even · D 48.0% · R 49.7% · Other 2.3%
- 2008→2024 swing
- +15.1pp toward D · 2008: -16.8pp · 2024: -1.7pp
- All cycles
- 2024: R+1.7 2020: R+1.1 2016: R+10.5 2012: R+16.7 2008: R+16.8
Not yet ingested
- Civics
- —
Market trends
- HPI YoY
- ▲ 23.48%
- Current HPI
- 270.5333
- Rent YoY
- ▲ 4.51%
- Metro
- Oklahoma City, OK
- State GDP YoY
- ▲ 1.55%
- F500 in state
- 6
Industry mix (Fortune 500 HQ in OK)
| Industry | F500 HQs | Revenue |
|---|---|---|
| Energy | 3 | $48B |
|
||
Price history
+190.7% since first listed10 events — show timeline
- 2026-05-07 Listed $159,900 MLSOK
- 2020-05-08 Sold (Public Records) $110,000 Public Records
- 2016-06-20 Sold (Public Records) $32,500 Public Records
- 2016-06-17 Sold (MLS) $32,000 MLSOK
- 2016-05-22 Pending — MLSOK
- 2016-05-06 Relisted — MLSOK
- 2016-05-01 Pending — MLSOK
- 2016-03-07 Listed $45,000 MLSOK
- 2016-02-03 Listing Removed — MLSOK
- 2015-11-07 Listed $55,000 MLSOK
Property tax history
+9.9%/yrLatest (2025): $1,742 · +4.4% YoY. Source: county tax records.
Cash-flow waterfall
monthlySold comps — $/sqft
last 12 mo · ≤1 miLoading sold comps…