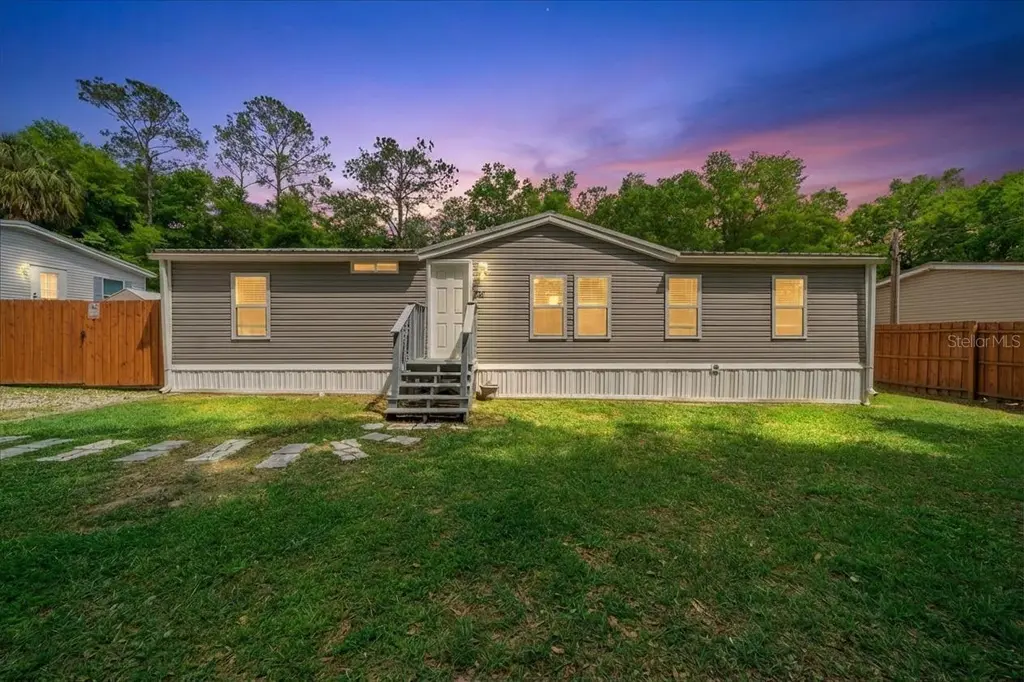
3901 SE 56th Ave · Silver Springs Shores, FL
Flood risk 4/10 · Minor
- FEMA flood zone
- X (unshaded)
- Chance of flooding over 30 yrs
- 0.24%
- Est. flood insurance / yr
- $507 – $1,088
Fire risk 4/10 · Minor
- Est. fire insurance / yr
- $947 – $1,759
Heat risk 8/10 · Major
- Hot days now (above 108°F)
- 7 days/yr
- Hot days in 30 yrs
- 21 days/yr
Wind risk 9/10 · Severe
- Chance of severe wind over 30 yrs
- 99.0%
Air-quality risk 3/10 · Minor
- Unhealthy air days now
- 3 days/yr
- Unhealthy air days in 30 yrs
- 4 days/yr
Risk factors via First Street. Map © Google.
Why this score? — see what drove the D grade
The composite is a weighted blend of 9 inputs, each scored 0–100. Each bar is that input's sub-score; the figure is the points it added to the 100-point composite (weight × sub-score).
- Cash flow +13.6/30.0
- ARV discount +7.5/15.0
- DSCR +4.1/10.0
- Schools +3.6/10.0
- 1% rule +3.5/10.0
- Livability +3.4/5.0
- Rent growth +3.2/5.0
- Condition / age +2.5/5.0
- Appreciation +0.0/10.0
$170,000
🖨 Deal sheet (PDF) 📄 Offer letter ✓ Due diligence
Listing remarks MLS
Do not wait on this completely remodeled 3 bedroom 2 bath adorable open floor plan home!!! Comes complete with custom cabinets, Granite counter tops, LVP flooring, New roof and AC guts.
Key facts
- 0.24 acre lot
- Built 1992
- Listed 37 days
Property features AI
Finance
- Other: Homestead exempt
- Financial info:
- HOA & community: No association
Exterior
- Parking:
- Security:
- Utilities: Well water; Septic tank; Electricity connected (public)
- Home design: Manufactured double-wide home; Single story; Faces west
- Construction: Vinyl siding; Metal roof; Crawlspace foundation; Built as a double wide manufactured home
- Exterior features: Covered patio/porch; Deck; Playground; Wood fencing; Cleared, level, private lot; Dirt road access
Interior
- Kitchen: Dishwasher; Range; Microwave; Refrigerator; Solid surface counters
- Bedrooms: 3 bedrooms
- Flooring: Laminate
- Bathrooms: 2 full bathrooms
- Heating & cooling: Central heating; Central air conditioning
- Interior features: Cathedral ceilings; Ceiling fans; Formal dining area; Open floorplan; Solid surface counters; Split bedroom layout
- Laundry & utility: Washer; Dryer; Indoor laundry
Neighborhood map
What this means for you Summary
Snapshot
- This is a 3-bed/2.0-bath manufactured listed at $170k.
Deal economics
- At list price, monthly cash flow is $10 ($126/yr) — positive.
- The deal already cash-flows at list — no discount required.
- To meet the 1% rule (rent ≥ 1% of price), the offer needs to be $144k (15.5% below list).
- Recommended offer: $144k (15.5% below list) — sets the bar for 1% rule.
- Cap rate 6.4% vs local median 4.8% in Silver Springs Shores — top-decile yield for the area; either an underpriced asset or a hidden risk that comps aren't pricing in. Stress-test before assuming the spread holds.
Location & tenants
- Location reads 68/100 on livability (#527 in FL) — a middle-class / working-renter tenant base. Strengths: cost of living A+, housing A+, health & safety A-; Watch: crime C-, employment D, amenities F.
- Marion (rural): math 42% / reading 43% proficiency, ranked #61 of 73 in FL (top 84%) — families likely to look elsewhere, expect single-tenant / working-renter base with shorter leases; 61% free/reduced lunch — lower-income household profile, screen leases tightly.
- Zoned schools: Maplewood Elementary School (math 63% / reading 47%, grade C, #872 of 2,144 statewide, top 42%, 817 students, 56% FRL); Osceola Middle School (math 60% / reading 58%, grade B, #144 of 571 statewide, top 26%, 999 students, 44% FRL); Forest High School (math 36% / reading 54%, grade D-, #228 of 667 statewide, top 35%, 2,325 students, 42% FRL).
- Market conditions: Rents rising (+2.8%/yr); 350 active listings in the ZIP; 15 comparable units currently listed for rent nearby; rentals at typical pace (median 23d on market — plan ~3-4 weeks tenant-placement turnaround); solid renter incomes; 7,071 units permitted in Marion County in 2024 (534 in 5+ unit buildings).
Forward outlook
- Local home prices are declining (-3.0%/yr); year-one equity from $1k of loan paydown is wiped out by about $5k of value loss. Plan a longer hold.
- Marion County population projected at +13% by 2050 — modest demand growth; plan on rents tracking national, not racing it.
Negotiation context
- It's been on market 37 days — a 3% lower offer ($165k) is reasonable based on typical stale-listing flexibility.
- 8 sale attempts since 21y ago with the ask held roughly flat each time — persistent listings suggest the price (not the market) is what's stuck; bring a comps-based counter.
Risks & watch-outs
- Climate carrying-cost: severe wind risk, 99% chance of damaging wind over 30y; extreme-heat days projected 7→21/yr by 2055 (HVAC capex compounding) — expect insurance premiums to compound above CPI over the hold.
Questions for the listing agent
- It's been on market 37 days. Have you received any prior offers? Is the seller open to a 15% concession, seller financing, or rate buy-down credit?
- Is there a deadline driving the sale (1031 exchange, divorce, estate, relocation)? That informs how much negotiation room exists.
- Schools are F-rated, which usually means shorter tenancies and higher turnover. Who's the typical renter profile here, and what's been the actual vacancy rate?
- The area grade is low — what's the realistic commute time and amenity access for the typical tenant pool here? Any planned neighborhood developments (good or bad) we should know about?
- What's the average days-on-market for RENTAL listings here right now (not sales)? A rising rental-DOM trend means longer vacancies and softer asking-rent achievability than the comps imply.
- What's the recent tenant-quality profile in this submarket — average credit score on applications, eviction rate, late-payment / NSF rate, and stable-employment percentage? A property-management company in the area should have these aggregated.
- How much new for-sale + rental construction is in the pipeline within 1–3 miles? Heavy new supply typically softens prices + rents 12–24 months out; constrained supply supports both.
Investment metrics
- 1% rule
- 0.85% ✗
- Cap rate
- 6.37%
- Cash-on-cash
- 0.26%
- DSCR
- 1.01
- GRM
- 9.9
CMA / ARV
No comps found within radius.
Projected returns pro-forma
-3.0% appreciation · 2.84% rent growth · sell at horizon
- IRR
- -16.1%
- Equity multiple
- 0.43×
- Total profit
- $-27,121
- Equity at exit
- $25,348
- IRR
- -8.0%
- Equity multiple
- 0.50×
- Total profit
- $-23,741
- Equity at exit
- $14,698
Cash invested: $47,600 (down + closing). Projections, not guarantees.
Landlord ↔ Tenant lean methodology
- Overall (STATE)
- 87 Strongly Landlord-Friendly
- State Florida
- 87 Strongly Landlord-Friendly · R+3
- County
- — inherits STATE
- City
- — inherits STATE
ZIP-level market 34480
- Home prices YoY
- -28.7%
- Rents YoY
- 2.8%
- Active inventory
- 350
- Price-to-rent
- 9.9×
Monthly cashflow live
- Estimated rent
- $1,437 high interval (Pro) →
- Mortgage (P&I)
- −$891
- Tax from tax record
- −$162 /mo · $1,945/yr
- Insurance
- −$71
- HOA
- −$0
- Vacancy / Maint / Mgmt
- −$302
- Net cashflow
- $10
Break-even live
Sensitivity live
| Price | -10% $107 | -5% $59 | +0% $10 | +5% $-38 | +10% $-86 |
|---|---|---|---|---|---|
| Rent | -10% $-103 | -5% $-46 | +0% $10 | +5% $67 | +10% $124 |
| Rate | -1.0pp $96 | -0.5pp $54 | base $10 | +0.5pp $-34 | +1.0pp $-78 |
UW: 25.0% down · 7.5% · 30yr · 1.5% tax · 5.0% vac · 8.0% maint · 8.0% mgmt
Financing live
Cash to close
- Down payment
- $42,500
- Closing costs
- $5,100
- Reserves months
- —
- Total cash needed
- —
Loan-product check · same deal, 3 products live
Conventional
25% down · 7.5% · 30yr
- Down + closing
- —
- Monthly P&I
- —
- Monthly cashflow
- —
- DSCR
- —
- Eligible?
- —
Personal DTI + credit; lowest rate.
DSCR
20% down · 8.5% · 30yr
- Down + closing
- —
- Monthly P&I
- —
- Monthly cashflow
- —
- DSCR
- —
- Eligible?
- —
No personal income docs; deal must DSCR.
Hard money
10% down · 12.0% · 12mo
- Down + closing
- —
- Monthly P&I
- —
- Monthly cashflow
- —
- DSCR
- —
- Eligible?
- —
Short-term bridge; refi at stabilization.
Rent comps 15 comps
| Address | Beds | Baths | Sqft | Rent | $/sqft | DOM | Units | Dist |
|---|---|---|---|---|---|---|---|---|
| 5370 SE 30th Pl Unit Greenfields C Ocala, FL | 2.0 | 2.0 | 1000 | $1,150 | $1.15 | 23d | 1 | 0.64mi |
| 3030 SE 53rd Ct Unit B Ocala, FL | 2.0 | 2.0 | 854 | $1,150 | $1.35 | 23d | 1 | 0.70mi |
| 3030 SE 53rd Ct Unit A Ocala, FL | 2.0 | 2.0 | 854 | $1,200 | $1.41 | 15d | 1 | 0.70mi |
| 5230 SE 31st St Unit Whispering Sands D Ocala, FL | 2.0 | 1.5 | 1000 | $1,050 | $1.05 | 23d | 1 | 0.70mi |
| 5200 SE 31st St Unit D Ocala, FL | 2.0 | 1.5 | 945 | $1,250 | $1.32 | 23d | 1 | 0.72mi |
| 2955 SE 53rd Ct Unit C Ocala, FL | 2.0 | 2.0 | 854 | $1,295 | $1.52 | 23d | 1 | 0.73mi |
| 5435 SE 28th Ln Ocala, FL | 2.0 | 2.0 | 868 | $1,150 | $1.32 | 23d | 1 | 0.75mi |
| 5011 SE 29th St Apt C Ocala, FL | 2.0 | 1.0 | 1000 | $990 | $0.99 | 15d | 1 | 0.93mi |
| 9 Banyan Course Run Ocala, FL | 3.0 | 2.0 | 1345 | $1,599 | $1.19 | 23d | 1 | 0.95mi |
| 62 Teak Loop Ocala, FL | 3.0 | 1.0 | 1018 | $1,450 | $1.42 | 15d | 1 | 1.10mi |
| 5614 Pecan Rd Ocala, FL | 3.0 | 2.0 | 1337 | $1,595 | $1.19 | 23d | 1 | 1.16mi |
| 13 Redwood Trace Ln Ocala, FL | 3.0 | 2.0 | 1337 | $1,595 | $1.19 | 23d | 1 | 1.19mi |
| 19 Pecan Pass Ter Ocala, FL | 3.0 | 2.0 | 1368 | $1,750 | $1.28 | 23d | 1 | 1.30mi |
| 4549 SE 25th Loop Ocala, FL | 3.0 | 2.0 | 1490 | $1,850 | $1.24 | 23d | 1 | 1.33mi |
| 9 Dogwood Trail Dr Ocala, FL | 3.0 | 2.0 | 1110 | $1,595 | $1.44 | 23d | 1 | 1.37mi |
Listing history 20 events
-
2026-05-08status Pending
-
2026-04-01$170,000 Active
-
2026-03-24status Active
-
2026-03-24historical
-
2026-03-19status Pending
-
2026-02-17price $170,000
-
2026-01-30$180,000 Active
-
2022-05-02soldstatus $160,000
-
2022-04-29soldstatus $160,000 Closed 185-char remark
Show marketing remark (185 chars)
Do not wait on this completely remodeled 3 bedroom 2 bath adorable open floor plan home!!! Comes complete with custom cabinets, Granite counter tops, LVP flooring, New roof and AC guts.
-
2022-04-05status Pending 185-char remark
Show marketing remark (185 chars)
Do not wait on this completely remodeled 3 bedroom 2 bath adorable open floor plan home!!! Comes complete with custom cabinets, Granite counter tops, LVP flooring, New roof and AC guts.
-
2022-03-15status Active 185-char remark
Show marketing remark (185 chars)
Do not wait on this completely remodeled 3 bedroom 2 bath adorable open floor plan home!!! Comes complete with custom cabinets, Granite counter tops, LVP flooring, New roof and AC guts.
-
2022-02-22status Pending 185-char remark
Show marketing remark (185 chars)
Do not wait on this completely remodeled 3 bedroom 2 bath adorable open floor plan home!!! Comes complete with custom cabinets, Granite counter tops, LVP flooring, New roof and AC guts.
-
2022-02-18status Active 185-char remark
Show marketing remark (185 chars)
Do not wait on this completely remodeled 3 bedroom 2 bath adorable open floor plan home!!! Comes complete with custom cabinets, Granite counter tops, LVP flooring, New roof and AC guts.
-
2022-02-17status Pending 185-char remark
Show marketing remark (185 chars)
Do not wait on this completely remodeled 3 bedroom 2 bath adorable open floor plan home!!! Comes complete with custom cabinets, Granite counter tops, LVP flooring, New roof and AC guts.
-
2022-02-17status Active 185-char remark
Show marketing remark (185 chars)
Do not wait on this completely remodeled 3 bedroom 2 bath adorable open floor plan home!!! Comes complete with custom cabinets, Granite counter tops, LVP flooring, New roof and AC guts.
-
2022-02-13status Pending 185-char remark
Show marketing remark (185 chars)
Do not wait on this completely remodeled 3 bedroom 2 bath adorable open floor plan home!!! Comes complete with custom cabinets, Granite counter tops, LVP flooring, New roof and AC guts.
-
2022-02-10$169,000 Active 185-char remark
Show marketing remark (185 chars)
Do not wait on this completely remodeled 3 bedroom 2 bath adorable open floor plan home!!! Comes complete with custom cabinets, Granite counter tops, LVP flooring, New roof and AC guts.
-
2017-08-14soldstatus $45,000
-
2006-10-31historical
-
2005-10-11$34,900
ⓘ Source: listings_history table (triggers on properties + properties_extension) + one-shot
backfill from property_details.listing_events for pre-trigger history.
Tax reassessment forecast FL · Resets to sale price
- Current annual tax
- $1,945 · $162/mo
- Projected year-2 tax
- $1,945 · $162/mo
- Expected delta
- $0/yr ($0/mo · 0.0%)
ⓘ Screening estimate from a state-policy table — verify with the county assessor before closing.
Climate risk First Street
- Flood 4/10 Moderate FEMA zone X (unshaded) · 24% chance over 30 yrs
- Wildfire 4/10 Moderate
- Heat 8/10 Severe 7 d/yr ≥108°F today · 21 d/yr by 30 yrs out
- Wind 9/10 Extreme 99% chance of damaging wind over 30 yrs
- Air quality 3/10 Moderate 3 unhealthy d/yr today · 4 by 30 yrs out
Nearby sold comps map
Loading sold comps map…
Walkable amenities ~0.75 mi
Loading nearby amenities…
Taxation est. · year 1
- Rental income
- $17,239
- − Mortgage interest
- −$9,523
- − Property taxes
- −$1,945
- − Insurance
- −$850
- − Repairs & maintenance
- −$1,379
- − Management
- −$1,379
- − Depreciation
- −$4,945
- Taxable loss
- −$2,783
- Est. tax savings @ 24.0%
- +$668
- After-tax cash flow
- $793/yr
For passive investors: Depreciation is non-cash, so a rental often shows a tax loss while cash-flowing — sheltering income. Rental losses are passive: they offset passive income freely, and up to $25,000/yr can offset ordinary (W-2) income if you actively participate and your MAGI is under $100k (phasing out to $0 by $150k); unused losses carry forward. On sale, claimed depreciation is recaptured at up to 25%, and gains may owe capital-gains tax (a 1031 exchange can defer both). Figures are a year-1 estimate at your 24.0% rate — not tax advice; consult a CPA.
Schools (NCES district)
- District
- Marion
- NCES district ID
- 1201260
- Math proficiency
- 42% ▼ -7.00%
- Reading proficiency
- 43% ▼ -4.00%
- Median HH income
- $40,015
- Composite
- 35.61/100
- National rank
- #4890
- State rank
- #61 of 73 in FL
Livability — Silver Springs Shores
- Score
- 68/100
- State rank
- #527
- US rank
- #9854
Category grades
Schools grade is shown separately in the Schools card above.
Census & demographics
- County
- Marion County · 315,796 people
- City population
- 34,665
- Metro
- Ocala, FL
- Population (ZIP)
- 23,517
- Household income
- $77,557
- Rent vs Own
- Severe rent burden
- 169.0
Population outlook (Marion County) Hauer SSP2
- Today (2025)
- 365,905 people
- By 2030
- 376,768 · +3.0%
- By 2040
- 396,555 · +8.4%
- By 2050
- 412,723 · +12.8%
- By 2075
- 446,090 · +21.9%
- By 2100
- 436,193 · +19.2%
Race, ethnicity, and origin ACS 2023
- Neighborhood character
- Predominantly White (73%)
- Race & ethnicity
- White 73% Hispanic / Latino 15% Two or more races 11% Black 6% Asian 2%
- Hispanic origin (detail)
- Mexican 3% Puerto Rican 5% Cuban 2% Dominican 2%
- Common ancestry
- Italian 3% Slovak 3% Lithuanian 2%
- Foreign-born
- 6% · Canada
- Languages at home
- 89% English-only · Spanish 9% Other Asian/Pacific 1%
Political lean MEDSL · Marion
- 2024 margin
- Solid R (+31.6) · D 33.8% · R 65.5%
- 2008→2024 swing
- -20.0pp toward R · 2008: -11.6pp · 2024: -31.6pp
- All cycles
- 2024: R+31.6 2020: R+25.9 2016: R+26.2 2012: R+16.2 2008: R+11.6
Not yet ingested
- Civics
- —
Market trends
- HPI YoY
- ▼ -85.60%
- Current HPI
- 212.4262
- Rent YoY
- ▲ 2.84%
- Metro
- Ocala, FL
- State GDP YoY
- ▲ 3.28%
- F500 in state
- 36
Industry mix (Fortune 500 HQ in FL)
| Industry | F500 HQs | Revenue |
|---|---|---|
| Industrial Technology | 2 | $29B |
|
||
| Insurance | 2 | $17B |
|
||
| Retail | 1 | $60B |
|
||
| Technology Distribution | 1 | $58B |
|
||
| Homebuilding | 1 | $35B |
|
||
| Technology Manufacturing | 1 | $35B |
|
||
Price history
+387.1% since first listed20 events — show timeline
- 2026-05-08 Pending — Stellar MLS as Distributed by MLS Grid
- 2026-04-01 Listed $170,000 Stellar MLS as Distributed by MLS Grid
- 2026-03-24 Relisted — Stellar MLS as Distributed by MLS Grid
- 2026-03-24 Listing Removed — Stellar MLS as Distributed by MLS Grid
- 2026-03-19 Pending — Stellar MLS as Distributed by MLS Grid
- 2026-02-17 Price Changed $170,000 Stellar MLS as Distributed by MLS Grid
- 2026-01-30 Listed $180,000 Stellar MLS as Distributed by MLS Grid
- 2022-05-02 Sold (Public Records) $160,000 Public Records
- 2022-04-29 Sold (MLS) $160,000 Stellar MLS as Distributed by MLS Grid
- 2022-04-05 Pending — Stellar MLS as Distributed by MLS Grid
- 2022-03-15 Relisted — Stellar MLS as Distributed by MLS Grid
- 2022-02-22 Pending — Stellar MLS as Distributed by MLS Grid
- 2022-02-18 Relisted — Stellar MLS as Distributed by MLS Grid
- 2022-02-17 Pending — Stellar MLS as Distributed by MLS Grid
- 2022-02-17 Relisted — Stellar MLS as Distributed by MLS Grid
- 2022-02-13 Pending — Stellar MLS as Distributed by MLS Grid
- 2022-02-10 Listed $169,000 Stellar MLS as Distributed by MLS Grid
- 2017-08-14 Sold (Public Records) $45,000 Public Records
- 2006-10-31 Listing Removed — Stellar MLS as Distributed by MLS Grid
- 2005-10-11 Listed $34,900 Stellar MLS as Distributed by MLS Grid
Property tax history
+9.3%/yrLatest (2025): $1,945 · +16.2% YoY. Source: county tax records.
Cash-flow waterfall
monthlySold comps — $/sqft
last 12 mo · ≤1 miLoading sold comps…