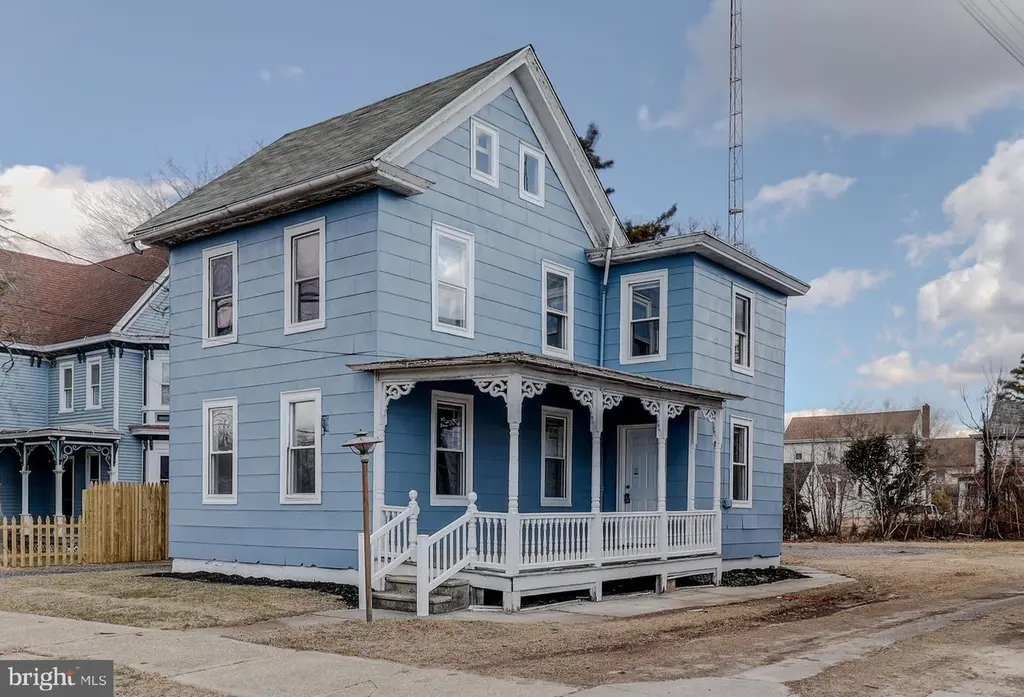
1908 North Ave · Port Norris, NJ
Flood risk 6/10 · Moderate
- FEMA flood zone
- X (shaded)
- Chance of flooding over 30 yrs
- 0.57%
- Est. flood insurance / yr
- $507 – $1,088
Fire risk 4/10 · Minor
- Est. fire insurance / yr
- $526 – $976
Heat risk 8/10 · Major
- Hot days now (above 102°F)
- 7 days/yr
- Hot days in 30 yrs
- 16 days/yr
Wind risk 8/10 · Major
- Chance of severe wind over 30 yrs
- 80.0%
Air-quality risk 6/10 · Moderate
- Unhealthy air days now
- 7 days/yr
- Unhealthy air days in 30 yrs
- 11 days/yr
Risk factors via First Street. Map © Google.
Why this score? — see what drove the C- grade
The composite is a weighted blend of 9 inputs, each scored 0–100. Each bar is that input's sub-score; the figure is the points it added to the 100-point composite (weight × sub-score).
- Cash flow +15.8/30.0
- ARV discount +11.4/15.0
- DSCR +4.9/10.0
- Appreciation +4.8/10.0
- 1% rule +4.5/10.0
- Livability +2.9/5.0
- Rent growth +2.5/5.0
- Condition / age +2.5/5.0
- Schools +1.5/10.0
$187,500
🖨 Deal sheet (PDF) 📄 Offer letter ✓ Due diligence
Listing remarks MLS
Welcome to 1908 North Ave – a beautifully renovated home designed for modern living! This stunning residence has been completely updated with brand-new finishes throughout, including gorgeous new flooring, a stylish kitchen with contemporary upgrades, and elegantly remodeled bathrooms. There is also a new septic. Every detail has been thoughtfully designed to create a space that feels fresh, inviting, and move-in ready. Don’t miss your chance to make this exceptional home your own—schedule a showing today!
Key facts
- Renovated home
- New septic
- New flooring
Tags
Neighborhood map
What this means for you Summary
Snapshot
- This is a 3-bed/1.0-bath single-family listed at $188k.
Deal economics
- At list price, monthly cash flow is $85 ($1k/yr) — positive.
- The deal already cash-flows at list — no discount required.
- To meet the 1% rule (rent ≥ 1% of price), the offer needs to be $178k (5.1% below list).
- Recommended offer: $176k (6.0% below list) — sets the bar for market timing.
Location & tenants
- Location reads 58/100 on livability (#508 in NJ) — a working-class tenant base; expect higher turnover. Strengths: crime A+; Watch: schools F, amenities F, commute F.
- Commercial Township School District (rural): math 5% / reading 29% proficiency, ranked #449 of 472 in NJ (top 95%) — low school quality limits family demand, transient renter base, plan for 1-2y turnover; 65% free/reduced lunch — lower-income household profile, screen leases tightly.
- Market conditions: 24 active listings in the ZIP; 216 units permitted in Cumberland County in 2024 (73 in 5+ unit buildings).
Forward outlook
- In year one you build about $611 of equity ($1k loan paydown + $-685 appreciation (-0.4% local appreciation)).
- Cumberland County population projected to shrink 7% by 2050 — rents likely to lag national; underwrite the cash flow, not the appreciation.
Negotiation context
- It's been on market 61 days — a 6% lower offer ($176k) is reasonable based on typical stale-listing flexibility.
- 6 sale attempts since 2y ago; this cycle's ask has dropped $12k (6%) from the opening price — seller is motivated, your offer sets the floor, not the list.
- Current owner paid $70k; list at $188k implies a 168% gain — meaningful room to come down on a strong offer.
Risks & watch-outs
- Watch-outs: built in 1920 — expect roof / HVAC / electrical / plumbing capex.
- Climate carrying-cost: major flood risk; severe wind risk, 80% chance of damaging wind over 30y; extreme-heat days projected 7→16/yr by 2055 (HVAC capex compounding) — expect insurance premiums to compound above CPI over the hold.
Questions for the listing agent
- It's been on market 61 days. Have you received any prior offers? Is the seller open to a 6% concession, seller financing, or rate buy-down credit?
- Built in 1920 — when were the roof, HVAC, electrical panel, plumbing, and water heater last replaced?
- Why hasn't it sold? Are there any deal-killer items the seller is aware of (foundation, flood, title, zoning, code violations)?
- Is there a deadline driving the sale (1031 exchange, divorce, estate, relocation)? That informs how much negotiation room exists.
- Schools are F-rated, which usually means shorter tenancies and higher turnover. Who's the typical renter profile here, and what's been the actual vacancy rate?
- What's the average days-on-market for RENTAL listings here right now (not sales)? A rising rental-DOM trend means longer vacancies and softer asking-rent achievability than the comps imply.
- What's the recent tenant-quality profile in this submarket — average credit score on applications, eviction rate, late-payment / NSF rate, and stable-employment percentage? A property-management company in the area should have these aggregated.
- How much new for-sale + rental construction is in the pipeline within 1–3 miles? Heavy new supply typically softens prices + rents 12–24 months out; constrained supply supports both.
Investment metrics
- 1% rule
- 0.95% ✗
- Cap rate
- 6.84%
- Cash-on-cash
- 1.95%
- DSCR
- 1.09
- GRM
- 8.8
CMA / ARV
- ARV (median comp)
- $205,311
- List price
- $187,500
- Delta
- -8.68%
- Verdict
- FAIR
- Comps
- 20 within 1.0 mi
Show comp detail 12 sales within ~0.75 mi
| Address | Dist | Beds/Ba | Sqft | Sold | Price | $/sf | Match |
|---|---|---|---|---|---|---|---|
| 6817 Brown St | 0.29mi | 3/1.0 | 1,584 (0%) | 1mo | $60,000 | $38 | 86 |
| 6704 Chestnut St | 0.42mi | 3/1.0 | 1,618 (+2%) | 6mo | $51,000 | $32 | 72 |
| 1679 Main St | 0.53mi | 3/1.0 | 1,571 (-1%) | 5mo | $50,000 | $32 | 70 |
| 2533 High St | 0.43mi | 3/1.5 | 1,686 (+6%) | 2mo | $261,000 | $155 | 66 |
| 2406 Market St | 0.42mi | 4/1.0 (+1) | 1,544 (-2%) | 8mo | $135,000 | $87 | 64 |
| 6824 Brown St | 0.26mi | 3/1.5 | 1,688 (+7%) | 17mo | $275,000 | $163 | 61 |
| 6610 Brown St | 0.46mi | 3/2.0 | 1,524 (-4%) | 14mo | $302,000 | $198 | 56 |
| 2310 Bacon St | 0.49mi | 3/2.0 | 1,508 (-5%) | 13mo | $276,000 | $183 | 54 |
| 2400 Maurice St | 0.22mi | 4/3.0 (+1) | 1,736 (+10%) | 9mo | $338,000 | $195 | 53 |
| 2409 Market St | 0.44mi | 3/2.0 | 1,464 (-8%) | 13mo | $245,000 | $167 | 52 |
| 2311 Church St | 0.58mi | 3/2.0 | 1,456 (-8%) | 5mo | $290,000 | $199 | 51 |
| 6311 Brown St | 0.68mi | 3/1.0 | 1,736 (+10%) | 11mo | $147,500 | $85 | 43 |
Match score weights: distance 35% · size 25% · config 20% · recency 20%. Top-matched comps best support the ARV.
Projected returns pro-forma
-0.37% appreciation · 3.0% rent growth · sell at horizon
- IRR
- -1.3%
- Equity multiple
- 0.94×
- Total profit
- $-3,203
- Equity at exit
- $51,044
- IRR
- 4.7%
- Equity multiple
- 1.48×
- Total profit
- $25,428
- Equity at exit
- $58,707
Cash invested: $52,500 (down + closing). Projections, not guarantees.
Landlord ↔ Tenant lean methodology
- Overall (STATE)
- 21 Tenant-Leaning
- State New Jersey
- 21 Tenant-Leaning · D+6
- County
- — inherits STATE
- City
- — inherits STATE
ZIP-level market 08349
- Home prices YoY
- -0.2%
- Active inventory
- 24
- Price-to-rent
- 8.8×
Monthly cashflow live
- Estimated rent
- $1,779 medium interval (Pro) →
- Mortgage (P&I)
- −$983
- Tax from tax record
- −$259 /mo · $3,103/yr
- Insurance
- −$78
- HOA
- −$0
- Vacancy / Maint / Mgmt
- −$374
- Net cashflow
- $85
Break-even live
Sensitivity live
| Price | -10% $191 | -5% $138 | +0% $85 | +5% $32 | +10% $-21 |
|---|---|---|---|---|---|
| Rent | -10% $-55 | -5% $15 | +0% $85 | +5% $156 | +10% $226 |
| Rate | -1.0pp $180 | -0.5pp $133 | base $85 | +0.5pp $37 | +1.0pp $-13 |
UW: 25.0% down · 7.5% · 30yr · 1.5% tax · 5.0% vac · 8.0% maint · 8.0% mgmt
Financing live
Cash to close
- Down payment
- $46,875
- Closing costs
- $5,625
- Reserves months
- —
- Total cash needed
- —
Loan-product check · same deal, 3 products live
Conventional
25% down · 7.5% · 30yr
- Down + closing
- —
- Monthly P&I
- —
- Monthly cashflow
- —
- DSCR
- —
- Eligible?
- —
Personal DTI + credit; lowest rate.
DSCR
20% down · 8.5% · 30yr
- Down + closing
- —
- Monthly P&I
- —
- Monthly cashflow
- —
- DSCR
- —
- Eligible?
- —
No personal income docs; deal must DSCR.
Hard money
10% down · 12.0% · 12mo
- Down + closing
- —
- Monthly P&I
- —
- Monthly cashflow
- —
- DSCR
- —
- Eligible?
- —
Short-term bridge; refi at stabilization.
Listing history 33 events
-
2026-06-17status $187,500 Pending 61 DOM
-
2026-06-16days on market $187,500 Active 61 DOM
-
2026-06-15days on market $187,500 Active 60 DOM
-
2026-06-14days on market $187,500 Active 58 DOM
-
2026-06-13days on market $187,500 Active 57 DOM
-
2026-06-10days on market $187,500 Active 55 DOM
-
2026-06-09days on market $187,500 Active 54 DOM
-
2026-06-08days on market $187,500 Active 53 DOM
-
2026-06-07days on market $187,500 Active 52 DOM
-
2026-06-02days on market $187,500 Active 47 DOM
-
2026-06-01days on market $187,500 Active 46 DOM
-
2026-05-31days on market $187,500 Active 45 DOM
-
2026-05-30days on market $187,500 Active 44 DOM
-
2026-05-04price $190,000 529-char remark
Show marketing remark (529 chars)
Welcome to 1908 North Ave – a beautifully renovated home designed for modern living! This stunning residence has been completely updated with brand-new finishes throughout, including gorgeous new flooring, a stylish kitchen with contemporary upgrades, and elegantly remodeled bathrooms. There is also a new septic. Every detail has been thoughtfully designed to create a space that feels fresh, inviting, and move-in ready. Don’t miss your chance to make this exceptional home your own—schedule a showing today!
-
2026-04-16$200,000 Active 529-char remark
Show marketing remark (529 chars)
Welcome to 1908 North Ave – a beautifully renovated home designed for modern living! This stunning residence has been completely updated with brand-new finishes throughout, including gorgeous new flooring, a stylish kitchen with contemporary upgrades, and elegantly remodeled bathrooms. There is also a new septic. Every detail has been thoughtfully designed to create a space that feels fresh, inviting, and move-in ready. Don’t miss your chance to make this exceptional home your own—schedule a showing today!
-
2025-12-17status Pending
-
2025-12-17historical
-
2025-12-11historical $1,825
-
2025-12-04price $1,825
-
2025-10-30status Active
-
2025-10-22price $1,900
-
2025-09-24historical Active Under Contract
-
2025-09-19$2,000
-
2025-07-29status Active
-
2025-07-03status Pending
-
2025-06-18price $199,000
-
2025-04-23price $205,000
-
2025-04-03price $214,000
-
2025-03-26price $219,999
-
2025-03-10$229,999 Active
-
2024-12-20soldstatus $70,000 Closed
-
2024-11-27status Pending
-
2024-11-20$69,900 Active
ⓘ Source: listings_history table (triggers on properties + properties_extension) + one-shot
backfill from property_details.listing_events for pre-trigger history.
Tax reassessment forecast NJ · Partial reset (capped growth)
- Current annual tax
- $3,103 · $259/mo
- Projected year-2 tax
- $3,886 · $324/mo
- Expected delta
- +$783/yr (+$65/mo · 25.2%)
ⓘ Screening estimate from a state-policy table — verify with the county assessor before closing.
Climate risk First Street
- Flood 6/10 Major FEMA zone X (shaded) · 57% chance over 30 yrs
- Wildfire 4/10 Moderate
- Heat 8/10 Severe 7 d/yr ≥102°F today · 16 d/yr by 30 yrs out
- Wind 8/10 Severe 80% chance of damaging wind over 30 yrs
- Air quality 6/10 Major 7 unhealthy d/yr today · 11 by 30 yrs out
Nearby sold comps map
Loading sold comps map…
Walkable amenities ~0.75 mi
Loading nearby amenities…
Taxation est. · year 1
- Rental income
- $21,347
- − Mortgage interest
- −$10,503
- − Property taxes
- −$3,103
- − Insurance
- −$938
- − Repairs & maintenance
- −$1,708
- − Management
- −$1,708
- − Depreciation
- −$5,455
- Taxable loss
- −$2,067
- Est. tax savings @ 24.0%
- +$496
- After-tax cash flow
- $1,520/yr
For passive investors: Depreciation is non-cash, so a rental often shows a tax loss while cash-flowing — sheltering income. Rental losses are passive: they offset passive income freely, and up to $25,000/yr can offset ordinary (W-2) income if you actively participate and your MAGI is under $100k (phasing out to $0 by $150k); unused losses carry forward. On sale, claimed depreciation is recaptured at up to 25%, and gains may owe capital-gains tax (a 1031 exchange can defer both). Figures are a year-1 estimate at your 24.0% rate — not tax advice; consult a CPA.
Schools (NCES district)
- District
- Commercial Township School District
- NCES district ID
- 3403480
- Math proficiency
- 5% ▼ -7.00%
- Reading proficiency
- 29% ▲ 10.00%
- Median HH income
- $45,143
- Composite
- 14.86/100
- National rank
- #9378
- State rank
- #449 of 472 in NJ
Livability — Port Norris
- Score
- 58/100
- State rank
- #508
- US rank
- #21543
Category grades
Schools grade is shown separately in the Schools card above.
Census & demographics
- Census place
- Port Norris, NJ
- City population
- 2,400
- Population (ZIP)
- 2,400
Population outlook (Cumberland County) Hauer SSP2
- Today (2025)
- 152,743 people
- By 2030
- 150,373 · -1.6%
- By 2040
- 146,881 · -3.8%
- By 2050
- 142,653 · -6.6%
- By 2075
- 129,468 · -15.2%
- By 2100
- 107,456 · -29.6%
Race, ethnicity, and origin ACS 2023
- Neighborhood character
- Predominantly White (68%)
- Race & ethnicity
- White 68% Black 19% Hispanic / Latino 9% Two or more races 7% Native American 3%
- Hispanic origin (detail)
- Puerto Rican 3%
- Common ancestry
- Slovak 11% Romanian 5% Lithuanian 2%
- Foreign-born
- 2% · Canada
- Languages at home
- 97% English-only · Spanish 1% Other Indo-European 1%
Political lean MEDSL · Cumberland
- 2024 margin
- Toss-up / Even · D 47.6% · R 51.3% · Other 1.1%
- 2008→2024 swing
- -25.4pp toward R · 2008: 21.6pp · 2024: -3.8pp
- All cycles
- 2024: R+3.8 2020: D+6.0 2016: D+5.3 2012: D+23.1 2008: D+21.6
Not yet ingested
- Civics
- —
Market trends
- HPI YoY
- ▼ -0.37%
- Current HPI
- 177.1561
- Rent YoY
- —
- Metro
- —
- State GDP YoY
- ▲ 2.05%
- F500 in state
- 34
Industry mix (Fortune 500 HQ in NJ)
| Industry | F500 HQs | Revenue |
|---|---|---|
| Consumer Goods | 3 | $31B |
|
||
| Pharmaceuticals | 2 | $153B |
|
||
| Technology | 2 | $21B |
|
||
| Insurance | 2 | $20B |
|
||
| Healthcare | 2 | $19B |
|
||
| Financial Services | 1 | $70B |
|
||
Price history
+171.8% since first listed20 events — show timeline
- 2026-05-04 Price Changed $190,000 BRIGHT MLS
- 2026-04-16 Listed $200,000 BRIGHT MLS
- 2025-12-17 Pending — BRIGHT MLS
- 2025-12-17 Listing Removed — BRIGHT MLS
- 2025-12-11 Rental Removed $1,825 APPFOLIO
- 2025-12-04 Price Changed $1,825 APPFOLIO
- 2025-10-30 Relisted — BRIGHT MLS
- 2025-10-22 Price Changed $1,900 APPFOLIO
- 2025-09-24 Contingent — BRIGHT MLS
- 2025-09-19 Listed for Rent $2,000 APPFOLIO
- 2025-07-29 Relisted — BRIGHT MLS
- 2025-07-03 Pending — BRIGHT MLS
- 2025-06-18 Price Changed $199,000 BRIGHT MLS
- 2025-04-23 Price Changed $205,000 BRIGHT MLS
- 2025-04-03 Price Changed $214,000 BRIGHT MLS
- 2025-03-26 Price Changed $219,999 BRIGHT MLS
- 2025-03-10 Listed $229,999 BRIGHT MLS
- 2024-12-20 Sold (MLS) $70,000 BRIGHT MLS
- 2024-11-27 Pending — BRIGHT MLS
- 2024-11-20 Listed $69,900 BRIGHT MLS
Property tax history
+3.6%/yrLatest (2025): $3,103 · +4.8% YoY. Source: county tax records.
Cash-flow waterfall
monthlySold comps — $/sqft
last 12 mo · ≤1 miLoading sold comps…