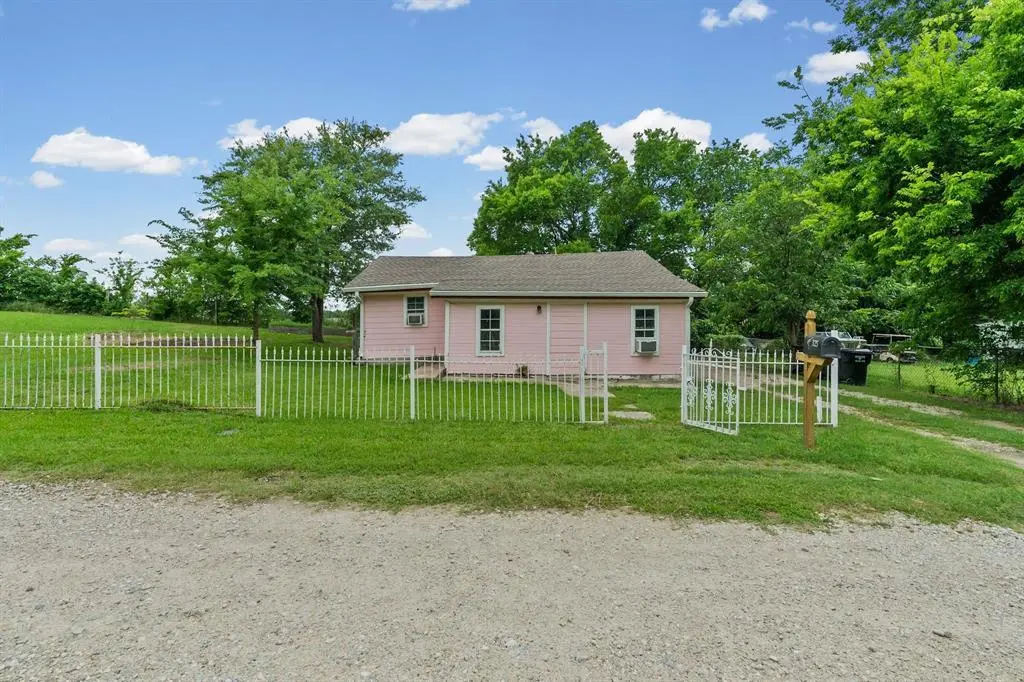
325 West Ln · West Tawakoni, TX
Flood risk 1/10 · Minimal
- FEMA flood zone
- X (unshaded)
- Chance of flooding over 30 yrs
- 0.0%
- Est. flood insurance / yr
- $507 – $1,088
Fire risk 4/10 · Minor
- Est. fire insurance / yr
- $1,222 – $2,270
Heat risk 7/10 · Major
- Hot days now (above 110°F)
- 7 days/yr
- Hot days in 30 yrs
- 24 days/yr
Wind risk 6/10 · Moderate
- Chance of severe wind over 30 yrs
- 27.0%
Air-quality risk 2/10 · Minimal
- Unhealthy air days now
- 0 days/yr
- Unhealthy air days in 30 yrs
- 1 days/yr
Risk factors via First Street. Map © Google.
Why this score? — see what drove the F grade
The composite is a weighted blend of 9 inputs, each scored 0–100. Each bar is that input's sub-score; the figure is the points it added to the 100-point composite (weight × sub-score).
- Appreciation +10.0/10.0
- Cash flow +8.9/30.0
- Livability +2.8/5.0
- 1% rule +2.7/10.0
- Schools +2.6/10.0
- DSCR +2.5/10.0
- Rent growth +2.5/5.0
- Condition / age +2.5/5.0
- ARV discount +0.0/15.0
$175,000
🖨 Deal sheet (PDF) 📄 Offer letter ✓ Due diligence
Listing remarks MLS
Newly remodeled 2 bed, 1 bath home on . 33 acre double lot just steps away from Lake Tawakoni! Updates include new tankless water heater, wall heat and Air Conditioning unit, wood-look laminate flooring, carpet, and new interior & exterior paint throughout. Property is a 2 minute walk from community dock and boat ramp that is accessible through voluntary HOA ($45 per year). Listing includes property ID 45738, and 45739. Seller does not have survey. Buyer and Buyer Agent to verify all information.
Key facts
- Expansive lot
- Large walk in closet
- Open concept layout
Tags
Property features AI
Finance
- Other: Property is in Hales Lake Tawakoni Retreat subdivision; Restrictions: Building; Metal shop with electricity may be considered to convey
- Financial info: Listing terms: Cash or Conventional; No second mortgage indicated
- HOA & community: Voluntary association (Hales Retreat HOA); Association provides full use of facilities
Exterior
- Parking: Aggregate driveway; No garage; No covered or carport spaces listed
- Security: No specific security features listed
- Utilities: City sewer; City water; Individual water meter; Electricity connected
- Home design: Single-family residence (attached); Built in 1986; Composition roof
- Construction: Siding and wood construction; Preowned
- Exterior features: Covered porch(es); Covered patio/porch; Chain link and wrought iron fencing; Shed(s) / storage; Lakefront common area on Lake Tawakoni; Grassed vegetation; Utilities easement
Interior
- Kitchen: Electric range; Refrigerator
- Bedrooms: Two bedrooms (both on main level; each about 14 x 11)
- Flooring: Carpet; Laminate
- Bathrooms: One full bathroom (approx. 8 x 5)
- Heating & cooling: Central heating; Electric heating; Central air; Wall/window unit(s)
- Interior features: Open floorplan; Kitchen island; 5 total rooms; 1 living area; 1 dining area; One-level home
- Laundry & utility: No specific laundry equipment listed
Neighborhood map
What this means for you Summary
Snapshot
- This is a 2-bed/2.0-bath single-family listed at $175k.
Deal economics
- At list price, monthly cash flow is $-141 ($-2k/yr) — negative.
- To cash-flow at today's rent, offer at most $150k (14.2% below list).
- To meet the 1% rule (rent ≥ 1% of price), the offer needs to be $134k (23.4% below list).
- Recommended offer: $134k (23.4% below list) — sets the bar for 1% rule.
Location & tenants
- Location reads 56/100 on livability (#1,337 in TX) — a working-class tenant base; expect higher turnover. Strengths: cost of living A+, housing A+, crime A-; Watch: amenities F, commute F, employment F.
- Quinlan ISD (rural): math 27% / reading 34% proficiency, ranked #610 of 826 in TX (top 74%) — families likely to look elsewhere, expect single-tenant / working-renter base with shorter leases.
- Zoned schools: D C Cannon El (765 students, 81% FRL); C B Thompson Middle (math 33% / reading 36%, grade F, #858 of 1,662 statewide, top 54%, 628 students, 77% FRL); Wh Ford H S (math 17% / reading 44%, grade F, #1,085 of 1,632 statewide, top 67%, 786 students, 68% FRL) — zoned schools average 75% FRL vs 60% district-wide (16 pts higher); higher-poverty schools than district average — tighter screening recommended.
- Market conditions: 339 active listings in the ZIP; 1,289 units permitted in Hunt County in 2024 (527 in 5+ unit buildings).
Forward outlook
- In year one you build about $19k of equity ($1k loan paydown + $18k appreciation (10.0% local appreciation)).
- Hunt County population projected at +15% by 2050 — modest demand growth; plan on rents tracking national, not racing it.
- By year 2, paydown + projected appreciation supports a ~$30k cash-out refi (75% LTV) — recoverable capital for the next deal without selling this one.
Negotiation context
- It's been on market 30 days — a 2% lower offer ($172k) is reasonable based on typical stale-listing flexibility.
- 2 sale attempts since 8y ago with the ask held roughly flat each time — persistent listings suggest the price (not the market) is what's stuck; bring a comps-based counter.
Risks & watch-outs
- Climate carrying-cost: major wind risk, 27% chance of damaging wind over 30y; extreme-heat days projected 7→24/yr by 2055 (HVAC capex compounding) — expect insurance premiums to compound above CPI over the hold.
Questions for the listing agent
- What do current leases actually rent for vs. the listed asking? Can we see a recent rent roll and the last 12 months of T-12 income?
- Is there a deadline driving the sale (1031 exchange, divorce, estate, relocation)? That informs how much negotiation room exists.
- Schools are F-rated, which usually means shorter tenancies and higher turnover. Who's the typical renter profile here, and what's been the actual vacancy rate?
- The area grade is low — what's the realistic commute time and amenity access for the typical tenant pool here? Any planned neighborhood developments (good or bad) we should know about?
- What's the average days-on-market for RENTAL listings here right now (not sales)? A rising rental-DOM trend means longer vacancies and softer asking-rent achievability than the comps imply.
- What's the recent tenant-quality profile in this submarket — average credit score on applications, eviction rate, late-payment / NSF rate, and stable-employment percentage? A property-management company in the area should have these aggregated.
- How much new for-sale + rental construction is in the pipeline within 1–3 miles? Heavy new supply typically softens prices + rents 12–24 months out; constrained supply supports both.
Investment metrics
- 1% rule
- 0.77% ✗
- Cap rate
- 5.33%
- Cash-on-cash
- -3.46%
- DSCR
- 0.85
- GRM
- 10.9
CMA / ARV
- ARV (on-the-fly)
- $118,016
- Comps found
- 5
Show comp detail 5 sales within ~0.75 mi
| Address | Dist | Beds/Ba | Sqft | Sold | Price | $/sf | Match |
|---|---|---|---|---|---|---|---|
| 149 E State Highway 276 | 0.29mi | 2/1.0 | 936 (+2%) | 16mo | $119,500 | $128 | 67 |
| 412 Vista Mdw | 0.40mi | 3/2.0 (+1) | 1,001 (+9%) | 9mo | $184,900 | $185 | 55 |
| 208 Charlie Dr | 0.20mi | 2/1.0 | 1,055 (+14%) | 10mo | $85,000 | $81 | 55 |
| 224 Haralson Ln | 0.10mi | 2/1.0 | 1,039 (+13%) | 19mo | $190,000 | $183 | 54 |
| 405 Kenny Dr | 0.08mi | 2/1.0 | 1,032 (+12%) | 22mo | $120,000 | $116 | 54 |
Match score weights: distance 35% · size 25% · config 20% · recency 20%. Top-matched comps best support the ARV.
Projected returns pro-forma
10.0% appreciation · 3.0% rent growth · sell at horizon
- IRR
- 21.8%
- Equity multiple
- 2.76×
- Total profit
- $86,338
- Equity at exit
- $157,654
- IRR
- 19.6%
- Equity multiple
- 6.33×
- Total profit
- $261,346
- Equity at exit
- $339,987
Cash invested: $49,000 (down + closing). Projections, not guarantees.
Landlord ↔ Tenant lean methodology
- Overall (STATE)
- 87 Strongly Landlord-Friendly
- State Texas
- 87 Strongly Landlord-Friendly · R+5
- County
- — inherits STATE
- City
- — inherits STATE
ZIP-level market 75474
- Home prices YoY
- 7.5%
- Active inventory
- 339
- Price-to-rent
- 10.9×
Monthly cashflow live
- Estimated rent
- $1,340 medium interval (Pro) →
- Mortgage (P&I)
- −$918
- Tax from tax record
- −$209 /mo · $2,507/yr
- Insurance
- −$73
- HOA
- −$0
- Lot rent
- −$0
- Vacancy / Maint / Mgmt
- −$281
- Net cashflow
- $-141
Break-even live
Sensitivity live
| Price | -10% $-42 | -5% $-92 | +0% $-141 | +5% $-191 | +10% $-240 |
|---|---|---|---|---|---|
| Rent | -10% $-247 | -5% $-194 | +0% $-141 | +5% $-88 | +10% $-35 |
| Rate | -1.0pp $-53 | -0.5pp $-97 | base $-141 | +0.5pp $-186 | +1.0pp $-233 |
UW: 25.0% down · 7.5% · 30yr · 1.5% tax · 5.0% vac · 8.0% maint · 8.0% mgmt
Financing live
Cash to close
- Down payment
- $43,750
- Closing costs
- $5,250
- Reserves months
- —
- Total cash needed
- —
Loan-product check · same deal, 3 products live
Conventional
25% down · 7.5% · 30yr
- Down + closing
- —
- Monthly P&I
- —
- Monthly cashflow
- —
- DSCR
- —
- Eligible?
- —
Personal DTI + credit; lowest rate.
DSCR
20% down · 8.5% · 30yr
- Down + closing
- —
- Monthly P&I
- —
- Monthly cashflow
- —
- DSCR
- —
- Eligible?
- —
No personal income docs; deal must DSCR.
Hard money
10% down · 12.0% · 12mo
- Down + closing
- —
- Monthly P&I
- —
- Monthly cashflow
- —
- DSCR
- —
- Eligible?
- —
Short-term bridge; refi at stabilization.
Listing history 22 events
-
2026-06-22days on market $175,000 Active 30 DOM
-
2026-06-21days on market $175,000 Active 29 DOM
-
2026-06-18days on market $175,000 Active 26 DOM
-
2026-06-17days on market $175,000 Active 25 DOM
-
2026-06-16days on market $175,000 Active 24 DOM
-
2026-06-15days on market $175,000 Active 23 DOM
-
2026-06-13days on market $175,000 Active 21 DOM
-
2026-06-09days on market $175,000 Active 17 DOM
-
2026-06-08days on market $175,000 Active 16 DOM
-
2026-06-07days on market $175,000 Active 15 DOM
-
2026-06-04days on market $175,000 Active 12 DOM
-
2026-06-03days on market $175,000 Active 11 DOM
-
2026-06-02days on market $175,000 Active 10 DOM
-
2026-06-01days on market $175,000 Active 9 DOM
-
2026-05-31days on market $175,000 Active 8 DOM
-
2026-05-23$175,000 Active
-
2018-04-19soldstatus Sold 507-char remark
Show marketing remark (507 chars)
Newly remodeled 2 bed, 1 bath home on . 33 acre double lot just steps away from Lake Tawakoni! Updates include new tankless water heater, wall heat and Air Conditioning unit, wood-look laminate flooring, carpet, and new interior & exterior paint throughout. Property is a 2 minute walk from community dock and boat ramp that is accessible through voluntary HOA ($45 per year). Listing includes property ID 45738, and 45739. Seller does not have survey. Buyer and Buyer Agent to verify all information.
-
2018-03-28status Pending 507-char remark
Show marketing remark (507 chars)
Newly remodeled 2 bed, 1 bath home on . 33 acre double lot just steps away from Lake Tawakoni! Updates include new tankless water heater, wall heat and Air Conditioning unit, wood-look laminate flooring, carpet, and new interior & exterior paint throughout. Property is a 2 minute walk from community dock and boat ramp that is accessible through voluntary HOA ($45 per year). Listing includes property ID 45738, and 45739. Seller does not have survey. Buyer and Buyer Agent to verify all information.
-
2018-03-20historical Active Option Contract 507-char remark
Show marketing remark (507 chars)
Newly remodeled 2 bed, 1 bath home on . 33 acre double lot just steps away from Lake Tawakoni! Updates include new tankless water heater, wall heat and Air Conditioning unit, wood-look laminate flooring, carpet, and new interior & exterior paint throughout. Property is a 2 minute walk from community dock and boat ramp that is accessible through voluntary HOA ($45 per year). Listing includes property ID 45738, and 45739. Seller does not have survey. Buyer and Buyer Agent to verify all information.
-
2018-03-12$67,000 Active 507-char remark
Show marketing remark (507 chars)
Newly remodeled 2 bed, 1 bath home on . 33 acre double lot just steps away from Lake Tawakoni! Updates include new tankless water heater, wall heat and Air Conditioning unit, wood-look laminate flooring, carpet, and new interior & exterior paint throughout. Property is a 2 minute walk from community dock and boat ramp that is accessible through voluntary HOA ($45 per year). Listing includes property ID 45738, and 45739. Seller does not have survey. Buyer and Buyer Agent to verify all information.
-
2013-03-12soldstatus
-
2004-05-20soldstatus
ⓘ Source: listings_history table (triggers on properties + properties_extension) + one-shot
backfill from property_details.listing_events for pre-trigger history.
Tax reassessment forecast TX · Resets to sale price
- Current annual tax
- $2,507 · $209/mo
- Projected year-2 tax
- $3,202 · $267/mo
- Expected delta
- +$696/yr (+$58/mo · 27.8%)
ⓘ Screening estimate from a state-policy table — verify with the county assessor before closing.
Climate risk First Street
- Flood 1/10 Low FEMA zone X (unshaded) · 0% chance over 30 yrs
- Wildfire 4/10 Moderate
- Heat 7/10 Severe 7 d/yr ≥110°F today · 24 d/yr by 30 yrs out
- Wind 6/10 Major 27% chance of damaging wind over 30 yrs
- Air quality 2/10 Low 0 unhealthy d/yr today · 1 by 30 yrs out
Nearby sold comps map
Loading sold comps map…
Walkable amenities ~0.75 mi
Loading nearby amenities…
Taxation est. · year 1
- Rental income
- $16,078
- − Mortgage interest
- −$9,803
- − Property taxes
- −$2,507
- − Insurance
- −$875
- − Repairs & maintenance
- −$1,286
- − Management
- −$1,286
- − Depreciation
- −$5,091
- Taxable loss
- −$4,770
- Est. tax savings @ 24.0%
- +$1,145
- After-tax cash flow
- $-548/yr
For passive investors: Depreciation is non-cash, so a rental often shows a tax loss while cash-flowing — sheltering income. Rental losses are passive: they offset passive income freely, and up to $25,000/yr can offset ordinary (W-2) income if you actively participate and your MAGI is under $100k (phasing out to $0 by $150k); unused losses carry forward. On sale, claimed depreciation is recaptured at up to 25%, and gains may owe capital-gains tax (a 1031 exchange can defer both). Figures are a year-1 estimate at your 24.0% rate — not tax advice; consult a CPA.
Schools (NCES district)
- District
- Quinlan ISD
- NCES district ID
- 4836240
- Math proficiency
- 27% ▼ -10.00%
- Reading proficiency
- 34% ▼ -2.00%
- Median HH income
- $45,461
- Composite
- 26.16/100
- National rank
- #7271
- State rank
- #610 of 826 in TX
Livability — West Tawakoni
- Score
- 56/100
- State rank
- #1337
- US rank
- #23022
Category grades
Schools grade is shown separately in the Schools card above.
Census & demographics
- Census place
- West Tawakoni, TX
- County
- Hunt County · 71,969 people
- Metro
- Dallas-Fort Worth-Arlington, TX
- Population (ZIP)
- 17,671
- Household income
- $64,103
- Rent vs Own
- Severe rent burden
- 181.0
Population outlook (Hunt County) Hauer SSP2
- Today (2025)
- 97,090 people
- By 2030
- 100,452 · +3.5%
- By 2040
- 106,544 · +9.7%
- By 2050
- 111,218 · +14.6%
- By 2075
- 121,695 · +25.3%
- By 2100
- 123,683 · +27.4%
Race, ethnicity, and origin ACS 2023
- Neighborhood character
- Predominantly White (74%)
- Race & ethnicity
- White 74% Hispanic / Latino 19% Two or more races 8% Asian 1% Black 1%
- Hispanic origin (detail)
- Mexican 17%
- Common ancestry
- Lithuanian 2% Romanian 2% Iranian 1%
- Foreign-born
- 8% · Canada
- Languages at home
- 88% English-only · Spanish 10% Other Asian/Pacific 1%
Political lean MEDSL · Hunt
- 2024 margin
- Solid R (+55.5) · D 21.9% · R 77.4%
- 2008→2024 swing
- -14.9pp toward R · 2008: -40.6pp · 2024: -55.5pp
- All cycles
- 2024: R+55.5 2020: R+52.5 2016: R+56.3 2012: R+51.2 2008: R+40.6
Not yet ingested
- Civics
- —
Market trends
- HPI YoY
- ▲ 33.95%
- Current HPI
- 484.21
- Rent YoY
- —
- Metro
- Dallas-Fort Worth-Arlington, TX
- State GDP YoY
- ▲ 3.95%
- F500 in state
- 110
Industry mix (Fortune 500 HQ in TX)
| Industry | F500 HQs | Revenue |
|---|---|---|
| Energy | 16 | $1,198B |
|
||
| Technology | 5 | $198B |
|
||
| Engineering / Construction | 4 | $72B |
|
||
| Energy Services | 3 | $60B |
|
||
| Utilities | 3 | $41B |
|
||
| Healthcare | 2 | $330B |
|
||
Price history
+161.2% since first listed7 events — show timeline
- 2026-05-23 Listed $175,000 NTREIS
- 2018-04-19 Sold (MLS) — NTREIS
- 2018-03-28 Pending — NTREIS
- 2018-03-20 Contingent — NTREIS
- 2018-03-12 Listed $67,000 NTREIS
- 2013-03-12 Sold (Public Records) — Public Records
- 2004-05-20 Sold (Public Records) — Public Records
Property tax history
+9.0%/yrLatest (2025): $2,507 · +8.7% YoY. Source: county tax records.
Cash-flow waterfall
monthlySold comps — $/sqft
last 12 mo · ≤1 miLoading sold comps…