 🏢 Co-op
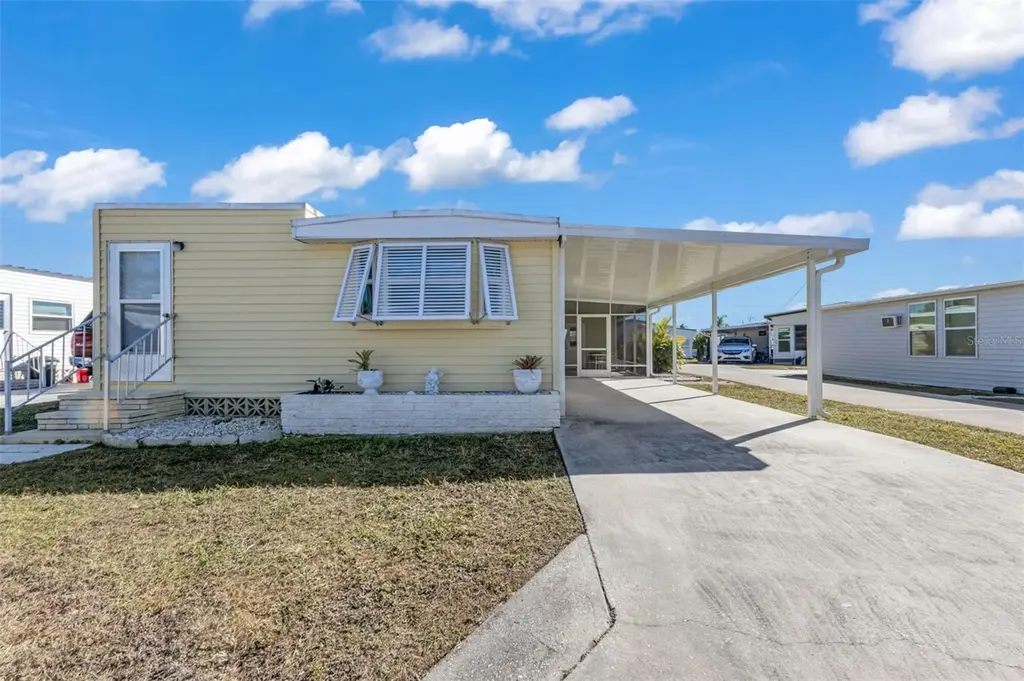
1891 Englewood Rd #119 · Englewood, FL
Flood risk 6/10 · Moderate
- FEMA flood zone
- X (shaded)
- Chance of flooding over 30 yrs
- 0.54%
- Est. flood insurance / yr
- $507 – $1,088
Fire risk 4/10 · Minor
- Est. fire insurance / yr
- $947 – $1,759
Heat risk 10/10 · Severe
- Hot days now (above 107°F)
- 7 days/yr
- Hot days in 30 yrs
- 28 days/yr
Wind risk 10/10 · Severe
- Chance of severe wind over 30 yrs
- 99.0%
Air-quality risk 3/10 · Minor
- Unhealthy air days now
- 2 days/yr
- Unhealthy air days in 30 yrs
- 2 days/yr
Risk factors via First Street. Map © Google.
Why this score? — see what drove the B grade
The composite is a weighted blend of 9 inputs, each scored 0–100. Each bar is that input's sub-score; the figure is the points it added to the 100-point composite (weight × sub-score).
- Cash flow +30.0/30.0
- 1% rule +10.0/10.0
- DSCR +10.0/10.0
- ARV discount +7.5/15.0
- Schools +5.4/10.0
- Rent growth +4.8/5.0
- Livability +3.7/5.0
- Condition / age +2.5/5.0
- Appreciation +0.0/10.0
$75,000
🖨 Deal sheet (PDF) 📄 Offer letter ✓ Due diligence
Listing remarks
Welcome to 1891 Englewood Rd in the desirable Brook to Bay community! This charming 2-bedroom, 1.5-bath residence features a fresh, inviting interior with all-new laminate flooring throughout, an updated kitchen, and stylish shiplap accent walls that add a coastal flair. Just off the entry is a foyer that would make an excellent flex space for visiting guests, home office, or reading nook. Enjoy Florida living year-round in the screened lanai, perfect for relaxing or entertaining, plus additional storage space located at the rear of the lanai. Additional features include Bahama shutters and convenient carport parking. Discover the vibrant Brook to Bay 55+ co-op community, offering an active
Key facts
- Flex space
- Screened lanai
- Carport parking
Tags
Property features AI
Finance
- Other: Partially furnished; Total rooms: 7; Living area about 983 square feet; Building area total 1,554 square feet; Direction faces north
- Financial info: Lease restrictions apply
- HOA & community: Has HOA (Precedent Hospitality & Property Management); Monthly association fee $188; Association approval required; HOA covers pool, recreational facilities, maintenance of grounds, management, and escrow reserves; Community features: clubhouse, pool, deed restrictions, buyer approval required; Senior community; Pets not allowed
Exterior
- Parking: Carport with 2 spaces
- Utilities: Public water; Public sewer; Electricity connected; Cable available; Phone available; Water connected; Sewer connected
- Home design: Residential mobile home (single wide); One story; Faces north; Entry level: one
- Construction: Metal siding; Metal roof; Crawlspace foundation; Built on a 0.08 acre lot
- Exterior features: Storage; Private maintained paved road; Water access via canal and creek; Private boat ramp and fishing pier
Interior
- Kitchen: Range; Microwave; Refrigerator; Dishwasher not listed
- Bedrooms: 2 bedrooms
- Flooring: Laminate flooring
- Bathrooms: 1 full bathroom; 1 half bathroom
- Heating & cooling: Electric heat; Central air conditioning
- Interior features: Ceiling fans; Open floorplan; Living room / dining room combo
- Laundry & utility: Washer; Dryer; Laundry inside
Neighborhood map
What this means for you Summary
Snapshot
- This is a 2-bed/2.0-bath manufactured listed at $75k.
Deal economics
- At list price, monthly cash flow is $1k ($12k/yr) — positive.
- The deal already cash-flows at list — no discount required.
- Meets the 1% rule at list price ($2k rent vs $75k).
- Recommended offer: $66k (12.0% below list) — sets the bar for market timing.
- Cap rate 22.6% vs local median 3.8% in Englewood — top-decile yield for the area; either an underpriced asset or a hidden risk that comps aren't pricing in. Stress-test before assuming the spread holds.
Location & tenants
- Location reads 73/100 on livability (#321 in FL) — a middle-class / working-renter tenant base. Strengths: housing A+, cost of living A, health & safety A; Watch: employment C-, amenities F, commute F.
- Sarasota (urban): math 63% / reading 63% proficiency, ranked #7 of 73 in FL (top 10%) — acceptable for families but not a draw, mixed tenant base, ~2y average lease.
- Zoned schools: Englewood Elementary School (math 65% / reading 66%, grade B+, #500 of 2,144 statewide, top 24%, 587 students, 52% FRL).
- Market conditions: Rents rising fast (+9.0%/yr); 723 active listings in the ZIP; solid renter incomes; 7,466 units permitted in Sarasota County in 2024 (2,138 in 5+ unit buildings).
- This rent runs 35% of the median local income ($76k/yr) — at the standard rent-burdened threshold; future hikes will face affordability resistance.
Forward outlook
- Local home prices are declining (-3.0%/yr); year-one equity from $519 of loan paydown is wiped out by about $2k of value loss. Plan a longer hold.
- Sarasota County population projected at +20% by 2050 — long-run rental-demand tailwind backs the buy-and-hold thesis.
- At projected returns (-3.0% appreciation + 8.0% rent growth), your $21k cash investment doubles in ~2 years — after that, you're playing with house money.
Negotiation context
- It's been on market 131 days — a 12% lower offer ($66k) is reasonable based on typical stale-listing flexibility.
- 2 sale attempts; this cycle's ask has dropped $70k (48%) from the opening price — seller is motivated, your offer sets the floor, not the list.
- Current owner paid $14k; list at $75k implies a 436% gain — meaningful room to come down on a strong offer.
Risks & watch-outs
- Climate carrying-cost: major flood risk; severe wind risk, 99% chance of damaging wind over 30y; extreme-heat days projected 7→28/yr by 2055 (HVAC capex compounding) — expect insurance premiums to compound above CPI over the hold.
Questions for the listing agent
- It's been on market 131 days. Have you received any prior offers? Is the seller open to a 12% concession, seller financing, or rate buy-down credit?
- Built in 1970 — when were the roof, HVAC, electrical panel, plumbing, and water heater last replaced?
- What does the HOA fee cover, when was the last increase, and are there any pending special assessments or reserve-fund shortfalls?
- Why hasn't it sold? Are there any deal-killer items the seller is aware of (foundation, flood, title, zoning, code violations)?
- Is there a deadline driving the sale (1031 exchange, divorce, estate, relocation)? That informs how much negotiation room exists.
- Schools are A-rated — typically a magnet for longer-tenancy family renters. What's the average tenant stay here, and is there a school-zone premium baked into asking?
- What's the average days-on-market for RENTAL listings here right now (not sales)? A rising rental-DOM trend means longer vacancies and softer asking-rent achievability than the comps imply.
- What's the recent tenant-quality profile in this submarket — average credit score on applications, eviction rate, late-payment / NSF rate, and stable-employment percentage? A property-management company in the area should have these aggregated.
- How much new for-sale + rental construction is in the pipeline within 1–3 miles? Heavy new supply typically softens prices + rents 12–24 months out; constrained supply supports both.
Investment metrics
- 1% rule
- 2.98% ✓
- Cap rate
- 22.60%
- Cash-on-cash
- 58.25%
- DSCR
- 3.59
- GRM
- 2.8
CMA / ARV
No comps found within radius.
Projected returns pro-forma
-3.0% appreciation · 8.0% rent growth · sell at horizon
- IRR
- 63.3%
- Equity multiple
- 4.08×
- Total profit
- $64,754
- Equity at exit
- $11,183
- IRR
- 69.6%
- Equity multiple
- 10.26×
- Total profit
- $194,428
- Equity at exit
- $6,485
Cash invested: $21,000 (down + closing). Projections, not guarantees.
Landlord ↔ Tenant lean methodology
- Overall (STATE)
- 87 Strongly Landlord-Friendly
- State Florida
- 87 Strongly Landlord-Friendly · R+3
- County
- — inherits STATE
- City
- — inherits STATE
ZIP-level market 34223
- Home prices YoY
- -34.2%
- Rents YoY
- 9.0%
- Active inventory
- 723
- Price-to-rent
- 2.8×
Monthly cashflow live
- Estimated rent
- $2,234 medium interval (Pro) →
- Mortgage (P&I)
- −$393
- Tax from tax record
- −$133 /mo · $1,594/yr
- Insurance
- −$31
- HOA
- −$188
- Vacancy / Maint / Mgmt
- −$469
- Net cashflow
- $1,019
Break-even live
Sensitivity live
| Price | -10% $1,062 | -5% $1,041 | +0% $1,019 | +5% $998 | +10% $977 |
|---|---|---|---|---|---|
| Rent | -10% $843 | -5% $931 | +0% $1,019 | +5% $1,108 | +10% $1,196 |
| Rate | -1.0pp $1,057 | -0.5pp $1,039 | base $1,019 | +0.5pp $1,000 | +1.0pp $980 |
UW: 25.0% down · 7.5% · 30yr · 1.5% tax · 5.0% vac · 8.0% maint · 8.0% mgmt
Financing live
Cash to close
- Down payment
- $18,750
- Closing costs
- $2,250
- Reserves months
- —
- Total cash needed
- —
Loan-product check · same deal, 3 products live
Conventional
25% down · 7.5% · 30yr
- Down + closing
- —
- Monthly P&I
- —
- Monthly cashflow
- —
- DSCR
- —
- Eligible?
- —
Personal DTI + credit; lowest rate.
DSCR
20% down · 8.5% · 30yr
- Down + closing
- —
- Monthly P&I
- —
- Monthly cashflow
- —
- DSCR
- —
- Eligible?
- —
No personal income docs; deal must DSCR.
Hard money
10% down · 12.0% · 12mo
- Down + closing
- —
- Monthly P&I
- —
- Monthly cashflow
- —
- DSCR
- —
- Eligible?
- —
Short-term bridge; refi at stabilization.
HOA detail
- Monthly dues
- $188 · $2,256/yr
Listing history 24 events
-
2026-06-21days on market $75,000 Active 131 DOM
-
2026-06-18days on market $75,000 Active 128 DOM
-
2026-06-17days on market $75,000 Active 127 DOM
-
2026-06-16days on market $75,000 Active 126 DOM
-
2026-06-15days on market $75,000 Active 125 DOM
-
2026-06-13days on market $75,000 Active 123 DOM
-
2026-06-13pricedays on market $75,000 Active 122 DOM
-
2026-06-10days on market $84,900 Active 120 DOM
-
2026-06-09days on market $84,900 Active 119 DOM
-
2026-06-08days on market $84,900 Active 118 DOM
-
2026-06-08days on market $84,900 Active 117 DOM
-
2026-06-05days on market $84,900 Active 114 DOM
-
2026-06-03days on market $84,900 Active 113 DOM
-
2026-06-02days on market $84,900 Active 112 DOM
-
2026-06-01days on market $84,900 Active 111 DOM
-
2026-05-31days on market $84,900 Active 110 DOM
-
2026-05-18price $84,900
-
2026-05-18status Active
-
2026-05-08status Pending
-
2026-04-24price $89,900
-
2026-03-11price $100,000
-
2026-02-21price $140,000
-
2026-01-30$145,000 Active
-
1985-12-01soldstatus $14,000
ⓘ Source: listings_history table (triggers on properties + properties_extension) + one-shot
backfill from property_details.listing_events for pre-trigger history.
Tax reassessment forecast FL · Resets to sale price
- Current annual tax
- $1,594 · $133/mo
- Projected year-2 tax
- $1,594 · $133/mo
- Expected delta
- $0/yr ($0/mo · 0.0%)
ⓘ Screening estimate from a state-policy table — verify with the county assessor before closing.
Climate risk First Street
- Flood 6/10 Major FEMA zone X (shaded) · 54% chance over 30 yrs
- Wildfire 4/10 Moderate
- Heat 10/10 Extreme 7 d/yr ≥107°F today · 28 d/yr by 30 yrs out
- Wind 10/10 Extreme 99% chance of damaging wind over 30 yrs
- Air quality 3/10 Moderate 2 unhealthy d/yr today · 2 by 30 yrs out
Nearby sold comps map
Loading sold comps map…
Walkable amenities ~0.75 mi
Loading nearby amenities…
Taxation est. · year 1
- Rental income
- $26,807
- − Mortgage interest
- −$4,201
- − Property taxes
- −$1,594
- − Insurance
- −$375
- − Repairs & maintenance
- −$2,145
- − Management
- −$2,145
- − HOA
- −$2,256
- − Depreciation
- −$2,182
- Taxable income
- $11,910
- Est. tax owed @ 24.0%
- −$2,858
- After-tax cash flow
- $9,375/yr
For passive investors: Depreciation is non-cash, so a rental often shows a tax loss while cash-flowing — sheltering income. Rental losses are passive: they offset passive income freely, and up to $25,000/yr can offset ordinary (W-2) income if you actively participate and your MAGI is under $100k (phasing out to $0 by $150k); unused losses carry forward. On sale, claimed depreciation is recaptured at up to 25%, and gains may owe capital-gains tax (a 1031 exchange can defer both). Figures are a year-1 estimate at your 24.0% rate — not tax advice; consult a CPA.
Schools (NCES district)
- District
- Sarasota
- NCES district ID
- 1201680
- Math proficiency
- 63% ▼ -8.00%
- Reading proficiency
- 63% ▼ -3.00%
- Median HH income
- $51,167
- Composite
- 53.68/100
- National rank
- #1428
- State rank
- #7 of 73 in FL
Livability — Englewood
- Score
- 73/100
- State rank
- #321
- US rank
- #5655
Category grades
Schools grade is shown separately in the Schools card above.
Census & demographics
- Census place
- Englewood, FL
- County
- Sarasota County · 448,376 people
- City population
- 35,420
- Metro
- North Port-Sarasota-Bradenton, FL
- Population (ZIP)
- 19,884
- Household income
- $76,016
- Rent vs Own
- Severe rent burden
- 290.0
Population outlook (Sarasota County) Hauer SSP2
- Today (2025)
- 452,380 people
- By 2030
- 474,175 · +4.8%
- By 2040
- 511,577 · +13.1%
- By 2050
- 541,467 · +19.7%
- By 2075
- 604,947 · +33.7%
- By 2100
- 621,965 · +37.5%
Race, ethnicity, and origin ACS 2023
- Neighborhood character
- Predominantly White (94%)
- Race & ethnicity
- White 94% Two or more races 3% Hispanic / Latino 3% Asian 1%
- Common ancestry
- Romanian 7% Lithuanian 4% Iranian 2%
- Foreign-born
- 9% · Canada
- Languages at home
- 94% English-only · German/W. Germanic 2% Spanish 1% Other Indo-European 1%
Political lean MEDSL · Sarasota
- 2024 margin
- R (+18.2) · D 40.5% · R 58.7%
- 2008→2024 swing
- -18.1pp toward R · 2008: -0.1pp · 2024: -18.2pp
- All cycles
- 2024: R+18.2 2020: R+10.4 2016: R+11.6 2012: R+7.4 2008: R+0.1
Not yet ingested
- Civics
- —
Market trends
- HPI YoY
- ▼ -146.26%
- Current HPI
- 281.0529
- Rent YoY
- ▲ 9.02%
- Metro
- North Port-Sarasota-Bradenton, FL
- State GDP YoY
- ▲ 3.28%
- F500 in state
- 36
Industry mix (Fortune 500 HQ in FL)
| Industry | F500 HQs | Revenue |
|---|---|---|
| Industrial Technology | 2 | $29B |
|
||
| Insurance | 2 | $17B |
|
||
| Retail | 1 | $60B |
|
||
| Technology Distribution | 1 | $58B |
|
||
| Homebuilding | 1 | $35B |
|
||
| Technology Manufacturing | 1 | $35B |
|
||
Price history
+506.4% since first listed8 events — show timeline
- 2026-05-18 Price Changed $84,900 Stellar MLS as Distributed by MLS Grid
- 2026-05-18 Relisted — Stellar MLS as Distributed by MLS Grid
- 2026-05-08 Pending — Stellar MLS as Distributed by MLS Grid
- 2026-04-24 Price Changed $89,900 Stellar MLS as Distributed by MLS Grid
- 2026-03-11 Price Changed $100,000 Stellar MLS as Distributed by MLS Grid
- 2026-02-21 Price Changed $140,000 Stellar MLS as Distributed by MLS Grid
- 2026-01-30 Listed $145,000 Stellar MLS as Distributed by MLS Grid
- 1985-12-01 Sold (Public Records) $14,000 Public Records
Property tax history
+6.8%/yrLatest (2025): $1,594 · +7.1% YoY. Source: county tax records.
Cash-flow waterfall
monthlySold comps — $/sqft
last 12 mo · ≤1 miLoading sold comps…