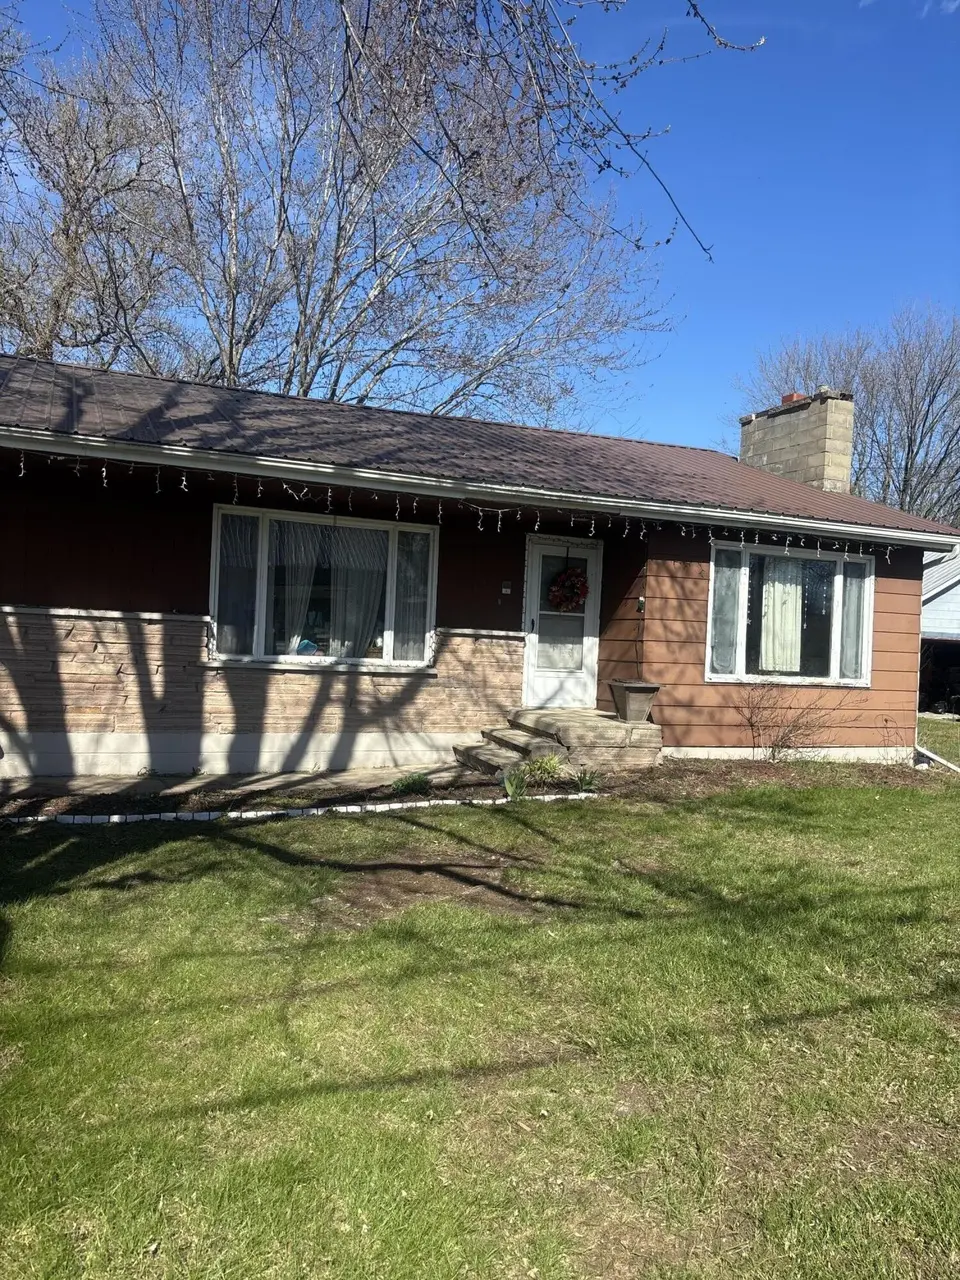
652 County Route 42 · Fort Covington, NY
Flood risk 4/10 · Minor
- FEMA flood zone
- X
- Chance of flooding over 30 yrs
- 0.22%
- Est. flood insurance / yr
- $473 – $860
Fire risk 1/10 · Minimal
- Est. fire insurance / yr
- $691 – $1,283
Heat risk 2/10 · Minimal
- Hot days now (above 93°F)
- 7 days/yr
- Hot days in 30 yrs
- 15 days/yr
Wind risk 1/10 · Minimal
- Chance of severe wind over 30 yrs
- —
Air-quality risk 2/10 · Minimal
- Unhealthy air days now
- 1 days/yr
- Unhealthy air days in 30 yrs
- 1 days/yr
Risk factors via First Street. Map © Google.
Why this score? — see what drove the C- grade
The composite is a weighted blend of 9 inputs, each scored 0–100. Each bar is that input's sub-score; the figure is the points it added to the 100-point composite (weight × sub-score).
- Cash flow +12.9/30.0
- ARV discount +12.6/15.0
- Appreciation +9.8/10.0
- DSCR +3.9/10.0
- 1% rule +3.4/10.0
- Schools +3.2/10.0
- Rent growth +2.5/5.0
- Livability +2.5/5.0
- Condition / age +2.5/5.0
$149,900
🖨 Deal sheet 📄 Offer letter ✓ Due diligence
Listing remarks
This 2-acre property offers a great opportunity for anyone looking to create their own hobby farm or invest in a project home with real potential. Set on a spacious lot, there's plenty of room for gardens, animals, outbuildings, or simply enjoying a rural lifestyle. The home itself is ideal for buyers who want to add value and customize a space to their own style. Located conveniently close to the reservation, the property benefits from lower taxes while still offering easy access to nearby amenities. Whether you're looking for an affordable entry into homeownership, a renovation project, or land to support a small-scale farm, this property presents a unique and flexible opportunity.
Key facts
- 2 acre lot
- 2 garage spots
- Built 1967
Property features AI
Exterior
- Parking: 2-car garage with garage door opener
- Utilities: 200+ amp electrical service; Public sewer
- Home design: Single-family residential home; One-story layout
- Construction: Metal roof; Full basement (unfinished)
- Exterior features: Metal roof; Poultry coop and other outbuildings; 2-acre lot
Interior
- Kitchen: Dishwasher; Electric range; Refrigerator
- Bathrooms: 2 full bathrooms
- Interior features: Fireplace in the living room; Full unfinished basement with sump pump
- Laundry & utility: Laundry in basement
Neighborhood map
What this means for you Summary
Snapshot
- This is a 3-bed/1.5-bath single-family listed at $150k.
Deal economics
- At list price, monthly cash flow is $-10 ($-118/yr) — negative.
- To cash-flow at today's rent, offer at most $148k (1.2% below list).
- To meet the 1% rule (rent ≥ 1% of price), the offer needs to be $126k (16.2% below list).
- Recommended offer: $126k (16.2% below list) — sets the bar for 1% rule.
Location & tenants
- Location reads: area grade C — affects rentability + tenant quality, not the cash-flow math above.
- Salmon River Central School District (rural): math 34% / reading 43% proficiency, ranked #545 of 590 in NY (top 92%) — families likely to look elsewhere, expect single-tenant / working-renter base with shorter leases; 61% free/reduced lunch — lower-income household profile, screen leases tightly.
- Market conditions: 10 active listings in the ZIP; 124 units permitted in Franklin County in 2024 (0 in 5+ unit buildings).
Forward outlook
- In year one you build about $16k of equity ($1k loan paydown + $15k appreciation (9.7% local appreciation)).
- Franklin County population projected at -14% by 2050 — secular population decline; favor cash flow + early exit over multi-decade hold.
- At projected returns (9.7% appreciation + 3.0% rent growth), your $42k cash investment doubles in ~3 years — after that, you're playing with house money.
- By year 3, paydown + projected appreciation supports a ~$39k cash-out refi (75% LTV) — recoverable capital for the next deal without selling this one.
Negotiation context
- It's been on market 43 days — a 3% lower offer ($145k) is reasonable based on typical stale-listing flexibility.
- Current owner paid $108k; 39% above their basis — modest negotiation headroom, anchor on the comps not their cost.
Questions for the listing agent
- What do current leases actually rent for vs. the listed asking? Can we see a recent rent roll and the last 12 months of T-12 income?
- It's been on market 43 days. Have you received any prior offers? Is the seller open to a 16% concession, seller financing, or rate buy-down credit?
- Built in 1967 — when were the roof, HVAC, electrical panel, plumbing, and water heater last replaced?
- Is there a deadline driving the sale (1031 exchange, divorce, estate, relocation)? That informs how much negotiation room exists.
- What's the average days-on-market for RENTAL listings here right now (not sales)? A rising rental-DOM trend means longer vacancies and softer asking-rent achievability than the comps imply.
- What's the recent tenant-quality profile in this submarket — average credit score on applications, eviction rate, late-payment / NSF rate, and stable-employment percentage? A property-management company in the area should have these aggregated.
- How much new for-sale + rental construction is in the pipeline within 1–3 miles? Heavy new supply typically softens prices + rents 12–24 months out; constrained supply supports both.
Investment metrics
- 1% rule
- 0.84% ✗
- Cap rate
- 6.21%
- Cash-on-cash
- -0.28%
- DSCR
- 0.99
- GRM
- 9.9
CMA / ARV
- ARV (median comp)
- $169,070
- List price
- $149,900
- Delta
- -11.34%
- Verdict
- UNDERPRICED
- Comps
- 12 within 1.0 mi
Show comp detail 3 sales within ~0.75 mi
| Address | Dist | Beds/Ba | Sqft | Sold | Price | $/sf | Match |
|---|---|---|---|---|---|---|---|
| 2606 State Route 37 | 0.49mi | 3/1.5 | 1,868 (+6%) | 2mo | $150,000 | $80 | 65 |
| 723 Salmon St | 0.34mi | 3/1.5 | 1,826 (+4%) | 21mo | $99,900 | $55 | 60 |
| 2411 Chateaugay St | 0.43mi | 3/1.0 | 1,578 (-10%) | 19mo | $135,000 | $86 | 45 |
Match score weights: distance 35% · size 25% · config 20% · recency 20%. Top-matched comps best support the ARV.
Projected returns pro-forma
9.69% appreciation · 3.0% rent growth · sell at horizon
- IRR
- 23.4%
- Equity multiple
- 2.85×
- Total profit
- $77,791
- Equity at exit
- $131,618
- IRR
- 20.9%
- Equity multiple
- 6.45×
- Total profit
- $228,755
- Equity at exit
- $280,273
Cash invested: $41,972 (down + closing). Projections, not guarantees.
Landlord ↔ Tenant lean methodology
- Overall (STATE)
- 15 Strongly Tenant-Friendly
- State New York
- 15 Strongly Tenant-Friendly · D+10
- County
- — inherits STATE
- City
- — inherits STATE
ZIP-level market 12937
- Home prices YoY
- 3.7%
- Active inventory
- 10
- Price-to-rent
- 9.9×
Monthly cashflow live
- Estimated rent
- $1,255 medium interval (Pro) →
- Mortgage (P&I)
- −$786
- Tax from tax record
- −$153 /mo · $1,838/yr
- Insurance
- −$62
- HOA
- −$0
- Vacancy / Maint / Mgmt
- −$264
- Net cashflow
- $-10
Break-even live
UW: 25.0% down · 7.5% · 30yr · 1.5% tax · 5.0% vac · 8.0% maint · 8.0% mgmt
Financing live
Cash to close
- Down payment
- $37,475
- Closing costs
- $4,497
- Reserves months
- —
- Total cash needed
- —
Loan-product check · same deal, 3 products live
Conventional
25% down · 7.5% · 30yr
- Down + closing
- —
- Monthly P&I
- —
- Monthly cashflow
- —
- DSCR
- —
- Eligible?
- —
Personal DTI + credit; lowest rate.
DSCR
20% down · 8.5% · 30yr
- Down + closing
- —
- Monthly P&I
- —
- Monthly cashflow
- —
- DSCR
- —
- Eligible?
- —
No personal income docs; deal must DSCR.
Hard money
10% down · 12.0% · 12mo
- Down + closing
- —
- Monthly P&I
- —
- Monthly cashflow
- —
- DSCR
- —
- Eligible?
- —
Short-term bridge; refi at stabilization.
Listing history 17 events
-
2026-06-18days on market $149,900 Active 43 DOM
-
2026-06-17days on market $149,900 Active 42 DOM
-
2026-06-16days on market $149,900 Active 41 DOM
-
2026-06-15days on market $149,900 Active 40 DOM
-
2026-06-13days on market $149,900 Active 38 DOM
-
2026-06-12days on market $149,900 Active 37 DOM
-
2026-06-09days on market $149,900 Active 34 DOM
-
2026-06-08days on market $149,900 Active 33 DOM
-
2026-06-07days on market $149,900 Active 32 DOM
-
2026-06-05days on market $149,900 Active 30 DOM
-
2026-06-04days on market $149,900 Active 28 DOM
-
2026-06-02days on market $149,900 Active 27 DOM
-
2026-06-01days on market $149,900 Active 26 DOM
-
2026-05-31days on market $149,900 Active 25 DOM
-
2026-05-06$149,900 Active 692-char remark
-
2013-05-17soldstatus $108,000
-
2007-01-26soldstatus $69,100
ⓘ Source: listings_history table (triggers on properties + properties_extension) + one-shot
backfill from property_details.listing_events for pre-trigger history.
Tax reassessment forecast NY · Partial reset (capped growth)
- Current annual tax
- $1,838 · $153/mo
- Projected year-2 tax
- $2,185 · $182/mo
- Expected delta
- +$348/yr (+$29/mo · 18.9%)
ⓘ Screening estimate from a state-policy table — verify with the county assessor before closing.
Climate risk First Street
- Flood 4/10 Moderate FEMA zone X · 22% chance over 30 yrs
- Wildfire 1/10 Low
- Heat 2/10 Low 7 d/yr ≥93°F today · 15 d/yr by 30 yrs out
- Wind 1/10 Low
- Air quality 2/10 Low 1 unhealthy d/yr today · 1 by 30 yrs out
Nearby sold comps map
Loading sold comps map…
Walkable amenities ~0.75 mi
Loading nearby amenities…
Taxation est. · year 1
- Rental income
- $15,066
- − Mortgage interest
- −$8,397
- − Property taxes
- −$1,838
- − Insurance
- −$750
- − Repairs & maintenance
- −$1,205
- − Management
- −$1,205
- − Depreciation
- −$4,361
- Taxable loss
- −$2,689
- Est. tax savings @ 24.0%
- +$645
- After-tax cash flow
- $527/yr
For passive investors: Depreciation is non-cash, so a rental often shows a tax loss while cash-flowing — sheltering income. Rental losses are passive: they offset passive income freely, and up to $25,000/yr can offset ordinary (W-2) income if you actively participate and your MAGI is under $100k (phasing out to $0 by $150k); unused losses carry forward. On sale, claimed depreciation is recaptured at up to 25%, and gains may owe capital-gains tax (a 1031 exchange can defer both). Figures are a year-1 estimate at your 24.0% rate — not tax advice; consult a CPA.
Schools (NCES district)
- District
- Salmon River Central School District
- NCES district ID
- 3625500
- Math proficiency
- 34% ▼ -1.00%
- Reading proficiency
- 43% ▲ 7.00%
- Median HH income
- $39,710
- Composite
- 32.24/100
- National rank
- #5770
- State rank
- #545 of 590 in NY
Livability — Fort Covington
No livability data for this city. (Only ~50 U.S. cities are tracked.)
Census & demographics
- Census place
- Fort Covington, NY
- City population
- 1,340
- Population (ZIP)
- 1,340
Population outlook (Franklin County) Hauer SSP2
- Today (2025)
- 48,098 people
- By 2030
- 46,790 · -2.7%
- By 2040
- 44,400 · -7.7%
- By 2050
- 41,256 · -14.2%
- By 2075
- 32,190 · -33.1%
- By 2100
- 23,407 · -51.3%
Race, ethnicity, and origin ACS 2023
- Neighborhood character
- Predominantly White (91%)
- Race & ethnicity
- White 91% Native American 4% Two or more races 3%
- Common ancestry
- Lithuanian 17% Italian 6% Slovak 2%
- Foreign-born
- 1% · Canada
- Languages at home
- 85% English-only · German/W. Germanic 12%
Political lean MEDSL · Franklin
- 2024 margin
- Lean R (+9.0) · D 45.5% · R 54.5%
- 2008→2024 swing
- -31.2pp toward R · 2008: 22.2pp · 2024: -9.0pp
- All cycles
- 2024: R+9.0 2020: R+2.2 2016: R+7.4 2012: D+26.3 2008: D+22.2
Not yet ingested
- Civics
- —
Market trends
- HPI YoY
- ▲ 9.69%
- Current HPI
- 273.8496
- Rent YoY
- —
- Metro
- —
- State GDP YoY
- ▲ 2.60%
- F500 in state
- 92
Industry mix (Fortune 500 HQ in NY)
| Industry | F500 HQs | Revenue |
|---|---|---|
| Financial Services | 10 | $950B |
|
||
| Consumer Goods | 9 | $162B |
|
||
| Insurance | 4 | $225B |
|
||
| Telecommunications | 2 | $144B |
|
||
| Pharmaceuticals | 2 | $112B |
|
||
| Media / Entertainment | 2 | $69B |
|
||
Price history
+116.9% since first listed3 events — show timeline
- 2026-05-06 Listed $149,900 ACVMLS
- 2013-05-17 Sold (Public Records) $108,000 Public Records
- 2007-01-26 Sold (Public Records) $69,100 Public Records
Property tax history
+1.7%/yrLatest (2025): $1,838 · +0.3% YoY. Source: county tax records.
Cash-flow waterfall
monthlySold comps — $/sqft
last 12 mo · ≤1 miLoading sold comps…