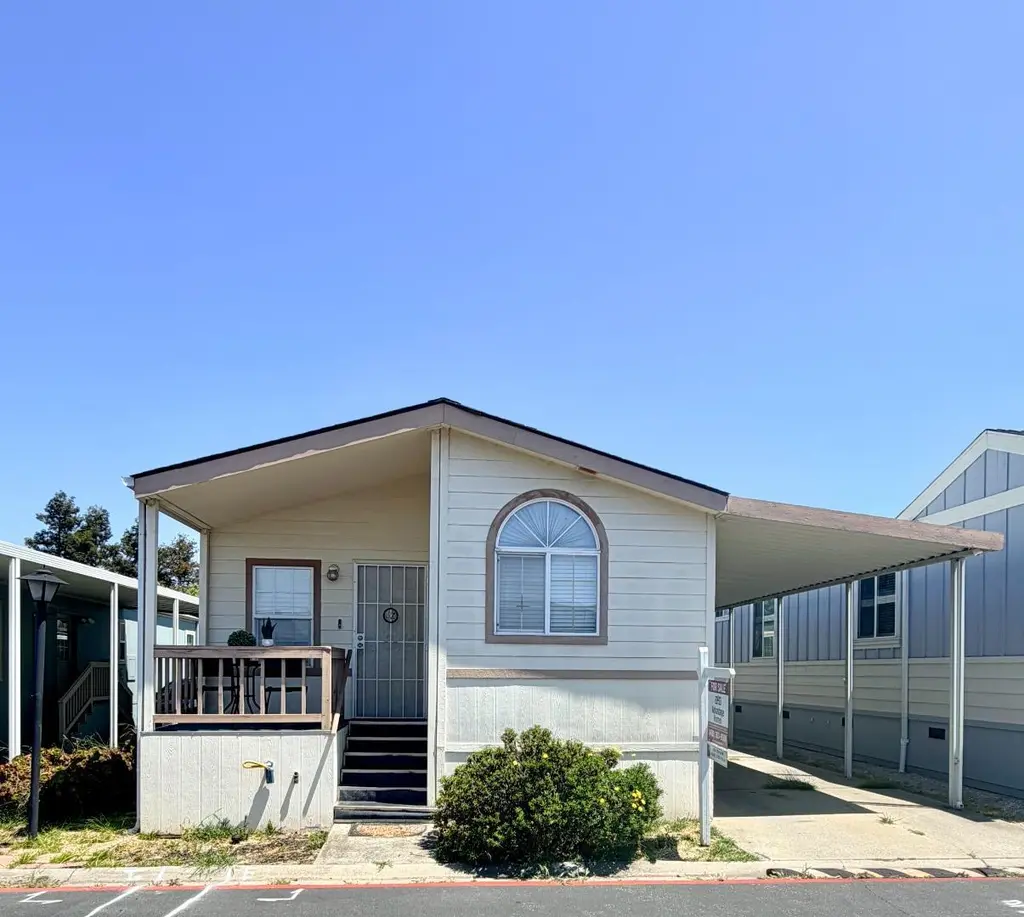
555 Umbarger Rd #43 · San Jose, CA
Flood risk 4/10 · Minor
- FEMA flood zone
- D
- Chance of flooding over 30 yrs
- 0.21%
- Est. flood insurance / yr
- $544 – $1,084
Fire risk 1/10 · Minimal
- Est. fire insurance / yr
- $659 – $1,223
Heat risk 5/10 · Moderate
- Hot days now (above 95°F)
- 7 days/yr
- Hot days in 30 yrs
- 14 days/yr
Wind risk 1/10 · Minimal
- Chance of severe wind over 30 yrs
- —
Air-quality risk 9/10 · Severe
- Unhealthy air days now
- 19 days/yr
- Unhealthy air days in 30 yrs
- 19 days/yr
Risk factors via First Street. Map © Google.
Why this score? — see what drove the B- grade
The composite is a weighted blend of 9 inputs, each scored 0–100. Each bar is that input's sub-score; the figure is the points it added to the 100-point composite (weight × sub-score).
- Cash flow +25.8/30.0
- ARV discount +13.0/15.0
- DSCR +8.6/10.0
- 1% rule +5.5/10.0
- Schools +5.5/10.0
- Livability +3.9/5.0
- Rent growth +2.8/5.0
- Condition / age +2.5/5.0
- Appreciation +0.0/10.0
$309,900
🖨 Deal sheet 📄 Offer letter ✓ Due diligence
Listing remarks MLS
Invest in your future with this bright and spacious 2-bedroom, 2-bathroom home in the highly sought-after, all-age community of San Jose Verde. Built in 2001 and spanning approximately 1,110 square feet, this meticulously maintained residence features soaring vaulted ceilings, dual-pane windows for energy efficiency, and a modern open-concept kitchen complete with a convenient snack bar and tile-edged countertops. The split floor plan offers a generous master suite with a private bath and large closet, while the dedicated indoor laundry room and central heating/cooling provide the everyday comforts of a traditional home. Outside, you'll find a private 2-car carport and a charming wrap-around yard perfect for gardening or creating a quiet outdoor retreat. Located just minutes from The Plant shopping center and major Silicon Valley commuter routes, this home offers a monthly space rent of $1,686, making it an incredible opportunity for first-time buyers.
Key facts
- Central heating
- Open-concept kitchen
- Private bath
Tags
Property features AI
Finance
- Other: Park home serial numbers: 17308511A and 17308511B
- HOA & community: Clubhouse; Community pool; Recreation room; Sauna / spa / hot tub
Exterior
- Parking: Carport with space for 3 vehicles (minimum); Assigned space number 43; Monthly space rent charged
- Utilities: Private co-op water; Community sewer/septic; Individual electric meters
- Home design: Manufactured/mobile home (park home)
- Construction: 1,116 living area (reported)
- Exterior features: Composition roof; Property listed as family park; Leased land for the park home site
Interior
- Kitchen: Kitchen included in kitchen/family room combo
- Bedrooms: 2 bedrooms
- Bathrooms: 2 full bathrooms
- Heating & cooling: Central forced air cooling; Wall furnace heating
- Interior features: Kitchen and family room combined; Dining area within the living room
Neighborhood map
What this means for you Summary
Snapshot
- This is a 2-bed/2.0-bath manufactured listed at $310k.
Deal economics
- At list price, monthly cash flow is $754 ($9k/yr) — positive.
- The deal already cash-flows at list — no discount required.
- Meets the 1% rule at list price ($3k rent vs $310k).
- Recommended offer: $301k (3.0% below list) — sets the bar for market timing.
- Cap rate 9.2% vs local median 1.6% in San Jose — top-decile yield for the area; either an underpriced asset or a hidden risk that comps aren't pricing in. Stress-test before assuming the spread holds.
Location & tenants
- Location reads 78/100 on livability (#68 in CA, #2,559 nationally) — a middle-class / working-renter tenant base. Strengths: amenities A+, commute A+, employment A+; Watch: crime F, cost of living F.
- East Side Union High (urban): math 53% / reading 70% proficiency, ranked #69 of 517 in CA (top 13%) — acceptable for families but not a draw, mixed tenant base, ~2y average lease.
- Market conditions: Rents rising (+1.0%/yr); 65 active listings in the ZIP; 12 comparable units currently listed for rent nearby; rentals leasing fast (median 2d on market — plan ~1-2 weeks tenant-placement turnaround); solid renter incomes; 3,838 units permitted in Santa Clara County in 2024 (1,886 in 5+ unit buildings).
- This rent runs 38% of the median local income ($101k/yr) — at the standard rent-burdened threshold; future hikes will face affordability resistance.
Forward outlook
- Local home prices are declining (-3.0%/yr); year-one equity from $2k of loan paydown is wiped out by about $9k of value loss. Plan a longer hold.
- Santa Clara County population projected at +24% by 2050 — long-run rental-demand tailwind backs the buy-and-hold thesis.
Negotiation context
- It's been on market 31 days — a 3% lower offer ($301k) is reasonable based on typical stale-listing flexibility.
- 5 sale attempts since 6y ago with the ask held roughly flat each time — persistent listings suggest the price (not the market) is what's stuck; bring a comps-based counter.
- Current owner paid $162k; list at $310k implies a 91% gain — meaningful room to come down on a strong offer.
Risks & watch-outs
- Climate carrying-cost: extreme-heat days projected 7→14/yr by 2055 (HVAC capex compounding) — expect insurance premiums to compound above CPI over the hold.
Questions for the listing agent
- It's been on market 31 days. Have you received any prior offers? Is the seller open to a 3% concession, seller financing, or rate buy-down credit?
- Is there a deadline driving the sale (1031 exchange, divorce, estate, relocation)? That informs how much negotiation room exists.
- Crime grade is F in this area — have there been break-ins, vandalism, or insurance claims at this property in the last 3 years? What carrier currently insures it and at what premium?
- What's the average days-on-market for RENTAL listings here right now (not sales)? A rising rental-DOM trend means longer vacancies and softer asking-rent achievability than the comps imply.
- What's the recent tenant-quality profile in this submarket — average credit score on applications, eviction rate, late-payment / NSF rate, and stable-employment percentage? A property-management company in the area should have these aggregated.
- How much new for-sale + rental construction is in the pipeline within 1–3 miles? Heavy new supply typically softens prices + rents 12–24 months out; constrained supply supports both.
Investment metrics
- 1% rule
- 1.05% ✓
- Cap rate
- 9.21%
- Cash-on-cash
- 10.43%
- DSCR
- 1.46
- GRM
- 8.0
CMA / ARV
- ARV (on-the-fly)
- $352,656
- Comps found
- 12
Show comp detail 12 sales within ~0.75 mi
| Address | Dist | Beds/Ba | Sqft | Sold | Price | $/sf | Match |
|---|---|---|---|---|---|---|---|
| 555 Umbarger Rd #134 | 0.09mi | 2/2.0 | 1,128 (+1%) | 4mo | $371,000 | $329 | 90 |
| 555 Umbarger Rd #124 | 0.00mi | 2/2.0 | 1,172 (+5%) | 4mo | $370,000 | $316 | 89 |
| 555 Umbarger Rd #75 | 0.00mi | 2/2.0 | 1,020 (-9%) | 1mo | $330,000 | $324 | 85 |
| 2855 Senter Rd #1 | 0.23mi | 2/2.0 | 1,120 (+0%) | 6mo | $258,000 | $230 | 84 |
| 2600 Senter Rd #121 | 0.19mi | 3/2.0 (+1) | 1,120 (+0%) | 2mo | $430,000 | $384 | 84 |
| 555 Umbarger Rd #108 | 0.00mi | 3/2.0 (+1) | 1,200 (+8%) | 0mo | $368,000 | $307 | 82 |
| 411 Lewis Rd #419 | 0.28mi | 3/2.0 (+1) | 1,104 (-1%) | 1mo | $348,000 | $315 | 79 |
| 2600 Senter Rd #50 | 0.33mi | 2/2.0 | 1,146 (+3%) | 2mo | $400,000 | $349 | 79 |
| 2580 Senter Rd #434 | 0.36mi | 3/2.0 (+1) | 1,100 (-1%) | 5mo | $366,000 | $333 | 71 |
| 411 Lewis Rd #440 | 0.41mi | 2/2.0 | 1,040 (-7%) | 2mo | $205,000 | $197 | 68 |
| 2855 Senter Rd #172 | 0.21mi | 2/2.0 | 960 (-14%) | 5mo | $205,000 | $214 | 63 |
| 411 Lewis Rd #235 | 0.41mi | 3/2.0 (+1) | 983 (-12%) | 5mo | $255,000 | $259 | 52 |
Match score weights: distance 35% · size 25% · config 20% · recency 20%. Top-matched comps best support the ARV.
Projected returns pro-forma
-3.0% appreciation · 1.0% rent growth · sell at horizon
- IRR
- -2.7%
- Equity multiple
- 0.90×
- Total profit
- $-8,758
- Equity at exit
- $46,207
- IRR
- 4.8%
- Equity multiple
- 1.33×
- Total profit
- $28,335
- Equity at exit
- $26,794
Cash invested: $86,772 (down + closing). Projections, not guarantees.
Landlord ↔ Tenant lean methodology
- Overall (CITY)
- 0 Strongly Tenant-Friendly
- State California
- 18 Strongly Tenant-Friendly · D+13
- County
- — inherits STATE
- City San Jose
- 0 Strongly Tenant-Friendly · D+24
ZIP-level market 95111
- Rents YoY
- 1.0%
- Active inventory
- 65
- Price-to-rent
- 8.0×
Monthly cashflow live
- Estimated rent
- $3,245 high interval (Pro) →
- Mortgage (P&I)
- −$1,625
- Tax from tax record
- −$55 /mo · $664/yr
- Insurance
- −$129
- HOA
- −$0
- Vacancy / Maint / Mgmt
- −$681
- Net cashflow
- $754
Break-even live
UW: 25.0% down · 7.5% · 30yr · 1.5% tax · 5.0% vac · 8.0% maint · 8.0% mgmt
Financing live
Cash to close
- Down payment
- $77,475
- Closing costs
- $9,297
- Reserves months
- —
- Total cash needed
- —
Loan-product check · same deal, 3 products live
Conventional
25% down · 7.5% · 30yr
- Down + closing
- —
- Monthly P&I
- —
- Monthly cashflow
- —
- DSCR
- —
- Eligible?
- —
Personal DTI + credit; lowest rate.
DSCR
20% down · 8.5% · 30yr
- Down + closing
- —
- Monthly P&I
- —
- Monthly cashflow
- —
- DSCR
- —
- Eligible?
- —
No personal income docs; deal must DSCR.
Hard money
10% down · 12.0% · 12mo
- Down + closing
- —
- Monthly P&I
- —
- Monthly cashflow
- —
- DSCR
- —
- Eligible?
- —
Short-term bridge; refi at stabilization.
Rent comps 12 comps
| Address | Beds | Baths | Sqft | Rent | $/sqft | DOM | Units | Dist |
|---|---|---|---|---|---|---|---|---|
| 200 Lewis Rd San Jose, CA | 1.0–3.0 | 1.0–2.0 | 867 | $2,551 | $2.94 | 1d | 1 | 0.58mi |
| 88 Montecito Vista Dr San Jose, CA | 2.0 | 2.0 | 840 | $2,691 | $3.20 | 1d | 1 | 0.87mi |
| 995 Tully Rd San Jose, CA | 2.0 | 1.0 | 819 | $3,278 | $4.00 | 1d | 6 | 0.91mi |
| 3129 Kenland Dr San Jose, CA | 3.0 | 2.0 | 1094 | $3,450 | $3.15 | 1d | 1 | 0.93mi |
| 287 Kenbrook Cir San Jose, CA | 2.0 | 2.0 | 1012 | $2,795 | $2.76 | 1d | 1 | 1.01mi |
| 978 Summerplace Dr San Jose, CA | 1.0 | 1.0 | 730 | $2,395 | $3.28 | 16d | 1 | 1.24mi |
| 1006 Summerplace Dr San Jose, CA | 2.0 | 2.5 | 1068 | $3,650 | $3.42 | 1d | 1 | 1.25mi |
| 1068 Summershore Ct San Jose, CA | 1.0 | 1.0 | 730 | $2,500 | $3.42 | 16d | 1 | 1.29mi |
| 2988 Grassina St #309 San Jose, CA | 2.0 | 2.0 | 1048 | $3,600 | $3.44 | 1d | 1 | 1.38mi |
| 1746 Bevin Brook Dr San Jose, CA | 3.0 | 3.0 | 1201 | $3,700 | $3.08 | 1d | 1 | 1.39mi |
| 334 Olive Hill Dr San Jose, CA | 2.0 | 3.0 | 1368 | $4,150 | $3.03 | 1d | 1 | 1.41mi |
| 2586 Tosca Way San Jose, CA | 3.0 | 1.5 | 1176 | $3,900 | $3.32 | 1d | 1 | 1.41mi |
Listing history 27 events
-
2026-06-18days on market $309,900 Active 31 DOM
-
2026-06-17days on market $309,900 Active 30 DOM
-
2026-06-16days on market $309,900 Active 29 DOM
-
2026-06-15days on market $309,900 Active 28 DOM
-
2026-06-13days on market $309,900 Active 26 DOM
-
2026-06-13days on market $309,900 Active 25 DOM
-
2026-06-09days on market $309,900 Active 22 DOM
-
2026-06-08days on market $309,900 Active 21 DOM
-
2026-06-07days on market $309,900 Active 20 DOM
-
2026-06-05days on market $309,900 Active 17 DOM
-
2026-06-03days on market $309,900 Active 16 DOM
-
2026-06-02days on market $309,900 Active 15 DOM
-
2026-06-01days on market $309,900 Active 14 DOM
-
2026-05-31days on market $309,900 Active 13 DOM
-
2026-05-18$309,900 Active 966-char remark
Show marketing remark (966 chars)
Invest in your future with this bright and spacious 2-bedroom, 2-bathroom home in the highly sought-after, all-age community of San Jose Verde. Built in 2001 and spanning approximately 1,110 square feet, this meticulously maintained residence features soaring vaulted ceilings, dual-pane windows for energy efficiency, and a modern open-concept kitchen complete with a convenient snack bar and tile-edged countertops. The split floor plan offers a generous master suite with a private bath and large closet, while the dedicated indoor laundry room and central heating/cooling provide the everyday comforts of a traditional home. Outside, you'll find a private 2-car carport and a charming wrap-around yard perfect for gardening or creating a quiet outdoor retreat. Located just minutes from The Plant shopping center and major Silicon Valley commuter routes, this home offers a monthly space rent of $1,686, making it an incredible opportunity for first-time buyers.
-
2026-04-05historical
-
2025-10-10price
-
2025-09-26price
-
2025-08-22price
-
2025-08-04Active
-
2020-06-11soldstatus $162,500 Sold
-
2020-06-03status Pending (Do Not Show)
-
2020-05-01historical Contingent
-
2020-03-22status Active
-
2020-02-27historical Contingent
-
2020-01-15$179,000 Active
ⓘ Source: listings_history table (triggers on properties + properties_extension) + one-shot
backfill from property_details.listing_events for pre-trigger history.
Tax reassessment forecast CA · Resets to sale price
- Current annual tax
- $664 · $55/mo
- Projected year-2 tax
- $2,355 · $196/mo
- Expected delta
- +$1,691/yr (+$141/mo · 254.7%)
ⓘ Screening estimate from a state-policy table — verify with the county assessor before closing.
Climate risk First Street
- Flood 4/10 Moderate FEMA zone D · 21% chance over 30 yrs
- Wildfire 1/10 Low
- Heat 5/10 Major 7 d/yr ≥95°F today · 14 d/yr by 30 yrs out
- Wind 1/10 Low
- Air quality 9/10 Extreme 19 unhealthy d/yr today · 19 by 30 yrs out
Nearby sold comps map
Loading sold comps map…
Walkable amenities ~0.75 mi
Loading nearby amenities…
Taxation est. · year 1
- Rental income
- $38,940
- − Mortgage interest
- −$17,359
- − Property taxes
- −$664
- − Insurance
- −$1,550
- − Repairs & maintenance
- −$3,115
- − Management
- −$3,115
- − Depreciation
- −$9,015
- Taxable income
- $4,121
- Est. tax owed @ 24.0%
- −$989
- After-tax cash flow
- $8,058/yr
For passive investors: Depreciation is non-cash, so a rental often shows a tax loss while cash-flowing — sheltering income. Rental losses are passive: they offset passive income freely, and up to $25,000/yr can offset ordinary (W-2) income if you actively participate and your MAGI is under $100k (phasing out to $0 by $150k); unused losses carry forward. On sale, claimed depreciation is recaptured at up to 25%, and gains may owe capital-gains tax (a 1031 exchange can defer both). Figures are a year-1 estimate at your 24.0% rate — not tax advice; consult a CPA.
Schools (NCES district)
- District
- East Side Union High
- NCES district ID
- 0611820
- Math proficiency
- 53% ▲ 12.00%
- Reading proficiency
- 70% ▲ 8.00%
- Median HH income
- $80,293
- Composite
- 55.15/100
- National rank
- #1278
- State rank
- #69 of 517 in CA
Livability — San Jose
- Score
- 78/100
- State rank
- #68
- US rank
- #2559
Category grades
Schools grade is shown separately in the Schools card above.
Census & demographics
- Census place
- San Jose, CA
- County
- Santa Clara County · 1,806,974 people
- City population
- 954,479
- Metro
- San Jose-Sunnyvale-Santa Clara, CA
- Population (ZIP)
- 57,202
- Household income
- $101,435
- Rent vs Own
- Severe rent burden
- 1808.0
Population outlook (Santa Clara County) Hauer SSP2
- Today (2025)
- 2,179,074 people
- By 2030
- 2,301,297 · +5.6%
- By 2040
- 2,528,195 · +16.0%
- By 2050
- 2,712,135 · +24.5%
- By 2075
- 2,998,701 · +37.6%
- By 2100
- 2,931,429 · +34.5%
Race, ethnicity, and origin ACS 2023
- Neighborhood character
- Diverse neighborhood (Simpson 0.60)
- Race & ethnicity
- Hispanic / Latino 51% Asian 36% Two or more races 22% White 7% Native American 2% Black 2%
- Hispanic origin (detail)
- Mexican 46%
- Foreign-born
- 45% · Canada, Vietnam, China
- Languages at home
- 27% English-only · Spanish 40% Vietnamese 24% Chinese 3%
Political lean MEDSL · Santa Clara
- 2024 margin
- Solid D (+40.0) · D 68.1% · R 28.1% · Other 3.8%
- 2008→2024 swing
- -0.9pp no change · 2008: 40.9pp · 2024: 40.0pp
- All cycles
- 2024: D+40.0 2020: D+47.4 2016: D+52.5 2012: D+42.1 2008: D+40.9
Not yet ingested
- Civics
- —
Market trends
- HPI YoY
- ▼ -1144.74%
- Current HPI
- 339.7949
- Rent YoY
- ▲ 1.00%
- Metro
- San Jose-Sunnyvale-Santa Clara, CA
- State GDP YoY
- ▲ 3.21%
- F500 in state
- 116
Industry mix (Fortune 500 HQ in CA)
| Industry | F500 HQs | Revenue |
|---|---|---|
| Technology | 27 | $1,492B |
|
||
| Financial Services | 3 | $174B |
|
||
| Retail | 3 | $44B |
|
||
| Insurance | 3 | $26B |
|
||
| Media / Entertainment | 2 | $115B |
|
||
| Pharmaceuticals / Biotech | 2 | $62B |
|
||
Price history
+73.1% since first listed13 events — show timeline
- 2026-05-18 Listed $309,900 MLSListings
- 2026-05-18 Listed $309,900 bridgeMLS, Bay East AOR, or Contra Costa AOR
- 2026-04-05 Listing Removed — bridgeMLS, Bay East AOR, or Contra Costa AOR
- 2025-10-10 Price Changed — bridgeMLS, Bay East AOR, or Contra Costa AOR
- 2025-09-26 Price Changed — bridgeMLS, Bay East AOR, or Contra Costa AOR
- 2025-08-22 Price Changed — bridgeMLS, Bay East AOR, or Contra Costa AOR
- 2025-08-04 Listed — bridgeMLS, Bay East AOR, or Contra Costa AOR
- 2020-06-11 Sold (MLS) $162,500 MLSListings
- 2020-06-03 Pending — MLSListings
- 2020-05-01 Contingent — MLSListings
- 2020-03-22 Relisted — MLSListings
- 2020-02-27 Contingent — MLSListings
- 2020-01-15 Listed $179,000 MLSListings
Property tax history
-10.6%/yrLatest (2011): $664 · -16.1% YoY. Source: county tax records.
Cash-flow waterfall
monthlySold comps — $/sqft
last 12 mo · ≤1 miLoading sold comps…