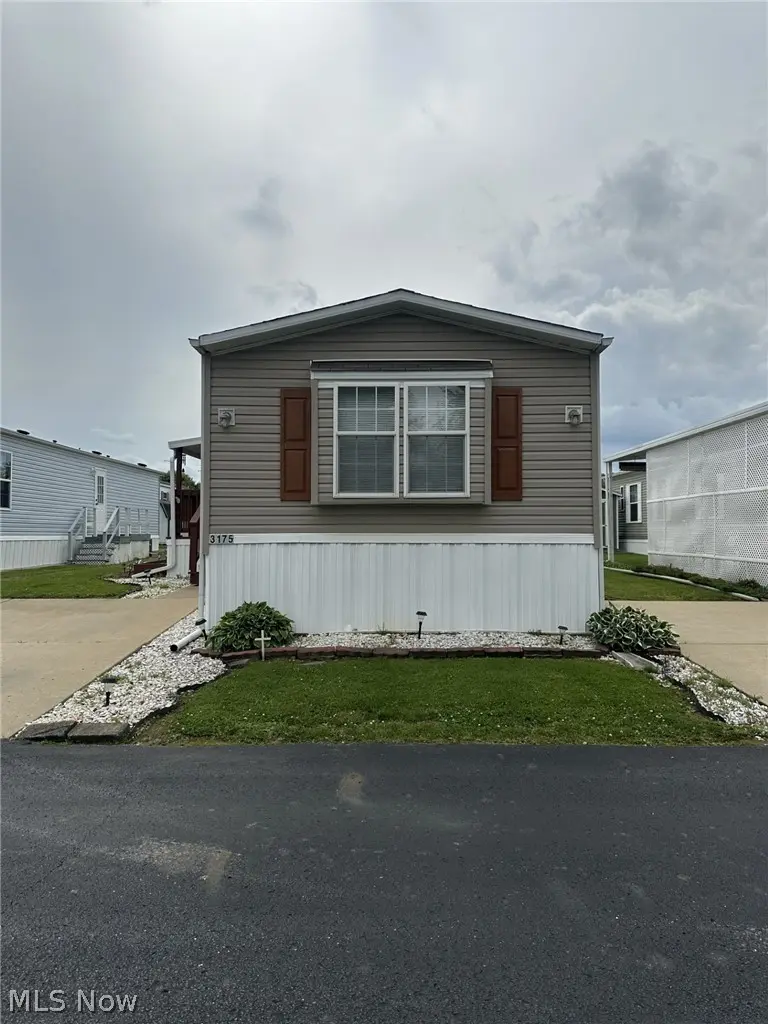
3175 Sugartyme Dr · Zanesville, OH
Flood risk 1/10 · Minimal
- FEMA flood zone
- X (unshaded)
- Chance of flooding over 30 yrs
- 0.0%
- Est. flood insurance / yr
- $507 – $1,088
Fire risk 1/10 · Minimal
- Est. fire insurance / yr
- $713 – $1,323
Heat risk 4/10 · Minor
- Hot days now (above 99°F)
- 7 days/yr
- Hot days in 30 yrs
- 18 days/yr
Wind risk 2/10 · Minimal
- Chance of severe wind over 30 yrs
- 1.0%
Air-quality risk 2/10 · Minimal
- Unhealthy air days now
- 1 days/yr
- Unhealthy air days in 30 yrs
- 1 days/yr
Risk factors via First Street. Map © Google.
Why this score? — see what drove the B grade
The composite is a weighted blend of 9 inputs, each scored 0–100. Each bar is that input's sub-score; the figure is the points it added to the 100-point composite (weight × sub-score).
- Cash flow +30.0/30.0
- 1% rule +10.0/10.0
- DSCR +10.0/10.0
- ARV discount +7.5/15.0
- Schools +4.6/10.0
- Livability +3.7/5.0
- Rent growth +3.6/5.0
- Condition / age +2.2/5.0
- Appreciation +0.0/10.0
$80,000
🖨 Deal sheet 📄 Offer letter ✓ Due diligence
Listing remarks
Welcome home to this beautifully maintained 3-bedroom, 2 full bath mobile home located in a peaceful senior living community offering comfort, convenience, and easy living. Filled with natural light throughout, this home features a spacious owner’s suite complete with two walk-in closets and a private full bath. The functional layout provides comfortable living spaces, perfect for relaxing or entertaining guests. Enjoy the simplicity of low-maintenance living while being conveniently close to town, including the hospital, grocery stores, gas stations, restaurants, and everyday essentials. Whether you’re looking to downsize or simply enjoy a quieter lifestyle, this home offers th
Key facts
- Natural light
- Walk-in closets
- Owner's suite
Tags
Property features AI
Finance
- HOA & community: Senior community; Has land lease ($350)
Exterior
- Parking: Concrete driveway
- Utilities: Public water; Public sewer
- Home design: Single-story home; Shingle roof; Vinyl siding
- Construction: Built according to public records; Vinyl siding construction; Shingle roof
- Exterior features: Deck; Shed(s)
Interior
- Bedrooms: 3 main-level bedrooms
- Bathrooms: 2 full bathrooms; 2 main-level bathrooms
- Heating & cooling: Electric forced-air heating; Central air conditioning
- Interior features: Walk-in closet(s)
Neighborhood map
What this means for you Summary
Snapshot
- This is a 3-bed/2.0-bath single-family listed at $80k. Condition is rated fair.
Deal economics
- At list price, monthly cash flow is $500 ($6k/yr) — positive.
- The deal already cash-flows at list — no discount required.
- Meets the 1% rule at list price ($1k rent vs $80k).
- Recommended offer: $79k (1.5% below list) — sets the bar for market timing.
- Cap rate 13.8% vs local median 3.3% in Zanesville — top-decile yield for the area; either an underpriced asset or a hidden risk that comps aren't pricing in. Stress-test before assuming the spread holds.
Location & tenants
- Location reads 74/100 on livability (#290 in OH, #4,764 nationally) — a middle-class / working-renter tenant base. Strengths: cost of living A+, housing A+, health & safety A+; Watch: schools C-, crime D, commute F.
- West Muskingum Local (rural): math 46% / reading 62% proficiency, ranked #387 of 656 in OH (top 59%) — acceptable for families but not a draw, mixed tenant base, ~2y average lease.
- Market conditions: Rents rising fast (+4.2%/yr); 299 active listings in the ZIP; 140 units permitted in Muskingum County in 2024 (100 in 5+ unit buildings).
Forward outlook
- Local home prices are declining (-3.0%/yr); year-one equity from $553 of loan paydown is wiped out by about $2k of value loss. Plan a longer hold.
- Muskingum County population projected at -10% by 2050 — secular population decline; favor cash flow + early exit over multi-decade hold.
- At projected returns (-3.0% appreciation + 4.2% rent growth), your $22k cash investment doubles in ~5 years — after that, you're playing with house money.
Negotiation context
- It's been on market 23 days — a 2% lower offer ($79k) is reasonable based on typical stale-listing flexibility.
Questions for the listing agent
- Have any recent inspections been done? Can we get a copy of the seller's disclosures and any deferred-maintenance estimates?
- Is there a deadline driving the sale (1031 exchange, divorce, estate, relocation)? That informs how much negotiation room exists.
- Crime grade is D in this area — have there been break-ins, vandalism, or insurance claims at this property in the last 3 years? What carrier currently insures it and at what premium?
- What's the average days-on-market for RENTAL listings here right now (not sales)? A rising rental-DOM trend means longer vacancies and softer asking-rent achievability than the comps imply.
- What's the recent tenant-quality profile in this submarket — average credit score on applications, eviction rate, late-payment / NSF rate, and stable-employment percentage? A property-management company in the area should have these aggregated.
- How much new for-sale + rental construction is in the pipeline within 1–3 miles? Heavy new supply typically softens prices + rents 12–24 months out; constrained supply supports both.
Investment metrics
- 1% rule
- 1.67% ✓
- Cap rate
- 13.80%
- Cash-on-cash
- 26.81%
- DSCR
- 2.19
- GRM
- 5.0
CMA / ARV
- ARV (on-the-fly)
- $288,192
- Comps found
- 4
Show comp detail 4 sales within ~0.75 mi
| Address | Dist | Beds/Ba | Sqft | Sold | Price | $/sf | Match |
|---|---|---|---|---|---|---|---|
| 3195 Sugartyme Dr | 0.02mi | 3/2.0 | 1,216 (0%) | 10mo | $80,000 | $66 | 91 |
| 5130 Northcrest Dr | 0.58mi | 3/2.0 | 1,170 (-4%) | 8mo | $277,000 | $237 | 60 |
| 5070 Northcrest Dr | 0.57mi | 3/2.5 | 1,275 (+5%) | 12mo | $402,000 | $315 | 53 |
| 2500 Ash Meadows Blvd | 0.15mi | 3/3.0 | 1,344 (+10%) | 22mo | $265,000 | $197 | 53 |
Match score weights: distance 35% · size 25% · config 20% · recency 20%. Top-matched comps best support the ARV.
Projected returns pro-forma
-3.0% appreciation · 4.23% rent growth · sell at horizon
- IRR
- 22.1%
- Equity multiple
- 1.92×
- Total profit
- $20,602
- Equity at exit
- $11,928
- IRR
- 30.9%
- Equity multiple
- 3.95×
- Total profit
- $66,094
- Equity at exit
- $6,917
Cash invested: $22,400 (down + closing). Projections, not guarantees.
Landlord ↔ Tenant lean methodology
- Overall (STATE)
- 73 Landlord-Friendly
- State Ohio
- 73 Landlord-Friendly · R+6
- County
- — inherits STATE
- City
- — inherits STATE
ZIP-level market 43701
- Home prices YoY
- -23.2%
- Rents YoY
- 4.2%
- Active inventory
- 299
- Price-to-rent
- 5.0×
Monthly cashflow live
- Estimated rent
- $1,333 medium interval (Pro) →
- Mortgage (P&I)
- −$420
- Tax est. 1.5%
- −$100 /mo · $1,200/yr
- Insurance
- −$33
- HOA
- −$0
- Vacancy / Maint / Mgmt
- −$280
- Net cashflow
- $500
Break-even live
UW: 25.0% down · 7.5% · 30yr · 1.5% tax · 5.0% vac · 8.0% maint · 8.0% mgmt
Financing live
Cash to close
- Down payment
- $20,000
- Closing costs
- $2,400
- Reserves months
- —
- Total cash needed
- —
Loan-product check · same deal, 3 products live
Conventional
25% down · 7.5% · 30yr
- Down + closing
- —
- Monthly P&I
- —
- Monthly cashflow
- —
- DSCR
- —
- Eligible?
- —
Personal DTI + credit; lowest rate.
DSCR
20% down · 8.5% · 30yr
- Down + closing
- —
- Monthly P&I
- —
- Monthly cashflow
- —
- DSCR
- —
- Eligible?
- —
No personal income docs; deal must DSCR.
Hard money
10% down · 12.0% · 12mo
- Down + closing
- —
- Monthly P&I
- —
- Monthly cashflow
- —
- DSCR
- —
- Eligible?
- —
Short-term bridge; refi at stabilization.
Listing history 16 events
-
2026-06-19days on market $80,000 Active 23 DOM
-
2026-06-18days on market $80,000 Active 22 DOM
-
2026-06-17days on market $80,000 Active 21 DOM
-
2026-06-16days on market $80,000 Active 20 DOM
-
2026-06-15days on market $80,000 Active 19 DOM
-
2026-06-14days on market $80,000 Active 17 DOM
-
2026-06-12days on market $80,000 Active 16 DOM
-
2026-06-09days on market $80,000 Active 13 DOM
-
2026-06-08days on market $80,000 Active 12 DOM
-
2026-06-07days on market $80,000 Active 11 DOM
-
2026-06-05days on market $80,000 Active 8 DOM
-
2026-06-02days on market $80,000 Active 6 DOM
-
2026-06-01days on market $80,000 Active 5 DOM
-
2026-05-31days on market $80,000 Active 4 DOM
-
2026-05-30days on market $80,000 Active 3 DOM
-
2026-05-27$80,000 Active
ⓘ Source: listings_history table (triggers on properties + properties_extension) + one-shot
backfill from property_details.listing_events for pre-trigger history.
Climate risk First Street
- Flood 1/10 Low FEMA zone X (unshaded) · 0% chance over 30 yrs
- Wildfire 1/10 Low
- Heat 4/10 Moderate 7 d/yr ≥99°F today · 18 d/yr by 30 yrs out
- Wind 2/10 Low 100% chance of damaging wind over 30 yrs
- Air quality 2/10 Low 1 unhealthy d/yr today · 1 by 30 yrs out
Nearby sold comps map
Loading sold comps map…
Walkable amenities ~0.75 mi
Loading nearby amenities…
Taxation est. · year 1
- Rental income
- $16,000
- − Mortgage interest
- −$4,481
- − Property taxes
- −$1,200
- − Insurance
- −$400
- − Repairs & maintenance
- −$1,280
- − Management
- −$1,280
- − Depreciation
- −$2,327
- Taxable income
- $5,031
- Est. tax owed @ 24.0%
- −$1,208
- After-tax cash flow
- $4,798/yr
For passive investors: Depreciation is non-cash, so a rental often shows a tax loss while cash-flowing — sheltering income. Rental losses are passive: they offset passive income freely, and up to $25,000/yr can offset ordinary (W-2) income if you actively participate and your MAGI is under $100k (phasing out to $0 by $150k); unused losses carry forward. On sale, claimed depreciation is recaptured at up to 25%, and gains may owe capital-gains tax (a 1031 exchange can defer both). Figures are a year-1 estimate at your 24.0% rate — not tax advice; consult a CPA.
Condition & rehab AI · 12 photos
This mobile home is in fair condition with cosmetic updates needed to enhance its appearance and value. Simple repairs and maintenance can significantly improve its resale and rental potential.
Repairs flagged
- Minor paint — paint appears faded and needs touch-up
- Minor landscaping — some overgrown areas need trimming
Value-add opportunities
- Both paint touch-up — Fresh paint can enhance curb appeal and interior aesthetics
- Both landscaping trimming — Well-maintained landscaping can improve curb appeal and attract potential buyers
Renovation cost estimate screening
| Repair item | Severity | Est. cost |
|---|---|---|
| paint · paint appears faded and needs touch-up | Minor | $500–3,000 |
| landscaping · some overgrown areas need trimming | Minor | $500–3,000 |
| Total estimated repair cost · 2 items | $1,000–6,000 |
Value-add ROI direction
- Both paint touch-up — Fresh paint can enhance curb appeal and interior aesthetics ↑
- Both landscaping trimming — Well-maintained landscaping can improve curb appeal and attract potential buyers ↑
ⓘ Cost ranges are severity-bucket heuristics (US national rule-of-thumb). Get contractor quotes + a written scope before underwriting a rehab budget.
Schools (NCES district)
- District
- West Muskingum Local
- NCES district ID
- 3904888
- Math proficiency
- 46% ▼ -14.00%
- Reading proficiency
- 62% ▼ -6.00%
- Median HH income
- $48,119
- Composite
- 45.86/100
- National rank
- #2552
- State rank
- #387 of 656 in OH
Livability — Zanesville
- Score
- 74/100
- State rank
- #290
- US rank
- #4764
Category grades
Schools grade is shown separately in the Schools card above.
Census & demographics
- County
- Muskingum County · 56,402 people
- City population
- 56,402
- Metro
- Zanesville, OH
- Population (ZIP)
- 56,402
- Household income
- $57,565
- Rent vs Own
- Severe rent burden
- 1619.0
Population outlook (Muskingum County) Hauer SSP2
- Today (2025)
- 85,625 people
- By 2030
- 84,592 · -1.2%
- By 2040
- 81,288 · -5.1%
- By 2050
- 76,751 · -10.4%
- By 2075
- 64,143 · -25.1%
- By 2100
- 47,598 · -44.4%
Race, ethnicity, and origin ACS 2023
- Neighborhood character
- Predominantly White (88%)
- Race & ethnicity
- White 88% Two or more races 6% Black 4% Hispanic / Latino 2%
- Common ancestry
- Slovak 2% Iranian 1% Italian 1%
- Foreign-born
- 1% · Canada
- Languages at home
- 98% English-only · Spanish 1%
Political lean MEDSL · Muskingum
- 2024 margin
- Solid R (+43.9) · D 27.6% · R 71.6%
- 2008→2024 swing
- -36.7pp toward R · 2008: -7.2pp · 2024: -43.9pp
- All cycles
- 2024: R+43.9 2020: R+39.3 2016: R+35.0 2012: R+7.0 2008: R+7.2
Not yet ingested
- Civics
- —
Market trends
- HPI YoY
- ▼ -90.41%
- Current HPI
- 298.9994
- Rent YoY
- ▲ 4.23%
- Metro
- Zanesville, OH
- State GDP YoY
- ▲ 1.98%
- F500 in state
- 48
Industry mix (Fortune 500 HQ in OH)
| Industry | F500 HQs | Revenue |
|---|---|---|
| Insurance | 3 | $145B |
|
||
| Industrial Machinery | 3 | $49B |
|
||
| Financial Services | 3 | $24B |
|
||
| Consumer Goods | 2 | $93B |
|
||
| Aerospace / Defense | 2 | $47B |
|
||
| Utilities | 2 | $33B |
|
||
Price history
1 event — show timeline
- 2026-05-27 Listed $80,000 MLSNOW
Cash-flow waterfall
monthlySold comps — $/sqft
last 12 mo · ≤1 miLoading sold comps…