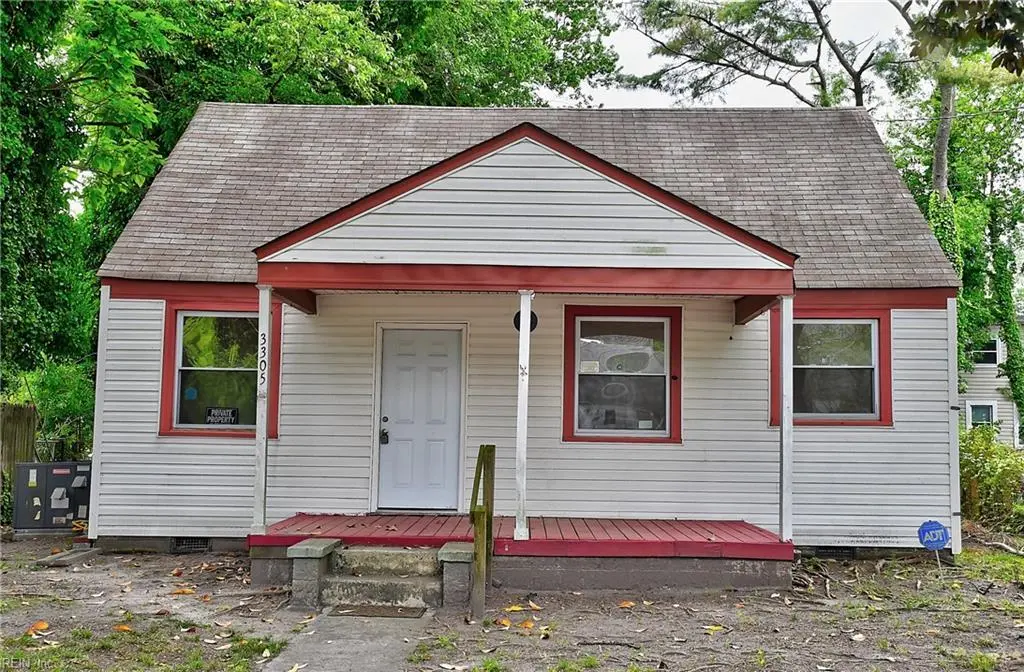
3305 Nelson St · Portsmouth, VA
Flood risk 4/10 · Minor
- FEMA flood zone
- X (unshaded)
- Chance of flooding over 30 yrs
- 0.13%
- Est. flood insurance / yr
- $507 – $1,088
Fire risk 1/10 · Minimal
- Est. fire insurance / yr
- $666 – $1,236
Heat risk 9/10 · Severe
- Hot days now (above 106°F)
- 7 days/yr
- Hot days in 30 yrs
- 16 days/yr
Wind risk 8/10 · Major
- Chance of severe wind over 30 yrs
- 80.0%
Air-quality risk 5/10 · Moderate
- Unhealthy air days now
- 6 days/yr
- Unhealthy air days in 30 yrs
- 7 days/yr
Risk factors via First Street. Map © Google.
Why this score? — see what drove the D grade
The composite is a weighted blend of 9 inputs, each scored 0–100. Each bar is that input's sub-score; the figure is the points it added to the 100-point composite (weight × sub-score).
- ARV discount +12.5/15.0
- Cash flow +11.6/30.0
- Schools +3.9/10.0
- Livability +3.7/5.0
- DSCR +3.4/10.0
- 1% rule +2.8/10.0
- Rent growth +2.5/5.0
- Condition / age +2.5/5.0
- Appreciation +0.0/10.0
$220,000
🖨 Deal sheet (PDF) 📄 Offer letter ✓ Due diligence
Listing remarks
Don't miss this charming 3-bedroom, 1-bath home located in the heart of Portsmouth. Boasting wood floors throughout, this home offers both character and comfort. Ideally situated near shopping, restaurants, and major highways for easy commuting. Perfect for first-time buyers or investors!
Key facts
- Built 1941
- Listed 52 days
Property features AI
Finance
- HOA & community: No HOA fees listed
Exterior
- Parking: Street parking
- Utilities: City/County water; City/County sewer; Electric water heater
- Home design: Detached property; Bungalow / Cape Cod style; 2 stories; Two living levels; Entry level includes a bedroom with full bath
- Construction: Vinyl siding; Asphalt shingle roof; Crawl space foundation
- Exterior features: Located on a cul-de-sac; Partial chain link fence; Has fence
Interior
- Kitchen: Gas range; Refrigerator
- Bedrooms: One bedroom with an ensuite; Bedroom and full bathroom on first floor
- Flooring: Wood flooring; Ceramic flooring
- Bathrooms: One full bathroom
- Heating & cooling: Natural gas heating; Central air conditioning
- Interior features: Ceiling fan; Dual-entry bathroom (bath shared between bedrooms); Attic; Porch
- Laundry & utility: Washer hookup; Dryer hookup
Neighborhood map
What this means for you Summary
Snapshot
- This is a 3-bed/1.0-bath single-family listed at $220k.
Deal economics
- At list price, monthly cash flow is $-67 ($-803/yr) — negative.
- To cash-flow at today's rent, offer at most $208k (5.4% below list).
- To meet the 1% rule (rent ≥ 1% of price), the offer needs to be $172k (21.6% below list).
- Recommended offer: $172k (21.6% below list) — sets the bar for 1% rule.
- Cap rate 5.9% vs local median 4.6% in Portsmouth — meaningfully above typical; check what's discounted (condition, days-on-market, listing class) to confirm the premium yield is real.
Location & tenants
- Location reads 73/100 on livability (#172 in VA) — a middle-class / working-renter tenant base. Strengths: amenities A+, cost of living A+, housing A+; Watch: employment C-, crime F, commute F.
- Portsmouth City Public School District (urban): math 34% / reading 58% proficiency, ranked #107 of 131 in VA (top 82%) — families likely to look elsewhere, expect single-tenant / working-renter base with shorter leases.
- Zoned schools: Westhaven Elementary (math 22% / reading 52%, grade F, #933 of 1,108 statewide, top 86%, 442 students, 100% FRL); William E. Waters Middle (math 47% / reading 72%, grade B, #160 of 342 statewide, top 48%, 534 students, 99% FRL); Churchland High (math 48% / reading 80%, grade B-, #220 of 319 statewide, top 70%, 1,435 students, 100% FRL) — zoned schools average 100% FRL vs 60% district-wide (40 pts higher); higher-poverty schools than district average — tighter screening recommended.
- Market conditions: 86 active listings in the ZIP; 35 comparable units currently listed for rent nearby; rentals at typical pace (median 22d on market — plan ~3-4 weeks tenant-placement turnaround); 300 units permitted in Portsmouth city in 2024 (112 in 5+ unit buildings).
- This rent runs 42% of the median local income ($49k/yr) — at the standard rent-burdened threshold; future hikes will face affordability resistance.
Forward outlook
- Local home prices are declining (-3.0%/yr); year-one equity from $2k of loan paydown is wiped out by about $7k of value loss. Plan a longer hold.
Negotiation context
- It's been on market 52 days — a 3% lower offer ($213k) is reasonable based on typical stale-listing flexibility.
- Current owner paid $62k; list at $220k implies a 254% gain — meaningful room to come down on a strong offer.
Risks & watch-outs
- Watch-outs: built in 1941 — expect roof / HVAC / electrical / plumbing capex.
- Climate carrying-cost: severe wind risk, 80% chance of damaging wind over 30y; extreme-heat days projected 7→16/yr by 2055 (HVAC capex compounding) — expect insurance premiums to compound above CPI over the hold.
Questions for the listing agent
- What do current leases actually rent for vs. the listed asking? Can we see a recent rent roll and the last 12 months of T-12 income?
- It's been on market 52 days. Have you received any prior offers? Is the seller open to a 22% concession, seller financing, or rate buy-down credit?
- Built in 1941 — when were the roof, HVAC, electrical panel, plumbing, and water heater last replaced?
- Is there a deadline driving the sale (1031 exchange, divorce, estate, relocation)? That informs how much negotiation room exists.
- Schools are B-rated — typically a magnet for longer-tenancy family renters. What's the average tenant stay here, and is there a school-zone premium baked into asking?
- Crime grade is F in this area — have there been break-ins, vandalism, or insurance claims at this property in the last 3 years? What carrier currently insures it and at what premium?
- The area grade is low — what's the realistic commute time and amenity access for the typical tenant pool here? Any planned neighborhood developments (good or bad) we should know about?
- What's the average days-on-market for RENTAL listings here right now (not sales)? A rising rental-DOM trend means longer vacancies and softer asking-rent achievability than the comps imply.
- What's the recent tenant-quality profile in this submarket — average credit score on applications, eviction rate, late-payment / NSF rate, and stable-employment percentage? A property-management company in the area should have these aggregated.
- How much new for-sale + rental construction is in the pipeline within 1–3 miles? Heavy new supply typically softens prices + rents 12–24 months out; constrained supply supports both.
Investment metrics
- 1% rule
- 0.78% ✗
- Cap rate
- 5.93%
- Cash-on-cash
- -1.30%
- DSCR
- 0.94
- GRM
- 10.6
CMA / ARV
- ARV (median comp)
- $247,595
- List price
- $220,000
- Delta
- -11.15%
- Verdict
- UNDERPRICED
- Comps
- 20 within 1.0 mi
Show comp detail 12 sales within ~0.75 mi
| Address | Dist | Beds/Ba | Sqft | Sold | Price | $/sf | Match |
|---|---|---|---|---|---|---|---|
| 3306 Brighton St | 0.18mi | 3/2.0 | 1,080 (0%) | 1mo | $238,000 | $220 | 87 |
| 3210 Brighton St | 0.19mi | 4/1.0 (+1) | 1,005 (-7%) | 1mo | $211,000 | $210 | 74 |
| 3505 Brighton St | 0.21mi | 3/2.0 | 1,190 (+10%) | 4mo | $244,750 | $206 | 65 |
| 312 Killian Ave | 0.43mi | 3/1.0 | 992 (-8%) | 2mo | $255,000 | $257 | 65 |
| 9 Shelby St | 0.48mi | 3/2.0 | 1,028 (-5%) | 2mo | $239,000 | $232 | 64 |
| 3521 County St | 0.65mi | 3/1.0 | 1,020 (-6%) | 2mo | $227,000 | $223 | 59 |
| 505 Howard St | 0.55mi | 3/2.0 | 1,003 (-7%) | 2mo | $254,000 | $253 | 56 |
| 3813 Race St | 0.51mi | 3/2.0 | 1,165 (+8%) | 3mo | $289,500 | $248 | 56 |
| 109 Woodstock St | 0.60mi | 3/1.0 | 960 (-11%) | 3mo | $220,000 | $229 | 51 |
| 2819 Chancellor St | 0.74mi | 3/1.5 | 999 (-8%) | 1mo | $170,000 | $170 | 50 |
| 4103 Scott St | 0.68mi | 3/1.0 | 960 (-11%) | 5mo | $240,000 | $250 | 46 |
| 266 Hansen Ave | 0.66mi | 3/2.0 | 1,240 (+15%) | 0mo | $293,000 | $236 | 40 |
Match score weights: distance 35% · size 25% · config 20% · recency 20%. Top-matched comps best support the ARV.
Projected returns pro-forma
-3.0% appreciation · 3.0% rent growth · sell at horizon
- IRR
- -18.5%
- Equity multiple
- 0.35×
- Total profit
- $-39,943
- Equity at exit
- $32,803
- IRR
- -10.9%
- Equity multiple
- 0.34×
- Total profit
- $-40,394
- Equity at exit
- $19,022
Cash invested: $61,600 (down + closing). Projections, not guarantees.
Landlord ↔ Tenant lean methodology
- Overall (STATE)
- 55 Moderately Landlord-Leaning
- State Virginia
- 55 Moderately Landlord-Leaning · D+2
- County
- — inherits STATE
- City
- — inherits STATE
ZIP-level market 23707
- Home prices YoY
- -23.7%
- Active inventory
- 86
- Price-to-rent
- 10.6×
Monthly cashflow live
- Estimated rent
- $1,724 high interval (Pro) →
- Mortgage (P&I)
- −$1,154
- Tax from tax record
- −$184 /mo · $2,205/yr
- Insurance
- −$92
- HOA
- −$0
- Vacancy / Maint / Mgmt
- −$362
- Net cashflow
- $-67
Break-even live
Sensitivity live
| Price | -10% $58 | -5% $-5 | +0% $-67 | +5% $-129 | +10% $-191 |
|---|---|---|---|---|---|
| Rent | -10% $-203 | -5% $-135 | +0% $-67 | +5% $1 | +10% $69 |
| Rate | -1.0pp $44 | -0.5pp $-11 | base $-67 | +0.5pp $-124 | +1.0pp $-182 |
UW: 25.0% down · 7.5% · 30yr · 1.5% tax · 5.0% vac · 8.0% maint · 8.0% mgmt
Financing live
Cash to close
- Down payment
- $55,000
- Closing costs
- $6,600
- Reserves months
- —
- Total cash needed
- —
Loan-product check · same deal, 3 products live
Conventional
25% down · 7.5% · 30yr
- Down + closing
- —
- Monthly P&I
- —
- Monthly cashflow
- —
- DSCR
- —
- Eligible?
- —
Personal DTI + credit; lowest rate.
DSCR
20% down · 8.5% · 30yr
- Down + closing
- —
- Monthly P&I
- —
- Monthly cashflow
- —
- DSCR
- —
- Eligible?
- —
No personal income docs; deal must DSCR.
Hard money
10% down · 12.0% · 12mo
- Down + closing
- —
- Monthly P&I
- —
- Monthly cashflow
- —
- DSCR
- —
- Eligible?
- —
Short-term bridge; refi at stabilization.
Rent comps 35 comps
| Address | Beds | Baths | Sqft | Rent | $/sqft | DOM | Units | Dist |
|---|---|---|---|---|---|---|---|---|
| 3401 Brighton St Portsmouth, VA | 3.0 | 2.5 | 1439 | $2,195 | $1.53 | 5d | 1 | 0.15mi |
| 3717 Scott St Portsmouth, VA | 3.0 | 1.0 | 1157 | $1,400 | $1.21 | 25d | 1 | 0.42mi |
| 3607 Bart St Portsmouth, VA | 3.0 | 2.0 | 1326 | $1,850 | $1.40 | 12d | 1 | 0.50mi |
| 1 Shelby St Portsmouth, VA | 2.0 | 1.0 | 700 | $1,250 | $1.79 | 25d | 1 | 0.51mi |
| 3626 Bart St Unit BAR3626-DF Portsmouth, VA | 2.0 | 1.0 | 900 | $1,000 | $1.11 | 9d | 1 | 0.53mi |
| 49 Carver Cir Portsmouth, VA | 2.0 | 2.0 | 800 | $1,450 | $1.81 | 25d | 1 | 0.55mi |
| 3304 Killian Ave Portsmouth, VA | 3.0 | 1.0 | 800 | $2,000 | $2.50 | 25d | 1 | 0.57mi |
| 3317 Downes St Portsmouth, VA | 3.0 | 2.0 | 1148 | $1,995 | $1.74 | 5d | 1 | 0.65mi |
| 3317 Downes St Portsmouth, VA | 3.0 | 2.0 | 1148 | $1,995 | $1.74 | 12d | 1 | 0.65mi |
| 2715 Portsmouth Blvd Portsmouth, VA | 2.0 | 1.0 | 1428 | $1,425 | $1.00 | 19d | 1 | 0.74mi |
| 2715 Portsmouth Blvd Portsmouth, VA | 2.0 | 1.0 | 1428 | $1,425 | $1.00 | 16d | 1 | 0.74mi |
| 70 Manly St Portsmouth, VA | 2.0 | 1.0 | 1000 | $1,350 | $1.35 | 45d | 1 | 0.80mi |
| 3310 Glasgow St Portsmouth, VA | 2.0 | 1.0 | 1100 | $1,600 | $1.45 | 5d | 1 | 0.84mi |
| 213 Beacon Rd Portsmouth, VA | 3.0 | 2.0 | 1280 | $2,300 | $1.80 | 25d | 1 | 0.94mi |
| 2304 Nashville Ave Portsmouth, VA | 3.0 | 1.5 | 1226 | $1,395 | $1.14 | 45d | 1 | 1.01mi |
| 251 Independence St Portsmouth, VA | 3.0 | 2.5 | 1294 | $2,550 | $1.97 | 25d | 1 | 1.14mi |
| 821 Mt Vernon Ave Unit A Portsmouth, VA | 2.0 | 1.0 | 1200 | $1,250 | $1.04 | 5d | 1 | 1.18mi |
| 2810 Roanoke Ave Portsmouth, VA | 3.0 | 1.5 | 1100 | $2,100 | $1.91 | 45d | 1 | 1.19mi |
| 3724 Deep Creek Blvd Unit 3754 Portsmouth, VA | 2.0 | 1.0 | 900 | $995 | $1.11 | 14d | 1 | 1.22mi |
| 3724 Deep Creek Blvd Unit 3728 Portsmouth, VA | 2.0 | 1.0 | 900 | $995 | $1.11 | 25d | 1 | 1.22mi |
| 21 DeKalb Ave Portsmouth, VA | 2.0 | 1.0 | 984 | $1,550 | $1.58 | 45d | 1 | 1.22mi |
| 1914 King St Portsmouth, VA | 3.0 | 2.5 | 1332 | $2,200 | $1.65 | 46d | 1 | 1.25mi |
| 13 Hedge Ln Unit I Portsmouth, VA | 2.0 | 1.5 | 816 | $1,275 | $1.56 | 9d | 1 | 1.25mi |
| 231 Edison Ave Portsmouth, VA | 2.0 | 1.5 | 1100 | $1,275 | $1.16 | 21d | 1 | 1.27mi |
| 231 Edison Ave Unit 231 Portsmouth, VA | 2.0 | 1.5 | 1050 | $1,275 | $1.21 | 12d | 1 | 1.27mi |
| 2750 Greenwood Dr Portsmouth, VA | 3.0 | 2.0 | 1200 | $1,700 | $1.42 | 25d | 1 | 1.27mi |
| 2211 North St Portsmouth, VA | 4.0 | 1.5 | 1500 | $2,100 | $1.40 | 18d | 1 | 1.29mi |
| 1915 Des Moines Ave Portsmouth, VA | 3.0 | 1.0 | 1070 | $1,700 | $1.59 | 18d | 1 | 1.30mi |
| 1915 Des Moines Ave Portsmouth, VA | 3.0 | 1.0 | 1070 | $1,700 | $1.59 | 25d | 1 | 1.30mi |
| 1915 Lansing Ave Portsmouth, VA | 3.0 | 1.0 | 1085 | $1,675 | $1.54 | 5d | 1 | 1.35mi |
| 124 Tyler Cres E Unit B Portsmouth, VA | 2.0 | 1.0 | 1000 | $1,195 | $1.20 | 25d | 1 | 1.37mi |
| 647 Mount Vernon Ave Unit B Portsmouth, VA | 2.0 | 1.0 | 900 | $1,650 | $1.83 | 9d | 1 | 1.38mi |
| 1416 Richmond Ave Portsmouth, VA | 2.0 | 1.0 | 1024 | $1,150 | $1.12 | 45d | 1 | 1.44mi |
| 35 Fairview Cir S Portsmouth, VA | 4.0 | 1.5 | 1462 | $2,100 | $1.44 | 14d | 1 | 1.46mi |
| 1447 Talley Cir Portsmouth, VA | 3.0 | 2.5 | 1440 | $2,000 | $1.39 | 25d | 1 | 1.49mi |
Listing history 15 events
-
2026-06-21days on market $220,000 Active 52 DOM
-
2026-06-18days on market $220,000 Active 49 DOM
-
2026-06-17days on market $220,000 Active 48 DOM
-
2026-06-16days on market $220,000 Active 47 DOM
-
2026-06-15days on market $220,000 Active 46 DOM
-
2026-06-13days on market $220,000 Active 44 DOM
-
2026-06-09days on market $220,000 Active 40 DOM
-
2026-06-08days on market $220,000 Active 39 DOM
-
2026-06-07days on market $220,000 Active 38 DOM
-
2026-06-03days on market $220,000 Active 34 DOM
-
2026-06-02days on market $220,000 Active 33 DOM
-
2026-06-01days on market $220,000 Active 32 DOM
-
2026-05-31days on market $220,000 Active 31 DOM
-
2026-04-30$220,000 Active 292-char remark
-
2001-05-18soldstatus $62,100
ⓘ Source: listings_history table (triggers on properties + properties_extension) + one-shot
backfill from property_details.listing_events for pre-trigger history.
Tax reassessment forecast VA · Resets to sale price
- Current annual tax
- $2,205 · $184/mo
- Projected year-2 tax
- $2,205 · $184/mo
- Expected delta
- $0/yr ($0/mo · 0.0%)
ⓘ Screening estimate from a state-policy table — verify with the county assessor before closing.
Climate risk First Street
- Flood 4/10 Moderate FEMA zone X (unshaded) · 13% chance over 30 yrs
- Wildfire 1/10 Low
- Heat 9/10 Extreme 7 d/yr ≥106°F today · 16 d/yr by 30 yrs out
- Wind 8/10 Severe 80% chance of damaging wind over 30 yrs
- Air quality 5/10 Major 6 unhealthy d/yr today · 7 by 30 yrs out
Nearby sold comps map
Loading sold comps map…
Walkable amenities ~0.75 mi
Loading nearby amenities…
Taxation est. · year 1
- Rental income
- $20,691
- − Mortgage interest
- −$12,323
- − Property taxes
- −$2,205
- − Insurance
- −$1,100
- − Repairs & maintenance
- −$1,655
- − Management
- −$1,655
- − Depreciation
- −$6,400
- Taxable loss
- −$4,648
- Est. tax savings @ 24.0%
- +$1,115
- After-tax cash flow
- $312/yr
For passive investors: Depreciation is non-cash, so a rental often shows a tax loss while cash-flowing — sheltering income. Rental losses are passive: they offset passive income freely, and up to $25,000/yr can offset ordinary (W-2) income if you actively participate and your MAGI is under $100k (phasing out to $0 by $150k); unused losses carry forward. On sale, claimed depreciation is recaptured at up to 25%, and gains may owe capital-gains tax (a 1031 exchange can defer both). Figures are a year-1 estimate at your 24.0% rate — not tax advice; consult a CPA.
Schools (NCES district)
- District
- Portsmouth City Public School District
- NCES district ID
- 5103000
- Math proficiency
- 34% ▼ -40.00%
- Reading proficiency
- 58% ▼ -12.00%
- Median HH income
- $46,152
- Composite
- 39.01/100
- National rank
- #4071
- State rank
- #107 of 131 in VA
Livability — Portsmouth
- Score
- 73/100
- State rank
- #172
- US rank
- #5381
Category grades
Schools grade is shown separately in the Schools card above.
Census & demographics
- Census place
- Portsmouth, VA
- County
- Portsmouth City · 96,366 people
- City population
- 96,366
- Metro
- Virginia Beach-Norfolk-Newport News, VA-NC
- Population (ZIP)
- 14,766
- Household income
- $48,926
- Rent vs Own
- Severe rent burden
- 963.0
Population outlook (Portsmouth County) Hauer SSP2
- Today (2025)
- 96,730 people
- By 2030
- 96,760 · +0.0%
- By 2040
- 96,573 · -0.2%
- By 2050
- 95,606 · -1.2%
- By 2075
- 93,579 · -3.3%
- By 2100
- 83,756 · -13.4%
Race, ethnicity, and origin ACS 2023
- Neighborhood character
- Diverse neighborhood (Simpson 0.64)
- Race & ethnicity
- White 43% Black 41% Two or more races 9% Hispanic / Latino 3% Asian 3%
- Common ancestry
- Slovak 2% Italian 1% Serbian 1%
- Foreign-born
- 5% · Canada, China
- Languages at home
- 94% English-only · Spanish 2% Tagalog/Filipino 1% Chinese 1%
Political lean MEDSL · Portsmouth
- 2024 margin
- Solid D (+38.6) · D 68.6% · R 30.0% · Other 1.4%
- 2008→2024 swing
- -0.7pp no change · 2008: 39.3pp · 2024: 38.6pp
- All cycles
- 2024: D+38.6 2020: D+40.8 2016: D+36.5 2012: D+39.6 2008: D+39.3
Not yet ingested
- Civics
- —
Market trends
- HPI YoY
- ▼ -93.03%
- Current HPI
- 299.832
- Rent YoY
- —
- Metro
- Virginia Beach-Norfolk-Newport News, VA-NC
- State GDP YoY
- ▲ 2.40%
- F500 in state
- 50
Industry mix (Fortune 500 HQ in VA)
| Industry | F500 HQs | Revenue |
|---|---|---|
| Aerospace / Defense | 4 | $236B |
|
||
| Technology / Defense | 3 | $32B |
|
||
| Financial Services | 2 | $176B |
|
||
| Utilities | 2 | $27B |
|
||
| Insurance | 2 | $25B |
|
||
| Technology | 2 | $15B |
|
||
Price history
+254.3% since first listed2 events — show timeline
- 2026-04-30 Listed $220,000 REINMLS
- 2001-05-18 Sold (Public Records) $62,100 Public Records
Property tax history
+3.4%/yrLatest (2025): $2,205 · +2.1% YoY. Source: county tax records.
Cash-flow waterfall
monthlySold comps — $/sqft
last 12 mo · ≤1 miLoading sold comps…