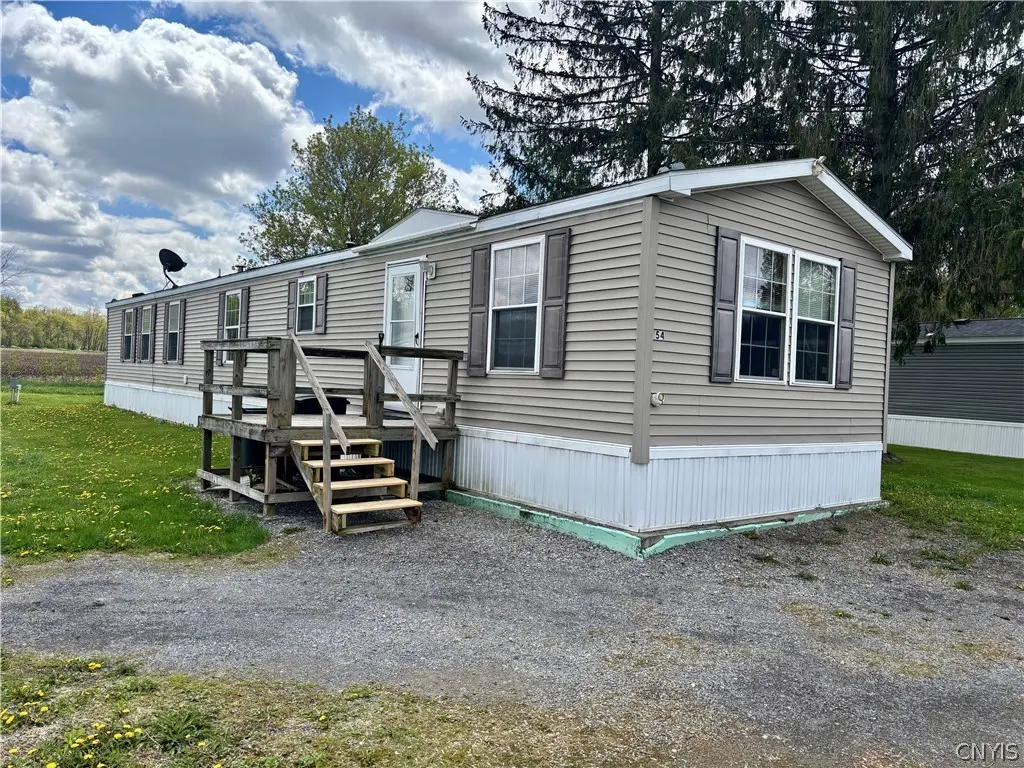
54 Fairport Rd · Cazenovia, NY
Flood risk No data
- FEMA flood zone
- —
- Chance of flooding over 30 yrs
- —
- Est. flood insurance / yr
- —
Fire risk No data
- Est. fire insurance / yr
- —
Heat risk No data
- Hot days now (above threshold)
- —
- Hot days in 30 yrs
- —
Wind risk No data
- Chance of severe wind over 30 yrs
- —
Air-quality risk No data
- Unhealthy air days now
- —
- Unhealthy air days in 30 yrs
- —
Risk factors via First Street. Map © Google.
Why this score? — see what drove the B+ grade
The composite is a weighted blend of 9 inputs, each scored 0–100. Each bar is that input's sub-score; the figure is the points it added to the 100-point composite (weight × sub-score).
- Cash flow +30.0/30.0
- 1% rule +10.0/10.0
- DSCR +10.0/10.0
- ARV discount +7.5/15.0
- Appreciation +5.0/10.0
- Schools +4.6/10.0
- Livability +3.9/5.0
- Rent growth +2.5/5.0
- Condition / age +2.2/5.0
$59,500
🖨 Deal sheet (PDF) 📄 Offer letter ✓ Due diligence
Listing remarks
An affordable well-maintained 3 bedroom, 2 full bath single wide mobile home offering 1280 sq. ft. of comfortable living space currently in a convenient park setting. This home features an open living room and kitchen combination, creating an inviting layout perfect for everyday living and entertaining. The primary bedroom includes a private full bath, while two additional bedrooms provide flexibility for guests, office space, or hobbies. A dedicated laundry area adds convenience, and the home is on a good sized lot with room to enjoy outdoor activities. Affordable, functional, move-in ready and located in the Fabius-Pompey School District.
Key facts
- Good sized lot
- Private full bath
- Built 2007
Tags
Property features AI
Finance
- HOA & community: Land lease amount: $400
Exterior
- Parking: No garage
- Utilities: Public water connected; Sewer connected
- Home design: Single-story; Single-wide mobile home (Skyline); Resale property; Rectangular lot (approximately 50 x 160)
- Construction: Vinyl siding
- Exterior features: Gravel driveway; Shed(s) and storage
Interior
- Kitchen: Electric cooktop; Electric oven; Electric range; Dishwasher; Refrigerator
- Bedrooms: Three main-level bedrooms
- Flooring: Carpet; Vinyl; Varied flooring
- Bathrooms: Two full bathrooms (both on the main level)
- Heating & cooling: Forced air heating; Wall furnace; Has heating
- Interior features: Kitchen and family room combined; Main-level primary bedroom
- Laundry & utility: Main-level laundry; Washer; Dryer; Electric water heater
Neighborhood map
What this means for you Summary
Snapshot
- This is a 3-bed/2.0-bath manufactured listed at $60k. Condition is rated fair.
Deal economics
- At list price, monthly cash flow is $635 ($8k/yr) — positive.
- The deal already cash-flows at list — no discount required.
- Meets the 1% rule at list price ($1k rent vs $60k).
- Recommended offer: $58k (3.0% below list) — sets the bar for market timing.
- Cap rate 19.1% vs local median 1.3% in Cazenovia — top-decile yield for the area; either an underpriced asset or a hidden risk that comps aren't pricing in. Stress-test before assuming the spread holds.
Location & tenants
- Location reads 78/100 on livability (#154 in NY, #2,396 nationally) — a middle-class / working-renter tenant base. Strengths: health & safety A+, schools A, crime A; Watch: commute F.
- Fabius-Pompey Central School District (rural): math 48% / reading 55% proficiency, ranked #322 of 590 in NY (top 55%) — acceptable for families but not a draw, mixed tenant base, ~2y average lease.
- Market conditions: 2 active listings in the ZIP; 616 units permitted in Onondaga County in 2024 (256 in 5+ unit buildings).
Forward outlook
- In year one you build about $2k of equity ($411 loan paydown + $2k appreciation (3.0% local appreciation)).
- Onondaga County population projected to shrink 9% by 2050 — rents likely to lag national; underwrite the cash flow, not the appreciation.
- At projected returns (3.0% appreciation + 3.0% rent growth), your $17k cash investment doubles in ~2 years — after that, you're playing with house money.
Negotiation context
- It's been on market 43 days — a 3% lower offer ($58k) is reasonable based on typical stale-listing flexibility.
Questions for the listing agent
- It's been on market 43 days. Have you received any prior offers? Is the seller open to a 3% concession, seller financing, or rate buy-down credit?
- Have any recent inspections been done? Can we get a copy of the seller's disclosures and any deferred-maintenance estimates?
- Is there a deadline driving the sale (1031 exchange, divorce, estate, relocation)? That informs how much negotiation room exists.
- Schools are A-rated — typically a magnet for longer-tenancy family renters. What's the average tenant stay here, and is there a school-zone premium baked into asking?
- What's the average days-on-market for RENTAL listings here right now (not sales)? A rising rental-DOM trend means longer vacancies and softer asking-rent achievability than the comps imply.
- What's the recent tenant-quality profile in this submarket — average credit score on applications, eviction rate, late-payment / NSF rate, and stable-employment percentage? A property-management company in the area should have these aggregated.
- How much new for-sale + rental construction is in the pipeline within 1–3 miles? Heavy new supply typically softens prices + rents 12–24 months out; constrained supply supports both.
Investment metrics
- 1% rule
- 2.23% ✓
- Cap rate
- 19.10%
- Cash-on-cash
- 45.75%
- DSCR
- 3.04
- GRM
- 3.7
CMA / ARV
No comps found within radius.
Projected returns pro-forma
3.0% appreciation · 3.0% rent growth · sell at horizon
- IRR
- 51.0%
- Equity multiple
- 3.86×
- Total profit
- $47,640
- Equity at exit
- $26,754
- IRR
- 50.7%
- Equity multiple
- 7.78×
- Total profit
- $112,937
- Equity at exit
- $41,231
Cash invested: $16,660 (down + closing). Projections, not guarantees.
Landlord ↔ Tenant lean methodology
- Overall (STATE)
- 15 Strongly Tenant-Friendly
- State New York
- 15 Strongly Tenant-Friendly · D+10
- County
- — inherits STATE
- City
- — inherits STATE
ZIP-level market 13051
- Active inventory
- 2
- Price-to-rent
- 3.7×
Monthly cashflow live
- Estimated rent
- $1,324 medium interval (Pro) →
- Mortgage (P&I)
- −$312
- Tax est. 1.5%
- −$74 /mo · $892/yr
- Insurance
- −$25
- HOA
- −$0
- Vacancy / Maint / Mgmt
- −$278
- Net cashflow
- $635
Break-even live
Sensitivity live
| Price | -10% $676 | -5% $656 | +0% $635 | +5% $615 | +10% $594 |
|---|---|---|---|---|---|
| Rent | -10% $530 | -5% $583 | +0% $635 | +5% $687 | +10% $740 |
| Rate | -1.0pp $665 | -0.5pp $650 | base $635 | +0.5pp $620 | +1.0pp $604 |
UW: 25.0% down · 7.5% · 30yr · 1.5% tax · 5.0% vac · 8.0% maint · 8.0% mgmt
Financing live
Cash to close
- Down payment
- $14,875
- Closing costs
- $1,785
- Reserves months
- —
- Total cash needed
- —
Loan-product check · same deal, 3 products live
Conventional
25% down · 7.5% · 30yr
- Down + closing
- —
- Monthly P&I
- —
- Monthly cashflow
- —
- DSCR
- —
- Eligible?
- —
Personal DTI + credit; lowest rate.
DSCR
20% down · 8.5% · 30yr
- Down + closing
- —
- Monthly P&I
- —
- Monthly cashflow
- —
- DSCR
- —
- Eligible?
- —
No personal income docs; deal must DSCR.
Hard money
10% down · 12.0% · 12mo
- Down + closing
- —
- Monthly P&I
- —
- Monthly cashflow
- —
- DSCR
- —
- Eligible?
- —
Short-term bridge; refi at stabilization.
Listing history 16 events
-
2026-06-21days on market $59,500 Active 43 DOM
-
2026-06-18days on market $59,500 Active 41 DOM
-
2026-06-17days on market $59,500 Active 40 DOM
-
2026-06-16days on market $59,500 Active 39 DOM
-
2026-06-15days on market $59,500 Active 38 DOM
-
2026-06-13days on market $59,500 Active 36 DOM
-
2026-06-12days on market $59,500 Active 35 DOM
-
2026-06-09days on market $59,500 Active 32 DOM
-
2026-06-08days on market $59,500 Active 31 DOM
-
2026-06-07days on market $59,500 Active 30 DOM
-
2026-06-07days on market $59,500 Active 29 DOM
-
2026-06-04days on market $59,500 Active 26 DOM
-
2026-06-02days on market $59,500 Active 25 DOM
-
2026-06-01days on market $59,500 Active 24 DOM
-
2026-05-31days on market $59,500 Active 23 DOM
-
2026-05-08$69,900 Active 648-char remark
ⓘ Source: listings_history table (triggers on properties + properties_extension) + one-shot
backfill from property_details.listing_events for pre-trigger history.
Nearby sold comps map
Loading sold comps map…
Walkable amenities ~0.75 mi
Loading nearby amenities…
Taxation est. · year 1
- Rental income
- $15,894
- − Mortgage interest
- −$3,333
- − Property taxes
- −$892
- − Insurance
- −$298
- − Repairs & maintenance
- −$1,271
- − Management
- −$1,271
- − Depreciation
- −$1,731
- Taxable income
- $7,097
- Est. tax owed @ 24.0%
- −$1,703
- After-tax cash flow
- $5,918/yr
For passive investors: Depreciation is non-cash, so a rental often shows a tax loss while cash-flowing — sheltering income. Rental losses are passive: they offset passive income freely, and up to $25,000/yr can offset ordinary (W-2) income if you actively participate and your MAGI is under $100k (phasing out to $0 by $150k); unused losses carry forward. On sale, claimed depreciation is recaptured at up to 25%, and gains may owe capital-gains tax (a 1031 exchange can defer both). Figures are a year-1 estimate at your 24.0% rate — not tax advice; consult a CPA.
Condition & rehab AI · 2 photos
This mobile home requires significant repairs and maintenance, including major work on the siding, foundation, and roof. Fresh paint and structural repairs can greatly improve its value and appeal.
Repairs flagged
- Major siding — Significant wear and tear
- Major foundation — Uneven ground and visible wear
- Major roof — Aged appearance
Value-add opportunities
- Both paint exterior — Fresh paint can improve curb appeal and home value
- Both repair foundation — Stabilizing the foundation can prevent further structural issues
- Both replace roof — A new roof will significantly increase the home's value and lifespan
Renovation cost estimate screening
| Repair item | Severity | Est. cost |
|---|---|---|
| siding · Significant wear and tear | Major | $15,000–50,000 |
| foundation · Uneven ground and visible wear | Major | $15,000–50,000 |
| roof · Aged appearance | Major | $15,000–50,000 |
| Total estimated repair cost · 3 items | $45,000–150,000 |
Value-add ROI direction
- Both paint exterior — Fresh paint can improve curb appeal and home value ↑
- Both repair foundation — Stabilizing the foundation can prevent further structural issues ↑
- Both replace roof — A new roof will significantly increase the home's value and lifespan ↑
ⓘ Cost ranges are severity-bucket heuristics (US national rule-of-thumb). Get contractor quotes + a written scope before underwriting a rehab budget.
Schools (NCES district)
- District
- Fabius-Pompey Central School District
- NCES district ID
- 3610860
- Math proficiency
- 48% ▼ -9.00%
- Reading proficiency
- 55% ▲ 5.00%
- Median HH income
- $72,564
- Composite
- 46.16/100
- National rank
- #2499
- State rank
- #322 of 590 in NY
Livability — Cazenovia
- Score
- 78/100
- State rank
- #154
- US rank
- #2396
Category grades
Schools grade is shown separately in the Schools card above.
Census & demographics
- Population (ZIP)
- 52
Population outlook (Onondaga County) Hauer SSP2
- Today (2025)
- 467,894 people
- By 2030
- 463,381 · -1.0%
- By 2040
- 447,697 · -4.3%
- By 2050
- 426,399 · -8.9%
- By 2075
- 373,661 · -20.1%
- By 2100
- 307,967 · -34.2%
Race, ethnicity, and origin ACS 2023
- Neighborhood character
- Predominantly White (77%)
- Race & ethnicity
- White 77% Two or more races 23%
- Common ancestry
- Slovak 77% Lithuanian 21%
Political lean MEDSL · Onondaga
- 2024 margin
- D (+17.3) · D 58.6% · R 41.4%
- 2008→2024 swing
- -3.0pp toward R · 2008: 20.3pp · 2024: 17.3pp
- All cycles
- 2024: D+17.3 2020: D+20.6 2016: D+12.8 2012: D+21.1 2008: D+20.3
Not yet ingested
- Civics
- —
Market trends
- HPI YoY
- —
- Current HPI
- —
- Rent YoY
- —
- Metro
- —
- State GDP YoY
- ▲ 2.60%
- F500 in state
- 92
Industry mix (Fortune 500 HQ in NY)
| Industry | F500 HQs | Revenue |
|---|---|---|
| Financial Services | 10 | $950B |
|
||
| Consumer Goods | 9 | $162B |
|
||
| Insurance | 4 | $225B |
|
||
| Telecommunications | 2 | $144B |
|
||
| Pharmaceuticals | 2 | $112B |
|
||
| Media / Entertainment | 2 | $69B |
|
||
Price history
-14.9% since first listed2 events — show timeline
- 2026-05-26 Price Changed $59,500 CNYIS
- 2026-05-08 Listed $69,900 CNYIS
Cash-flow waterfall
monthlySold comps — $/sqft
last 12 mo · ≤1 miLoading sold comps…