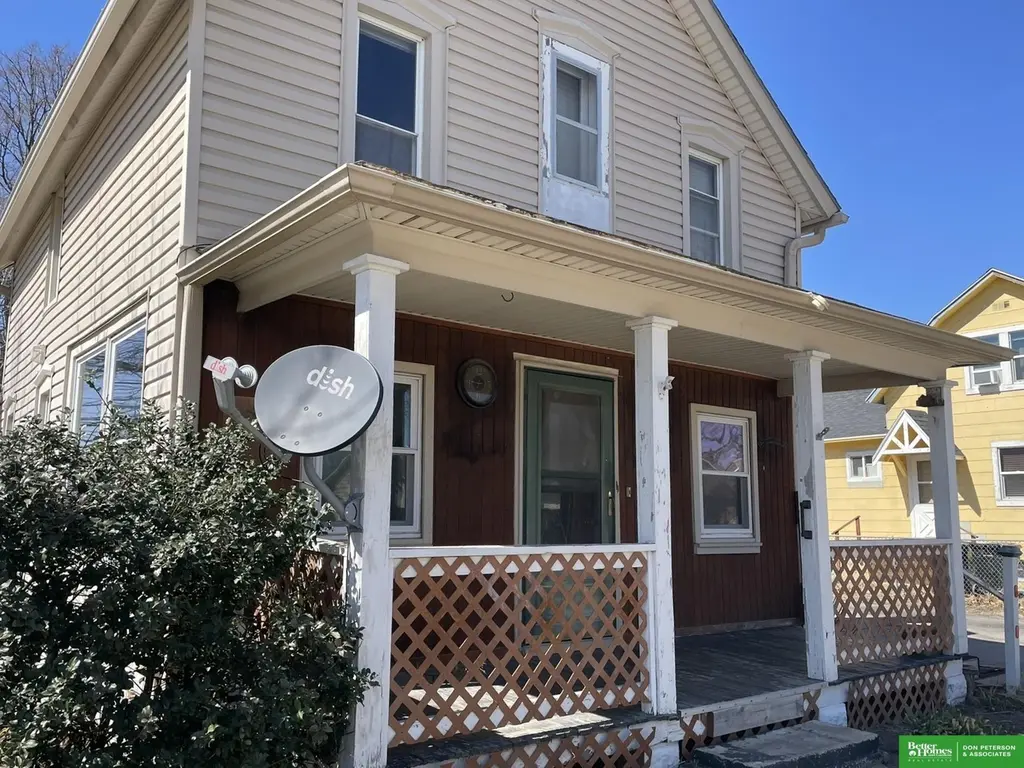
805 N Hancock St · Fremont, NE
Flood risk 1/10 · Minimal
- FEMA flood zone
- X (shaded)
- Chance of flooding over 30 yrs
- 0.0%
- Est. flood insurance / yr
- $473 – $860
Fire risk 1/10 · Minimal
- Est. fire insurance / yr
- $1,161 – $2,155
Heat risk 3/10 · Minor
- Hot days now (above 103°F)
- 7 days/yr
- Hot days in 30 yrs
- 16 days/yr
Wind risk 2/10 · Minimal
- Chance of severe wind over 30 yrs
- —
Air-quality risk 1/10 · Minimal
- Unhealthy air days now
- 0 days/yr
- Unhealthy air days in 30 yrs
- 0 days/yr
Risk factors via First Street. Map © Google.
Why this score? — see what drove the B grade
The composite is a weighted blend of 9 inputs, each scored 0–100. Each bar is that input's sub-score; the figure is the points it added to the 100-point composite (weight × sub-score).
- Cash flow +29.6/30.0
- ARV discount +15.0/15.0
- DSCR +10.0/10.0
- 1% rule +7.8/10.0
- Livability +3.8/5.0
- Schools +3.0/10.0
- Condition / age +2.5/5.0
- Rent growth +2.0/5.0
- Appreciation +0.0/10.0
$125,000
🖨 Deal sheet (PDF) 📄 Offer letter ✓ Due diligence
Listing remarks MLS
Opportunity awaits! This 3-bed, 1-bath two-story home offers great potential and could by your next rental or flip project. Situated on a corner lot with a fenced in yard and alley access, it includes a covered deck, main floor laundry, and a good-sized kitchen. The 2-car garage features insulated doors, and the home has durable permanent siding. Property being Sold As-Is. Call today!
Key facts
- 8,520 sq ft lot
- 2 garage spots
- Built 1925
Neighborhood map
What this means for you Summary
Snapshot
- This is a 4-bed/1.0-bath single-family listed at $125k.
Deal economics
- At list price, monthly cash flow is $451 ($5k/yr) — positive.
- The deal already cash-flows at list — no discount required.
- Meets the 1% rule at list price ($2k rent vs $125k).
- Recommended offer: $121k (3.0% below list) — sets the bar for market timing.
- Cap rate 10.6% vs local median 3.3% in Fremont — top-decile yield for the area; either an underpriced asset or a hidden risk that comps aren't pricing in. Stress-test before assuming the spread holds.
Location & tenants
- Location reads 76/100 on livability (#92 in NE, #3,751 nationally) — a middle-class / working-renter tenant base. Strengths: cost of living A+, housing A+, health & safety A+; Watch: schools C-, employment D+, commute F.
- Fremont Public Schools (town): math 34% / reading 36% proficiency, ranked #103 of 111 in NE (top 93%) — families likely to look elsewhere, expect single-tenant / working-renter base with shorter leases.
- Market conditions: Rents soft (-2.1%/yr); 244 active listings in the ZIP; 1 comparable units currently listed for rent nearby; 82 units permitted in Dodge County in 2024 (0 in 5+ unit buildings).
Forward outlook
- Local home prices are declining (-3.0%/yr); year-one equity from $864 of loan paydown is wiped out by about $4k of value loss. Plan a longer hold.
Negotiation context
- It's been on market 46 days — a 3% lower offer ($121k) is reasonable based on typical stale-listing flexibility.
Risks & watch-outs
- Watch-outs: built in 1925 — expect roof / HVAC / electrical / plumbing capex.
Questions for the listing agent
- It's been on market 46 days. Have you received any prior offers? Is the seller open to a 3% concession, seller financing, or rate buy-down credit?
- Built in 1925 — when were the roof, HVAC, electrical panel, plumbing, and water heater last replaced?
- Is there a deadline driving the sale (1031 exchange, divorce, estate, relocation)? That informs how much negotiation room exists.
- What's the average days-on-market for RENTAL listings here right now (not sales)? A rising rental-DOM trend means longer vacancies and softer asking-rent achievability than the comps imply.
- What's the recent tenant-quality profile in this submarket — average credit score on applications, eviction rate, late-payment / NSF rate, and stable-employment percentage? A property-management company in the area should have these aggregated.
- How much new for-sale + rental construction is in the pipeline within 1–3 miles? Heavy new supply typically softens prices + rents 12–24 months out; constrained supply supports both.
Investment metrics
- 1% rule
- 1.28% ✓
- Cap rate
- 10.62%
- Cash-on-cash
- 15.47%
- DSCR
- 1.69
- GRM
- 6.5
CMA / ARV
- ARV (median comp)
- $192,012
- List price
- $125,000
- Delta
- -34.90%
- Verdict
- UNDERPRICED
- Comps
- 20 within 1.0 mi
Show comp detail 12 sales within ~0.75 mi
| Address | Dist | Beds/Ba | Sqft | Sold | Price | $/sf | Match |
|---|---|---|---|---|---|---|---|
| 805 N Hancock St | 0.00mi | 3/1.0 (-1) | 1,212 (0%) | 1mo | $115,000 | $95 | 94 |
| 315 N Grant St | 0.33mi | 4/2.0 | 1,182 (-2%) | 1mo | $225,000 | $190 | 76 |
| 1208 - 1210 E 9th St | 0.08mi | 4/1.0 | 1,356 (+12%) | 3mo | $175,000 | $129 | 74 |
| 1115 N Logan St | 0.37mi | 4/2.0 | 1,255 (+4%) | 3mo | $198,000 | $158 | 71 |
| 535 N Pebble St | 0.28mi | 3/2.0 (-1) | 1,248 (+3%) | 3mo | $162,319 | $130 | 70 |
| 1024 E 8th St | 0.17mi | 3/1.0 (-1) | 1,054 (-13%) | 5mo | $219,000 | $208 | 61 |
| 141 N Lincoln St | 0.45mi | 3/1.0 (-1) | 1,332 (+10%) | 3mo | $197,500 | $148 | 55 |
| 1512 E 2nd St | 0.39mi | 3/2.5 (-1) | 1,120 (-8%) | 6mo | $240,000 | $214 | 53 |
| 406 E 14th St | 0.73mi | 3/1.0 (-1) | 1,114 (-8%) | 2mo | $168,000 | $151 | 45 |
| 200 S Thomas St | 0.60mi | 3/1.0 (-1) | 1,064 (-12%) | 2mo | $162,000 | $152 | 45 |
| 850 N D St | 0.70mi | 3/2.0 (-1) | 1,334 (+10%) | 3mo | $196,000 | $147 | 40 |
| 419 E Tenth St | 0.62mi | 3/2.0 (-1) | 1,350 (+11%) | 4mo | $215,000 | $159 | 40 |
Match score weights: distance 35% · size 25% · config 20% · recency 20%. Top-matched comps best support the ARV.
Projected returns pro-forma
-3.0% appreciation · 0.0% rent growth · sell at horizon
- IRR
- 2.9%
- Equity multiple
- 1.11×
- Total profit
- $3,780
- Equity at exit
- $18,638
- IRR
- 9.5%
- Equity multiple
- 1.63×
- Total profit
- $22,145
- Equity at exit
- $10,808
Cash invested: $35,000 (down + closing). Projections, not guarantees.
Landlord ↔ Tenant lean methodology
- Overall (STATE)
- 83 Strongly Landlord-Friendly
- State Nebraska
- 83 Strongly Landlord-Friendly · R+13
- County
- — inherits STATE
- City
- — inherits STATE
ZIP-level market 68025
- Home prices YoY
- -34.1%
- Rents YoY
- -2.1%
- Active inventory
- 244
- Price-to-rent
- 6.5×
Monthly cashflow live
- Estimated rent
- $1,599 medium interval (Pro) →
- Mortgage (P&I)
- −$656
- Tax from tax record
- −$104 /mo · $1,254/yr
- Insurance
- −$52
- HOA
- −$0
- Vacancy / Maint / Mgmt
- −$336
- Net cashflow
- $451
Break-even live
Sensitivity live
| Price | -10% $522 | -5% $486 | +0% $451 | +5% $416 | +10% $380 |
|---|---|---|---|---|---|
| Rent | -10% $325 | -5% $388 | +0% $451 | +5% $514 | +10% $577 |
| Rate | -1.0pp $514 | -0.5pp $483 | base $451 | +0.5pp $419 | +1.0pp $386 |
UW: 25.0% down · 7.5% · 30yr · 1.5% tax · 5.0% vac · 8.0% maint · 8.0% mgmt
Financing live
Cash to close
- Down payment
- $31,250
- Closing costs
- $3,750
- Reserves months
- —
- Total cash needed
- —
Loan-product check · same deal, 3 products live
Conventional
25% down · 7.5% · 30yr
- Down + closing
- —
- Monthly P&I
- —
- Monthly cashflow
- —
- DSCR
- —
- Eligible?
- —
Personal DTI + credit; lowest rate.
DSCR
20% down · 8.5% · 30yr
- Down + closing
- —
- Monthly P&I
- —
- Monthly cashflow
- —
- DSCR
- —
- Eligible?
- —
No personal income docs; deal must DSCR.
Hard money
10% down · 12.0% · 12mo
- Down + closing
- —
- Monthly P&I
- —
- Monthly cashflow
- —
- DSCR
- —
- Eligible?
- —
Short-term bridge; refi at stabilization.
Rent comps 1 comps
| Address | Beds | Baths | Sqft | Rent | $/sqft | DOM | Units | Dist |
|---|---|---|---|---|---|---|---|---|
| 1021 S Howard St Fremont, NE | 1.0–3.0 | 1.0–2.0 | 1038 | $1,610 | $1.55 | 3d | 11 | 1.15mi |
Listing history 3 events
-
2026-05-12status Pending 387-char remark
Show marketing remark (387 chars)
Opportunity awaits! This 3-bed, 1-bath two-story home offers great potential and could by your next rental or flip project. Situated on a corner lot with a fenced in yard and alley access, it includes a covered deck, main floor laundry, and a good-sized kitchen. The 2-car garage features insulated doors, and the home has durable permanent siding. Property being Sold As-Is. Call today!
-
2026-04-21price $125,000 387-char remark
Show marketing remark (387 chars)
Opportunity awaits! This 3-bed, 1-bath two-story home offers great potential and could by your next rental or flip project. Situated on a corner lot with a fenced in yard and alley access, it includes a covered deck, main floor laundry, and a good-sized kitchen. The 2-car garage features insulated doors, and the home has durable permanent siding. Property being Sold As-Is. Call today!
-
2026-03-25$140,000 New 387-char remark
Show marketing remark (387 chars)
Opportunity awaits! This 3-bed, 1-bath two-story home offers great potential and could by your next rental or flip project. Situated on a corner lot with a fenced in yard and alley access, it includes a covered deck, main floor laundry, and a good-sized kitchen. The 2-car garage features insulated doors, and the home has durable permanent siding. Property being Sold As-Is. Call today!
ⓘ Source: listings_history table (triggers on properties + properties_extension) + one-shot
backfill from property_details.listing_events for pre-trigger history.
Tax reassessment forecast NE · Resets to sale price
- Current annual tax
- $1,254 · $104/mo
- Projected year-2 tax
- $2,162 · $180/mo
- Expected delta
- +$909/yr (+$76/mo · 72.5%)
ⓘ Screening estimate from a state-policy table — verify with the county assessor before closing.
Climate risk First Street
- Flood 1/10 Low FEMA zone X (shaded) · 0% chance over 30 yrs
- Wildfire 1/10 Low
- Heat 3/10 Moderate 7 d/yr ≥103°F today · 16 d/yr by 30 yrs out
- Wind 2/10 Low
- Air quality 1/10 Low 0 unhealthy d/yr today · 0 by 30 yrs out
Nearby sold comps map
Loading sold comps map…
Walkable amenities ~0.75 mi
Loading nearby amenities…
Taxation est. · year 1
- Rental income
- $19,187
- − Mortgage interest
- −$7,002
- − Property taxes
- −$1,254
- − Insurance
- −$625
- − Repairs & maintenance
- −$1,535
- − Management
- −$1,535
- − Depreciation
- −$3,636
- Taxable income
- $3,600
- Est. tax owed @ 24.0%
- −$864
- After-tax cash flow
- $4,549/yr
For passive investors: Depreciation is non-cash, so a rental often shows a tax loss while cash-flowing — sheltering income. Rental losses are passive: they offset passive income freely, and up to $25,000/yr can offset ordinary (W-2) income if you actively participate and your MAGI is under $100k (phasing out to $0 by $150k); unused losses carry forward. On sale, claimed depreciation is recaptured at up to 25%, and gains may owe capital-gains tax (a 1031 exchange can defer both). Figures are a year-1 estimate at your 24.0% rate — not tax advice; consult a CPA.
Schools (NCES district)
- District
- Fremont Public Schools
- NCES district ID
- 3170710
- Math proficiency
- 34% ▼ -8.00%
- Reading proficiency
- 36% ▲ 1.00%
- Median HH income
- $47,111
- Composite
- 30.07/100
- National rank
- #6347
- State rank
- #103 of 111 in NE
Livability — Fremont
- Score
- 76/100
- State rank
- #92
- US rank
- #3751
Category grades
Schools grade is shown separately in the Schools card above.
Census & demographics
- Census place
- Fremont, NE
- County
- Dodge County · 31,658 people
- City population
- 31,658
- Metro
- Fremont, NE
- Population (ZIP)
- 31,658
- Household income
- $72,254
- Rent vs Own
- Severe rent burden
- 893.0
Population outlook (Dodge County) Hauer SSP2
- Today (2025)
- 37,191 people
- By 2030
- 37,238 · +0.1%
- By 2040
- 37,256 · +0.2%
- By 2050
- 37,494 · +0.8%
- By 2075
- 39,165 · +5.3%
- By 2100
- 40,221 · +8.1%
Race, ethnicity, and origin ACS 2023
- Neighborhood character
- Predominantly White (78%)
- Race & ethnicity
- White 78% Hispanic / Latino 18% Two or more races 7% Native American 2%
- Hispanic origin (detail)
- Mexican 10%
- Common ancestry
- Portuguese 2% Lithuanian 2% Romanian 2%
- Foreign-born
- 7% · Canada
- Languages at home
- 84% English-only · Spanish 14%
Political lean MEDSL · Dodge
- 2024 margin
- Solid R (+32.6) · D 33.0% · R 65.7% · Other 1.3%
- 2008→2024 swing
- -20.6pp toward R · 2008: -12.0pp · 2024: -32.6pp
- All cycles
- 2024: R+32.6 2020: R+32.1 2016: R+35.3 2012: R+22.7 2008: R+12.0
Not yet ingested
- Civics
- —
Market trends
- HPI YoY
- ▼ -164.59%
- Current HPI
- 318.3329
- Rent YoY
- ▼ -2.14%
- Metro
- Fremont, NE
- State GDP YoY
- ▲ 0.68%
- F500 in state
- 2
Industry mix (Fortune 500 HQ in NE)
| Industry | F500 HQs | Revenue |
|---|---|---|
| Conglomerate | 1 | $371B |
|
||
Price history
-10.7% since first listed3 events — show timeline
- 2026-05-12 Pending — GPRMLS
- 2026-04-21 Price Changed $125,000 GPRMLS
- 2026-03-25 Listed $140,000 GPRMLS
Cash-flow waterfall
monthlySold comps — $/sqft
last 12 mo · ≤1 miLoading sold comps…