 Multi-family
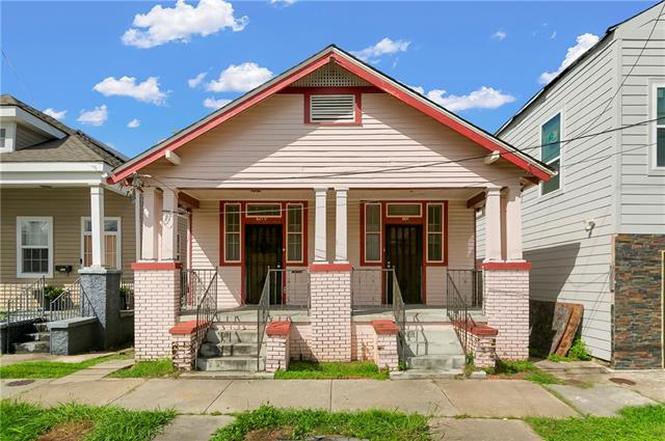
8217-19 Apple St · New Orleans, LA
Flood risk 8/10 · Major
- FEMA flood zone
- X (shaded)
- Chance of flooding over 30 yrs
- 0.6%
- Est. flood insurance / yr
- $507 – $1,088
Fire risk 1/10 · Minimal
- Est. fire insurance / yr
- $1,269 – $2,357
Heat risk 10/10 · Severe
- Hot days now (above 108°F)
- 7 days/yr
- Hot days in 30 yrs
- 21 days/yr
Wind risk 10/10 · Severe
- Chance of severe wind over 30 yrs
- 99.0%
Air-quality risk 4/10 · Minor
- Unhealthy air days now
- 4 days/yr
- Unhealthy air days in 30 yrs
- 4 days/yr
Risk factors via First Street. Map © Google.
Why this score? — see what drove the B+ grade
The composite is a weighted blend of 9 inputs, each scored 0–100. Each bar is that input's sub-score; the figure is the points it added to the 100-point composite (weight × sub-score).
- Cash flow +30.0/30.0
- ARV discount +15.0/15.0
- 1% rule +10.0/10.0
- DSCR +10.0/10.0
- Livability +4.0/5.0
- Rent growth +2.7/5.0
- Condition / age +2.5/5.0
- Schools +1.6/10.0
- Appreciation +0.0/10.0
$129,000
🖨 Deal sheet 📄 Offer letter ✓ Due diligence
Multi-family units
County records classify this as Multi-Family (2-4 Unit). Listing-text estimate: 1 unit. estimate disagrees with records
Listing remarks
Renovation opportunity in the Carrollton Neighborhood. Very convenient Uptown location one block to S Carrollton Ave. Shotgun double with original wood floors throughout. The property is a great candidate for state and federal historic tax credits.
Key facts
- Historic tax credits
- Original wood floors
- Uptown location
Tags
Property features AI
Exterior
- Parking: No designated parking
- Home design: Duplex; 2 total units
- Construction: Wood siding construction; Composition roof
- Exterior features: Composition roof; Wood siding
Interior
- Heating & cooling: No heating; No cooling
- Interior features: No central heating or cooling indicated
Neighborhood map
What this means for you Summary
Snapshot
- This is a 4-bed/2.0-bath multifamily listed at $129k.
Deal economics
- At list price, monthly cash flow is $1k ($16k/yr) — positive.
- The deal already cash-flows at list — no discount required.
- Meets the 1% rule at list price ($3k rent vs $129k).
- Cap rate 19.2% vs local median 4.4% in New Orleans — top-decile yield for the area; either an underpriced asset or a hidden risk that comps aren't pricing in. Stress-test before assuming the spread holds.
Location & tenants
- Location reads 81/100 on livability (#3 in LA, #1,383 nationally) — a professional / high-income tenant draw. Strengths: amenities A+, commute A+, health & safety A+; Watch: crime C-, employment D.
- Orleans Parish (urban): math 11% / reading 27% proficiency, ranked #69 of 98 in LA (top 70%) — low school quality limits family demand, transient renter base, plan for 1-2y turnover; 68% free/reduced lunch — lower-income household profile, screen leases tightly.
- Market conditions: Rents flat; 279 active listings in the ZIP; 40 comparable units currently listed for rent nearby; rentals at typical pace (median 17d on market — plan ~3-4 weeks tenant-placement turnaround); 710 units permitted in Orleans Parish in 2024 (244 in 5+ unit buildings).
- At $2,911/mo this rent would consume 55% of the median local household income ($64k/yr) (locally 2237% of renters already pay >50% of income on rent) — very limited rent-growth headroom before tenants either downsize or default.
Forward outlook
- Local home prices are declining (-3.0%/yr); year-one equity from $892 of loan paydown is wiped out by about $4k of value loss. Plan a longer hold.
- Orleans County population projected at +61% by 2050 — long-run rental-demand tailwind backs the buy-and-hold thesis.
- At projected returns (-3.0% appreciation + 1.0% rent growth), your $36k cash investment doubles in ~3 years — after that, you're playing with house money.
Negotiation context
- Only 8 days on market — expect competitive offers; lowballing is unlikely to land.
Risks & watch-outs
- Watch-outs: flood insurance adds $66/mo; built in 1920 — expect roof / HVAC / electrical / plumbing capex.
- Climate carrying-cost: severe flood risk; severe wind risk, 99% chance of damaging wind over 30y; extreme-heat days projected 7→21/yr by 2055 (HVAC capex compounding) — expect insurance premiums to compound above CPI over the hold.
Questions for the listing agent
- Built in 1920 — when were the roof, HVAC, electrical panel, plumbing, and water heater last replaced?
- What's the actual annual flood-insurance premium (NFIP or private), and is the property in a SFHA with mandatory coverage?
- Is there a deadline driving the sale (1031 exchange, divorce, estate, relocation)? That informs how much negotiation room exists.
- What's the average days-on-market for RENTAL listings here right now (not sales)? A rising rental-DOM trend means longer vacancies and softer asking-rent achievability than the comps imply.
- What's the recent tenant-quality profile in this submarket — average credit score on applications, eviction rate, late-payment / NSF rate, and stable-employment percentage? A property-management company in the area should have these aggregated.
- How much new apartment / multifamily construction is in the pipeline within 1–3 miles? Heavy new supply (>2% of stock underway) typically softens rents 12–24 months out; light construction supports rent growth.
Investment metrics
- 1% rule
- 2.26% ✓
- Cap rate
- 19.20%
- Cash-on-cash
- 46.08%
- DSCR
- 3.05
- GRM
- 3.7
CMA / ARV
- ARV (on-the-fly)
- $215,424
- Comps found
- 12
Show comp detail 12 sales within ~0.75 mi
| Address | Dist | Beds/Ba | Sqft | Sold | Price | $/sf | Match |
|---|---|---|---|---|---|---|---|
| 8316 18 S Claiborne Ave | 0.20mi | 4/2.0 | 1,610 (-1%) | 10mo | $125,000 | $78 | 80 |
| 8628 30 Apple St | 0.29mi | 4/2.0 | 1,558 (-4%) | 6mo | $205,000 | $132 | 74 |
| 8335 37 S Claiborne Ave | 0.16mi | 4/2.0 | 1,809 (+11%) | 4mo | $175,000 | $97 | 71 |
| 8839-37 Colapissa St | 0.54mi | 4/2.0 | 1,568 (-4%) | 10mo | $120,000 | $77 | 60 |
| 2717 A Cherry St | 0.70mi | 4/2.0 | 1,704 (+4%) | 2mo | $187,000 | $110 | 59 |
| 8517 19 Forshey St | 0.51mi | 4/2.0 | 1,512 (-7%) | 8mo | $219,000 | $145 | 58 |
| 3316 18 Joliet St | 0.51mi | 4/2.0 | 1,512 (-7%) | 8mo | $220,000 | $146 | 57 |
| 8319 21 Birch St | 0.69mi | 4/2.0 | 1,750 (+7%) | 4mo | $339,000 | $194 | 52 |
| 8828 Hickory St | 0.72mi | 3/2.5 (-1) | 1,687 (+3%) | 4mo | $169,000 | $100 | 50 |
| 1832 Eagle St | 0.65mi | 3/3.0 (-1) | 1,512 (-7%) | 0mo | $90,000 | $60 | 48 |
| 8840 Spruce St | 0.62mi | 4/4.0 | 1,875 (+15%) | 1mo | $330,000 | $176 | 37 |
| 1921 General Ogden St | 0.63mi | 4/4.0 | 1,875 (+15%) | 1mo | $330,000 | $176 | 37 |
Match score weights: distance 35% · size 25% · config 20% · recency 20%. Top-matched comps best support the ARV.
Projected returns pro-forma
-3.0% appreciation · 0.97% rent growth · sell at horizon
- IRR
- 38.4%
- Equity multiple
- 2.59×
- Total profit
- $57,481
- Equity at exit
- $19,234
- IRR
- 43.9%
- Equity multiple
- 4.76×
- Total profit
- $135,802
- Equity at exit
- $11,154
Cash invested: $36,120 (down + closing). Projections, not guarantees.
Landlord ↔ Tenant lean methodology
- Overall (STATE)
- 90 Strongly Landlord-Friendly
- State Louisiana
- 90 Strongly Landlord-Friendly · R+12
- County
- — inherits STATE
- City
- — inherits STATE
ZIP-level market 70118
- Rents YoY
- 1.0%
- Active inventory
- 279
- Price-to-rent
- 7.4×
Monthly cashflow live
- Estimated rent
- $2,911 high interval (Pro) →
- Mortgage (P&I)
- −$676
- Tax from tax record
- −$182 /mo · $2,188/yr
- Insurance
- −$54
- Flood insurance flood zone
- −$66 /mo · $798/yr
- HOA
- −$0
- Vacancy / Maint / Mgmt
- −$611
- Net cashflow
- $1,321
Break-even live
2-unit breakdown (identical units grouped — click to expand)
| Units | Beds | Baths | Est. rent |
|---|---|---|---|
| 2× units | 2 | 1 | $2,910 |
| #1 | 2 | 1 | $1,455 |
| #2 | 2 | 1 | $1,455 |
| Total (2 units) | $2,911 | ||
UW: 25.0% down · 7.5% · 30yr · 1.5% tax · 5.0% vac · 8.0% maint · 8.0% mgmt
Financing live
Cash to close
- Down payment
- $32,250
- Closing costs
- $3,870
- Reserves months
- —
- Total cash needed
- —
Loan-product check · same deal, 3 products live
Conventional
25% down · 7.5% · 30yr
- Down + closing
- —
- Monthly P&I
- —
- Monthly cashflow
- —
- DSCR
- —
- Eligible?
- —
Personal DTI + credit; lowest rate.
DSCR
20% down · 8.5% · 30yr
- Down + closing
- —
- Monthly P&I
- —
- Monthly cashflow
- —
- DSCR
- —
- Eligible?
- —
No personal income docs; deal must DSCR.
Hard money
10% down · 12.0% · 12mo
- Down + closing
- —
- Monthly P&I
- —
- Monthly cashflow
- —
- DSCR
- —
- Eligible?
- —
Short-term bridge; refi at stabilization.
Rent comps 40 comps
| Address | Beds | Baths | Sqft | Rent | $/sqft | DOM | Units | Dist |
|---|---|---|---|---|---|---|---|---|
| 2616 Cambronne St Unit 2618 New Orleans, LA | 3.0 | 1.0 | 1200 | $1,475 | $1.23 | 23d | 1 | 0.10mi |
| 8405 Apricot St New Orleans, LA | 3.0 | 2.0 | 1058 | $1,795 | $1.70 | 3d | 1 | 0.16mi |
| 8405 Apricot St New Orleans, LA | 3.0 | 2.0 | 1058 | $1,795 | $1.70 | 3d | 1 | 0.16mi |
| 7933 Belfast St Unit Upper New Orleans, LA | 3.0 | 2.0 | 1500 | $2,400 | $1.60 | 23d | 1 | 0.21mi |
| 2251 Cambronne St Unit A New Orleans, LA | 3.0 | 1.5 | 1945 | $2,495 | $1.28 | 23d | 1 | 0.25mi |
| 2305 Joliet St New Orleans, LA | 3.0 | 2.0 | 1451 | $2,500 | $1.72 | 43d | 1 | 0.29mi |
| 2308 Short St New Orleans, LA | 3.0 | 2.0 | 1600 | $2,800 | $1.75 | 3d | 1 | 0.31mi |
| 2231 S Carrollton Ave Unit D New Orleans, LA | 3.0 | 2.0 | 1600 | $2,495 | $1.56 | 23d | 1 | 0.31mi |
| 2527 Eagle St New Orleans, LA | 3.0 | 2.0 | 1571 | $2,200 | $1.40 | 23d | 1 | 0.35mi |
| 7922 Colapissa St New Orleans, LA | 4.0 | 2.0 | 1848 | $2,400 | $1.30 | 10d | 1 | 0.36mi |
| 7909 Sycamore St New Orleans, LA | 3.0 | 2.0 | 2000 | $2,400 | $1.20 | 3d | 1 | 0.39mi |
| 8812 Apple St New Orleans, LA | 3.0 | 2.0 | 1085 | $1,650 | $1.52 | 16d | 1 | 0.39mi |
| 2102 S Carrollton Ave New Orleans, LA | 3.0 | 2.0 | 1800 | $2,250 | $1.25 | 11d | 1 | 0.39mi |
| 2102 S Carrollton Ave Unit NA New Orleans, LA | 3.0 | 2.0 | 1800 | $2,250 | $1.25 | 10d | 1 | 0.39mi |
| 2101 S Carrollton Ave New Orleans, LA | 4.0 | 2.0 | 1800 | $2,400 | $1.33 | 23d | 1 | 0.41mi |
| 7902 Sycamore St New Orleans, LA | 4.0 | 2.0 | 1991 | $3,200 | $1.61 | 43d | 1 | 0.41mi |
| 2201 Burdette St New Orleans, LA | 3.0 | 1.5 | 1800 | $2,695 | $1.50 | 17d | 1 | 0.46mi |
| 2835 Pine St Unit 2835 New Orleans, LA | 3.0 | 2.0 | 1219 | $2,995 | $2.46 | 43d | 1 | 0.46mi |
| 2833 Pine St Unit 2833 New Orleans, LA | 3.0 | 2.0 | 1219 | $3,200 | $2.63 | 19d | 1 | 0.46mi |
| 2116 Burdette St New Orleans, LA | 3.0 | 1.0 | 1700 | $1,975 | $1.16 | 3d | 1 | 0.47mi |
| 8426 Spruce St New Orleans, LA | 3.0 | 2.0 | 1700 | $3,000 | $1.76 | 43d | 1 | 0.49mi |
| 2741 Audubon St New Orleans, LA | 3.0 | 2.0 | 1100 | $1,800 | $1.64 | 3d | 1 | 0.56mi |
| 8929 Colapissa St New Orleans, LA | 3.0 | 1.0 | 1300 | $1,400 | $1.08 | 23d | 1 | 0.57mi |
| 8502 Edinburgh St New Orleans, LA | 3.0 | 2.0 | 1456 | $1,800 | $1.24 | 3d | 1 | 0.58mi |
| 2338 Audubon St New Orleans, LA | 3.0 | 2.0 | 1935 | $2,000 | $1.03 | 3d | 1 | 0.61mi |
| 2014 Lowerline St New Orleans, LA | 3.0 | 1.5 | 1600 | $2,850 | $1.78 | 14d | 1 | 0.62mi |
| 8816 Olive St New Orleans, LA | 3.0 | 2.0 | 1200 | $1,800 | $1.50 | 23d | 1 | 0.62mi |
| 8816 Olive St Unit A-B New Orleans, LA | 3.0 | 2.0 | 1200 | $1,800 | $1.50 | 16d | 1 | 0.62mi |
| 2308 Audubon St New Orleans, LA | 4.0 | 1.5 | 1480 | $3,050 | $2.06 | 16d | 1 | 0.62mi |
| 9107 Fig St New Orleans, LA | 3.0 | 3.0 | 1230 | $2,000 | $1.63 | 3d | 1 | 0.63mi |
| 2201 Broadway St Unit 2 New Orleans, LA | 4.0 | 2.0 | 2000 | $3,000 | $1.50 | 43d | 1 | 0.64mi |
| 2203 Broadway St New Orleans, LA | 3.0 | 2.0 | 1491 | $3,000 | $2.01 | 21d | 1 | 0.64mi |
| 7616 Cohn St Unit A New Orleans, LA | 3.0 | 2.5 | 1492 | $3,300 | $2.21 | 17d | 1 | 0.68mi |
| 1836 General Ogden St New Orleans, LA | 3.0 | 2.0 | 1368 | $1,675 | $1.22 | 23d | 1 | 0.69mi |
| 2010 Broadway St New Orleans, LA | 4.0 | 2.0 | 1600 | $2,400 | $1.50 | 23d | 1 | 0.70mi |
| 8626 Green St New Orleans, LA | 3.0 | 1.5 | 1450 | $1,500 | $1.03 | 17d | 1 | 0.72mi |
| 4117 State Street Dr New Orleans, LA | 3.0 | 1.0 | 1678 | $1,550 | $0.92 | 11d | 1 | 0.74mi |
| 8815 Palm St New Orleans, LA | 3.0 | 2.0 | 1195 | $2,100 | $1.76 | 23d | 1 | 0.75mi |
| 1526 Dante St New Orleans, LA | 3.0 | 3.0 | 1446 | $3,000 | $2.07 | 17d | 1 | 0.75mi |
| 1517 Dante St New Orleans, LA | 3.0 | 1.0 | 1500 | $1,700 | $1.13 | 17d | 1 | 0.76mi |
Listing history 6 events
-
2026-06-18days on market $129,000 Active 8 DOM
-
2026-06-17days on market $129,000 Active 7 DOM
-
2026-06-16days on market $129,000 Active 6 DOM
-
2026-06-15days on market $129,000 Active 5 DOM
-
2026-06-13remarks 248-char remark
-
2026-06-13$129,000 Active 3 DOM
ⓘ Source: listings_history table (triggers on properties + properties_extension) + one-shot
backfill from property_details.listing_events for pre-trigger history.
Tax reassessment forecast LA · Resets to sale price
- Current annual tax
- $2,188 · $182/mo
- Projected year-2 tax
- $2,188 · $182/mo
- Expected delta
- $0/yr ($0/mo · 0.0%)
ⓘ Screening estimate from a state-policy table — verify with the county assessor before closing.
Climate risk First Street
- Flood 8/10 Severe FEMA zone X (shaded) · 60% chance over 30 yrs
- Wildfire 1/10 Low
- Heat 10/10 Extreme 7 d/yr ≥108°F today · 21 d/yr by 30 yrs out
- Wind 10/10 Extreme 99% chance of damaging wind over 30 yrs
- Air quality 4/10 Moderate 4 unhealthy d/yr today · 4 by 30 yrs out
Nearby sold comps map
Loading sold comps map…
Walkable amenities ~0.75 mi
Loading nearby amenities…
Taxation est. · year 1
- Rental income
- $34,932
- − Mortgage interest
- −$7,226
- − Property taxes
- −$2,188
- − Insurance
- −$1,442
- − Repairs & maintenance
- −$2,795
- − Management
- −$2,795
- − Depreciation
- −$3,753
- Taxable income
- $14,734
- Est. tax owed @ 24.0%
- −$3,536
- After-tax cash flow
- $12,312/yr
For passive investors: Depreciation is non-cash, so a rental often shows a tax loss while cash-flowing — sheltering income. Rental losses are passive: they offset passive income freely, and up to $25,000/yr can offset ordinary (W-2) income if you actively participate and your MAGI is under $100k (phasing out to $0 by $150k); unused losses carry forward. On sale, claimed depreciation is recaptured at up to 25%, and gains may owe capital-gains tax (a 1031 exchange can defer both). Figures are a year-1 estimate at your 24.0% rate — not tax advice; consult a CPA.
Schools (NCES district)
- District
- Orleans Parish
- NCES district ID
- 2201170
- Math proficiency
- 11% ▼ -52.00%
- Reading proficiency
- 27% ▼ -46.00%
- Median HH income
- $37,011
- Composite
- 15.78/100
- National rank
- #9271
- State rank
- #69 of 98 in LA
Livability — New Orleans
- Score
- 81/100
- State rank
- #3
- US rank
- #1383
Category grades
Schools grade is shown separately in the Schools card above.
Census & demographics
- Census place
- New Orleans, LA
- County
- Orleans Parish · 338,817 people
- City population
- 338,817
- Metro
- New Orleans-Metairie, LA
- Population (ZIP)
- 36,072
- Household income
- $63,750
- Rent vs Own
- Severe rent burden
- 2237.0
Population outlook (Orleans County) Hauer SSP2
- Today (2025)
- 513,025 people
- By 2030
- 575,781 · +12.2%
- By 2040
- 700,174 · +36.5%
- By 2050
- 826,541 · +61.1%
- By 2075
- 1,123,374 · +119.0%
- By 2100
- 1,355,609 · +164.2%
Race, ethnicity, and origin ACS 2023
- Neighborhood character
- Diverse neighborhood (Simpson 0.65)
- Race & ethnicity
- White 47% Black 34% Hispanic / Latino 11% Two or more races 11% Asian 4%
- Hispanic origin (detail)
- Mexican 2%
- Common ancestry
- Lithuanian 8% Italian 2% Romanian 2%
- Foreign-born
- 9% · Canada, China
- Languages at home
- 86% English-only · Spanish 7% French/Haitian/Cajun 2% Other Indo-European 2%
Political lean MEDSL · Orleans
- 2024 margin
- Solid D (+67.0) · D 82.2% · R 15.2% · Other 2.7%
- 2008→2024 swing
- +6.7pp toward D · 2008: 60.3pp · 2024: 67.0pp
- All cycles
- 2024: D+67.0 2020: D+68.2 2016: D+66.2 2012: D+62.5 2008: D+60.3
Not yet ingested
- Civics
- —
Market trends
- HPI YoY
- ▼ -210.46%
- Current HPI
- 282.9629
- Rent YoY
- ▲ 0.97%
- Metro
- New Orleans-Metairie, LA
- State GDP YoY
- ▲ 3.29%
- F500 in state
- 10
Industry mix (Fortune 500 HQ in LA)
| Industry | F500 HQs | Revenue |
|---|---|---|
| Telecommunications | 2 | $23B |
|
||
| Utilities | 1 | $12B |
|
||
| Wholesale / Distribution | 1 | $5B |
|
||
| Advertising | 1 | $2B |
|
||
Price history
1 event — show timeline
- 2026-06-10 Listed $129,000 AcadianaMLS
Property tax history
+2.9%/yrLatest (2026): $2,188 · +1.1% YoY. Source: county tax records.
Cash-flow waterfall
monthlySold comps — $/sqft
last 12 mo · ≤1 miLoading sold comps…