 Multi-family
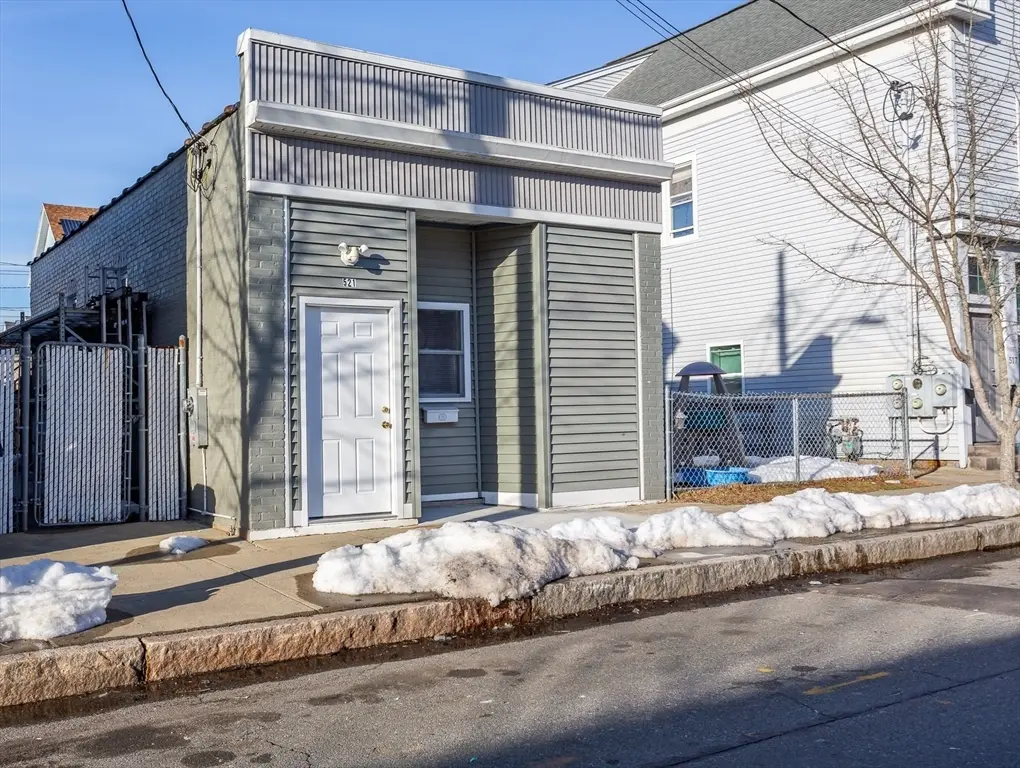
521 Kempton St · New Bedford, MA
Flood risk 1/10 · Minimal
- FEMA flood zone
- X (unshaded)
- Chance of flooding over 30 yrs
- 0.0%
- Est. flood insurance / yr
- $507 – $1,088
Fire risk 1/10 · Minimal
- Est. fire insurance / yr
- $915 – $1,699
Heat risk 5/10 · Moderate
- Hot days now (above 94°F)
- 7 days/yr
- Hot days in 30 yrs
- 16 days/yr
Wind risk 8/10 · Major
- Chance of severe wind over 30 yrs
- 80.0%
Air-quality risk 2/10 · Minimal
- Unhealthy air days now
- 1 days/yr
- Unhealthy air days in 30 yrs
- 2 days/yr
Risk factors via First Street. Map © Google.
Why this score? — see what drove the C- grade
The composite is a weighted blend of 9 inputs, each scored 0–100. Each bar is that input's sub-score; the figure is the points it added to the 100-point composite (weight × sub-score).
- Cash flow +20.1/30.0
- ARV discount +7.5/15.0
- DSCR +6.4/10.0
- 1% rule +5.3/10.0
- Rent growth +5.0/5.0
- Livability +3.4/5.0
- Condition / age +2.5/5.0
- Schools +1.9/10.0
- Appreciation +0.0/10.0
$279,900
🖨 Deal sheet 📄 Offer letter ✓ Due diligence
Multi-family units
County records classify this as Multi-Family (2-4 Unit). Listing-text estimate: 1 unit. estimate disagrees with records
Listing remarks MLS
Charming and completely rehabbed, this cozy studio home offers comfort, style, and affordability. Featuring modern finishes, updated flooring and fixtures, and a bright, open layout that maximizes space. Enjoy a private fenced in yard. A full basement ideal for storage, workshop, or creative use. Conveniently located within walking distance to downtown, the train station, and bus routes, with easy access to shopping, dining, and entertainment. Ideal for first time buyers, down sizers, or anyone seeking low maintenance living. The flexible layout also offers potential for accessible or handicap friendly modifications.
Key facts
- Full basement
- Private yard
- 3,911 sq ft lot
Tags
Neighborhood map
What this means for you Summary
Snapshot
- This is a 1-bed/1.0-bath multifamily listed at $280k.
Deal economics
- At list price, monthly cash flow is $346 ($4k/yr) — positive.
- The deal already cash-flows at list — no discount required.
- Meets the 1% rule at list price ($3k rent vs $280k).
- Recommended offer: $263k (6.0% below list) — sets the bar for market timing.
- Cap rate 7.8% vs local median 3.8% in New Bedford — top-decile yield for the area; either an underpriced asset or a hidden risk that comps aren't pricing in. Stress-test before assuming the spread holds.
Location & tenants
- Location reads 67/100 on livability (#155 in MA) — a middle-class / working-renter tenant base. Strengths: health & safety A+, housing B+; Watch: cost of living C-, schools D, employment D.
- New Bedford (suburban): math 17% / reading 28% proficiency, ranked #287 of 302 in MA (top 95%) — low school quality limits family demand, transient renter base, plan for 1-2y turnover; 65% free/reduced lunch — lower-income household profile, screen leases tightly.
- Market conditions: Rents rising fast (+10.8%/yr); 60 active listings in the ZIP; 24 comparable units currently listed for rent nearby; rentals leasing fast (median 12d on market — plan ~1-2 weeks tenant-placement turnaround); 760 units permitted in Bristol County in 2024 (142 in 5+ unit buildings).
- At $2,887/mo this rent would consume 63% of the median local household income ($55k/yr) (locally 2883% of renters already pay >50% of income on rent) — very limited rent-growth headroom before tenants either downsize or default.
Forward outlook
- Local home prices are declining (-3.0%/yr); year-one equity from $2k of loan paydown is wiped out by about $8k of value loss. Plan a longer hold.
- Bristol County population projected to shrink 3% by 2050 — rents likely to lag national; underwrite the cash flow, not the appreciation.
- At projected returns (-3.0% appreciation + 8.0% rent growth), your $78k cash investment doubles in ~9 years — after that, you're playing with house money.
Negotiation context
- It's been on market 89 days — a 6% lower offer ($263k) is reasonable based on typical stale-listing flexibility.
Risks & watch-outs
- Watch-outs: built in 1930 — expect roof / HVAC / electrical / plumbing capex.
- Climate carrying-cost: severe wind risk, 80% chance of damaging wind over 30y; extreme-heat days projected 7→16/yr by 2055 (HVAC capex compounding) — expect insurance premiums to compound above CPI over the hold.
Questions for the listing agent
- It's been on market 89 days. Have you received any prior offers? Is the seller open to a 6% concession, seller financing, or rate buy-down credit?
- Built in 1930 — when were the roof, HVAC, electrical panel, plumbing, and water heater last replaced?
- Why hasn't it sold? Are there any deal-killer items the seller is aware of (foundation, flood, title, zoning, code violations)?
- Is there a deadline driving the sale (1031 exchange, divorce, estate, relocation)? That informs how much negotiation room exists.
- Schools are D-rated, which usually means shorter tenancies and higher turnover. Who's the typical renter profile here, and what's been the actual vacancy rate?
- What's the average days-on-market for RENTAL listings here right now (not sales)? A rising rental-DOM trend means longer vacancies and softer asking-rent achievability than the comps imply.
- What's the recent tenant-quality profile in this submarket — average credit score on applications, eviction rate, late-payment / NSF rate, and stable-employment percentage? A property-management company in the area should have these aggregated.
- How much new apartment / multifamily construction is in the pipeline within 1–3 miles? Heavy new supply (>2% of stock underway) typically softens rents 12–24 months out; light construction supports rent growth.
Investment metrics
- 1% rule
- 1.03% ✓
- Cap rate
- 7.78%
- Cash-on-cash
- 5.30%
- DSCR
- 1.24
- GRM
- 8.1
CMA / ARV
No comps found within radius.
Projected returns pro-forma
-3.0% appreciation · 8.0% rent growth · sell at horizon
- IRR
- -2.6%
- Equity multiple
- 0.90×
- Total profit
- $-7,992
- Equity at exit
- $41,734
- IRR
- 12.0%
- Equity multiple
- 2.16×
- Total profit
- $91,068
- Equity at exit
- $24,201
Cash invested: $78,372 (down + closing). Projections, not guarantees.
Landlord ↔ Tenant lean methodology
- Overall (STATE)
- 20 Strongly Tenant-Friendly
- State Massachusetts
- 20 Strongly Tenant-Friendly · D+15
- County
- — inherits STATE
- City
- — inherits STATE
ZIP-level market 02740
- Rents YoY
- 10.8%
- Active inventory
- 60
- Price-to-rent
- 16.2×
Monthly cashflow live
- Estimated rent
- $2,887 medium interval (Pro) →
- Mortgage (P&I)
- −$1,468
- Tax est. 1.5%
- −$350 /mo · $4,198/yr
- Insurance
- −$117
- HOA
- −$0
- Vacancy / Maint / Mgmt
- −$606
- Net cashflow
- $346
Break-even live
2-unit breakdown (identical units grouped — click to expand)
| Units | Beds | Baths | Est. rent |
|---|---|---|---|
| 2× units | 1 | 1 | $2,886 |
| #1 | 1 | 1 | $1,443 |
| #2 | 1 | 1 | $1,443 |
| Total (2 units) | $2,887 | ||
UW: 25.0% down · 7.5% · 30yr · 1.5% tax · 5.0% vac · 8.0% maint · 8.0% mgmt
Financing live
Cash to close
- Down payment
- $69,975
- Closing costs
- $8,397
- Reserves months
- —
- Total cash needed
- —
Loan-product check · same deal, 3 products live
Conventional
25% down · 7.5% · 30yr
- Down + closing
- —
- Monthly P&I
- —
- Monthly cashflow
- —
- DSCR
- —
- Eligible?
- —
Personal DTI + credit; lowest rate.
DSCR
20% down · 8.5% · 30yr
- Down + closing
- —
- Monthly P&I
- —
- Monthly cashflow
- —
- DSCR
- —
- Eligible?
- —
No personal income docs; deal must DSCR.
Hard money
10% down · 12.0% · 12mo
- Down + closing
- —
- Monthly P&I
- —
- Monthly cashflow
- —
- DSCR
- —
- Eligible?
- —
Short-term bridge; refi at stabilization.
Rent comps 24 comps
| Address | Beds | Baths | Sqft | Rent | $/sqft | DOM | Units | Dist |
|---|---|---|---|---|---|---|---|---|
| 81 Summer St Unit 3E New Bedford, MA | 2.0 | 1.0 | 700 | $1,600 | $2.29 | 3d | 1 | 0.35mi |
| 110 8th St New Bedford, MA | 1.0 | 1.0 | 600 | $1,500 | $2.50 | 21d | 1 | 0.51mi |
| 47-49 Foster St New Bedford, MA | 1.0 | 1.0 | 700 | $1,250 | $1.79 | 43d | 1 | 0.56mi |
| 800 Pleasant St New Bedford, MA | 1.0–3.0 | 1.0–2.0 | 955 | $1,440 | $1.51 | 1d | 6 | 0.63mi |
| 44 7th St Unit 2 New Bedford, MA | 1.0 | 1.0 | 700 | $1,395 | $1.99 | 10d | 1 | 0.69mi |
| 12 Barkers Ln New Bedford, MA | 1.0 | 1.0 | 575 | $1,625 | $2.83 | 1d | 1 | 0.78mi |
| 87 N Water St Apt 104 New Bedford, MA | 1.0 | 1.0 | 675 | $1,800 | $2.67 | 3d | 1 | 0.82mi |
| 87 N Water St Unit 106 New Bedford, MA | 1.0 | 1.0 | 670 | $1,950 | $2.91 | 43d | 1 | 0.82mi |
| 87 N Water St Apt 104 New Bedford, MA | 1.0 | 1.0 | 675 | $1,850 | $2.74 | 43d | 1 | 0.82mi |
| 280 Acushnet Ave New Bedford, MA | 1.0–2.0 | 1.0 | 672 | $1,081 | $1.61 | 1d | 1 | 0.82mi |
| 70 Russell St Apt 5 New Bedford, MA | 1.0 | 1.0 | 750 | $1,500 | $2.00 | 43d | 1 | 0.83mi |
| 53 Merrimac St Unit 3E New Bedford, MA | 2.0 | 1.0 | 650 | $1,400 | $2.15 | 43d | 1 | 0.89mi |
| 19 Commercial St Unit 202 New Bedford, MA | 1.0 | 1.0 | 733 | $2,000 | $2.73 | 23d | 1 | 0.90mi |
| 184 State St New Bedford, MA | 1.0–3.0 | 1.0 | 564 | $1,470 | $2.61 | 1d | 3 | 0.91mi |
| 23-25 Harrison St Unit 2 New Bedford, MA | 1.0 | 1.0 | 500 | $1,400 | $2.80 | 10d | 1 | 0.91mi |
| 88 Linden St Unit 1S New Bedford, MA | 2.0 | 1.0 | 500 | $1,400 | $2.80 | 3d | 1 | 0.92mi |
| 186 Grinnell St Unit 1N New Bedford, MA | 1.0 | 1.0 | 650 | $1,500 | $2.31 | 43d | 1 | 0.98mi |
| 116 Clark St Unit 2 New Bedford, MA | 1.0 | 1.0 | 400 | $1,400 | $3.50 | 43d | 1 | 1.06mi |
| 1870 Purchase St New Bedford, MA | 1.0 | 1.0 | 650 | $1,350 | $2.08 | 23d | 1 | 1.07mi |
| 494 Rivet St Apt 2 New Bedford, MA | 2.0 | 1.0 | 700 | $1,400 | $2.00 | 10d | 1 | 1.22mi |
| 391 Rivet St Unit 2 New Bedford, MA | 1.0 | 1.0 | 682 | $1,500 | $2.20 | 1d | 1 | 1.28mi |
| 31 Hicks St Unit 1 New Bedford, MA | 2.0 | 1.0 | 665 | $2,000 | $3.01 | 1d | 1 | 1.29mi |
| 126 Crapo St Unit 2S New Bedford, MA | 1.0 | 1.0 | 500 | $1,200 | $2.40 | 11d | 1 | 1.40mi |
| 303 Coggeshall St Unit 1E New Bedford, MA | — | 1.0 | 525 | $1,450 | $2.76 | 43d | 1 | 1.47mi |
Listing history 8 events
-
2026-06-05days on market $279,900 Active 89 DOM
-
2026-06-03days on market $279,900 Active 88 DOM
-
2026-06-02days on market $279,900 Active 87 DOM
-
2026-06-01days on market $279,900 Active 86 DOM
-
2026-05-31statusdays on market $279,900 Active 85 DOM
-
2026-05-02price $289,900 624-char remark
Show marketing remark (624 chars)
Charming and completely rehabbed, this cozy studio home offers comfort, style, and affordability. Featuring modern finishes, updated flooring and fixtures, and a bright, open layout that maximizes space. Enjoy a private fenced in yard. A full basement ideal for storage, workshop, or creative use. Conveniently located within walking distance to downtown, the train station, and bus routes, with easy access to shopping, dining, and entertainment. Ideal for first time buyers, down sizers, or anyone seeking low maintenance living. The flexible layout also offers potential for accessible or handicap friendly modifications.
-
2026-04-11price $294,900 624-char remark
Show marketing remark (624 chars)
Charming and completely rehabbed, this cozy studio home offers comfort, style, and affordability. Featuring modern finishes, updated flooring and fixtures, and a bright, open layout that maximizes space. Enjoy a private fenced in yard. A full basement ideal for storage, workshop, or creative use. Conveniently located within walking distance to downtown, the train station, and bus routes, with easy access to shopping, dining, and entertainment. Ideal for first time buyers, down sizers, or anyone seeking low maintenance living. The flexible layout also offers potential for accessible or handicap friendly modifications.
-
2026-03-06$299,900 New 624-char remark
Show marketing remark (624 chars)
Charming and completely rehabbed, this cozy studio home offers comfort, style, and affordability. Featuring modern finishes, updated flooring and fixtures, and a bright, open layout that maximizes space. Enjoy a private fenced in yard. A full basement ideal for storage, workshop, or creative use. Conveniently located within walking distance to downtown, the train station, and bus routes, with easy access to shopping, dining, and entertainment. Ideal for first time buyers, down sizers, or anyone seeking low maintenance living. The flexible layout also offers potential for accessible or handicap friendly modifications.
ⓘ Source: listings_history table (triggers on properties + properties_extension) + one-shot
backfill from property_details.listing_events for pre-trigger history.
Climate risk First Street
- Flood 1/10 Low FEMA zone X (unshaded) · 0% chance over 30 yrs
- Wildfire 1/10 Low
- Heat 5/10 Major 7 d/yr ≥94°F today · 16 d/yr by 30 yrs out
- Wind 8/10 Severe 80% chance of damaging wind over 30 yrs
- Air quality 2/10 Low 1 unhealthy d/yr today · 2 by 30 yrs out
Nearby sold comps map
Loading sold comps map…
Walkable amenities ~0.75 mi
Loading nearby amenities…
Taxation est. · year 1
- Rental income
- $34,644
- − Mortgage interest
- −$15,679
- − Property taxes
- −$4,198
- − Insurance
- −$1,400
- − Repairs & maintenance
- −$2,772
- − Management
- −$2,772
- − Depreciation
- −$8,143
- Taxable loss
- −$318
- Est. tax savings @ 24.0%
- +$76
- After-tax cash flow
- $4,233/yr
For passive investors: Depreciation is non-cash, so a rental often shows a tax loss while cash-flowing — sheltering income. Rental losses are passive: they offset passive income freely, and up to $25,000/yr can offset ordinary (W-2) income if you actively participate and your MAGI is under $100k (phasing out to $0 by $150k); unused losses carry forward. On sale, claimed depreciation is recaptured at up to 25%, and gains may owe capital-gains tax (a 1031 exchange can defer both). Figures are a year-1 estimate at your 24.0% rate — not tax advice; consult a CPA.
Schools (NCES district)
- District
- New Bedford
- NCES district ID
- 2508430
- Math proficiency
- 17% ▼ -14.00%
- Reading proficiency
- 28% ▼ -6.00%
- Median HH income
- $37,901
- Composite
- 18.79/100
- National rank
- #8869
- State rank
- #287 of 302 in MA
Livability — New Bedford
- Score
- 67/100
- State rank
- #155
- US rank
- #10150
Category grades
Schools grade is shown separately in the Schools card above.
Census & demographics
- Census place
- New Bedford, MA
- County
- Bristol County · 342,083 people
- City population
- 76,528
- Metro
- Providence-Warwick, RI-MA
- Population (ZIP)
- 46,281
- Household income
- $55,237
- Rent vs Own
- Severe rent burden
- 2883.0
Population outlook (Bristol County) Hauer SSP2
- Today (2025)
- 570,212 people
- By 2030
- 571,181 · +0.2%
- By 2040
- 565,389 · -0.8%
- By 2050
- 552,141 · -3.2%
- By 2075
- 520,923 · -8.6%
- By 2100
- 474,363 · -16.8%
Race, ethnicity, and origin ACS 2023
- Neighborhood character
- Diverse neighborhood (Simpson 0.67)
- Race & ethnicity
- White 52% Hispanic / Latino 23% Two or more races 17% Black 8% Asian 2% Native American 1%
- Hispanic origin (detail)
- Puerto Rican 14% Dominican 2%
- Common ancestry
- Russian 27% Lithuanian 5% Romanian 2%
- Foreign-born
- 19% · Canada, China
- Languages at home
- 65% English-only · Other Indo-European 15% Spanish 15% French/Haitian/Cajun 3%
Political lean MEDSL · Bristol
- 2024 margin
- Toss-up / Even · D 49.8% · R 48.5% · Other 1.8%
- 2008→2024 swing
- -21.9pp toward R · 2008: 23.2pp · 2024: 1.3pp
- All cycles
- 2024: D+1.3 2020: D+12.0 2016: D+9.3 2012: D+20.5 2008: D+23.2
Not yet ingested
- Civics
- —
Market trends
- HPI YoY
- ▼ -270.36%
- Current HPI
- 388.4115
- Rent YoY
- ▲ 10.79%
- Metro
- Providence-Warwick, RI-MA
- State GDP YoY
- ▲ 2.28%
- F500 in state
- 38
Industry mix (Fortune 500 HQ in MA)
| Industry | F500 HQs | Revenue |
|---|---|---|
| Technology | 3 | $17B |
|
||
| Insurance | 2 | $84B |
|
||
| Retail | 2 | $76B |
|
||
| Life Sciences | 1 | $43B |
|
||
| Energy Technology | 1 | $31B |
|
||
| Aerospace / Defense | 1 | $18B |
|
||
Price history
-3.3% since first listed3 events — show timeline
- 2026-05-02 Price Changed $289,900 MLS PIN
- 2026-04-11 Price Changed $294,900 MLS PIN
- 2026-03-06 Listed $299,900 MLS PIN
Cash-flow waterfall
monthlySold comps — $/sqft
last 12 mo · ≤1 miLoading sold comps…