 Duplex
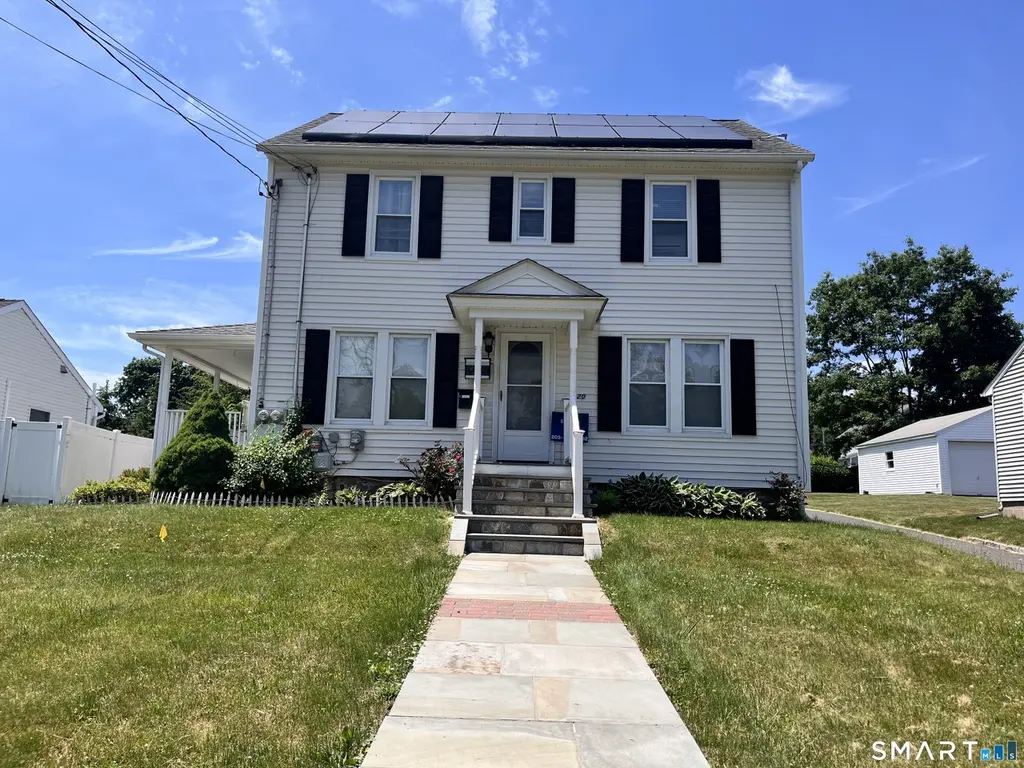
20 Laurel St · Danbury, CT
Flood risk 1/10 · Minimal
- FEMA flood zone
- X (unshaded)
- Chance of flooding over 30 yrs
- 0.0%
- Est. flood insurance / yr
- $473 – $860
Fire risk 1/10 · Minimal
- Est. fire insurance / yr
- $829 – $1,539
Heat risk 4/10 · Minor
- Hot days now (above 99°F)
- 7 days/yr
- Hot days in 30 yrs
- 15 days/yr
Wind risk 5/10 · Moderate
- Chance of severe wind over 30 yrs
- 26.0%
Air-quality risk 3/10 · Minor
- Unhealthy air days now
- 3 days/yr
- Unhealthy air days in 30 yrs
- 4 days/yr
Risk factors via First Street. Map © Google.
Why this score? — see what drove the D+ grade
The composite is a weighted blend of 9 inputs, each scored 0–100. Each bar is that input's sub-score; the figure is the points it added to the 100-point composite (weight × sub-score).
- Cash flow +14.0/30.0
- ARV discount +13.9/15.0
- DSCR +4.3/10.0
- Livability +3.8/5.0
- 1% rule +3.4/10.0
- Rent growth +3.3/5.0
- Condition / age +2.5/5.0
- Schools +2.4/10.0
- Appreciation +0.0/10.0
$549,000
🖨 Deal sheet 📄 Offer letter ✓ Due diligence
Multi-family units
County records classify this as Multi-Family (2-4 Unit). Listing-text estimate: 2 units. confirmed
Listing remarks MLS
Two Family House Conveniently located. Hardwood Floors, Gas Heat, all separate utilities Must See.Call Agent For Easy Showing
Key facts
- In-unit laundry
- Solar panels
- Walk-up attic
Tags
Property features AI
Finance
- Financial info: Assessed value available
Exterior
- Utilities: Private well water; Public sewer connection; 40-gallon hot water tank; Natural gas
- Home design: Multi-family property (2-family)
- Construction: Frame construction; Concrete foundation; Asphalt shingle roof; Vinyl siding; Built as a two-unit multi-family
- Exterior features: Level lot; Beach rights
Interior
- Bedrooms: 5 bedrooms total
- Bathrooms: 2 full bathrooms
- Heating & cooling: Hot water heating fueled by natural gas
- Interior features: Ceiling fans and window air-conditioning units; Full unfinished walk-out basement with storage and hatchway; Attic with walk-up storage
- Laundry & utility: Washer and dryer in each unit; Laundry located in-unit and in the basement
Neighborhood map
What this means for you Summary
Snapshot
- This is a 2 × 2-bed/1.0-bath units multifamily listed at $549k.
Deal economics
- At list price, monthly cash flow is $73 ($878/yr) — positive. Per door: $37/mo.
- The deal already cash-flows at list — no discount required.
- To meet the 1% rule (rent ≥ 1% of price), the offer needs to be $463k (15.7% below list).
- Recommended offer: $463k (15.7% below list) — sets the bar for 1% rule.
- Cap rate 6.5% vs local median 3.6% in Danbury — top-decile yield for the area; either an underpriced asset or a hidden risk that comps aren't pricing in. Stress-test before assuming the spread holds.
Location & tenants
- Location reads 76/100 on livability (#51 in CT, #3,379 nationally) — a middle-class / working-renter tenant base. Strengths: commute A+, housing A+, health & safety A+; Watch: amenities F, cost of living F.
- Danbury School District (urban): math 19% / reading 32% proficiency, ranked #131 of 153 in CT (top 86%) — low school quality limits family demand, transient renter base, plan for 1-2y turnover.
- Zoned schools: Mill Ridge Primary School (math 37% / reading 32%, grade F, #340 of 553 statewide, top 63%, 329 students, 35% FRL); Danbury High School (math 19% / reading 41%, grade F, #137 of 194 statewide, top 70%, 3,590 students, 48% FRL) — zoned schools at 42% FRL track the district average.
- Market conditions: Rents rising (+3.1%/yr); 197 active listings in the ZIP; 8 comparable units currently listed for rent nearby; rentals at typical pace (median 24d on market — plan ~3-4 weeks tenant-placement turnaround); solid renter incomes; 1,151 units permitted in Western Connecticut Planning Region in 2024 (714 in 5+ unit buildings).
- At $4,626/mo this rent would consume 72% of the median local household income ($77k/yr) (locally 3255% of renters already pay >50% of income on rent) — very limited rent-growth headroom before tenants either downsize or default.
Forward outlook
- Local home prices are declining (-3.0%/yr); year-one equity from $4k of loan paydown is wiped out by about $16k of value loss. Plan a longer hold.
Negotiation context
- Only 1 days on market — expect competitive offers; lowballing is unlikely to land.
- Current owner paid $290k; list at $549k implies a 89% gain — meaningful room to come down on a strong offer.
Risks & watch-outs
- Watch-outs: built in 1926 — expect roof / HVAC / electrical / plumbing capex.
- Climate carrying-cost: moderate wind risk, 26% chance of damaging wind over 30y — expect insurance premiums to compound above CPI over the hold.
Questions for the listing agent
- Can we see the unit-by-unit rent roll, current vacancy, and any below-market leases? What's the average tenancy length?
- What capital expenditures (roof, boiler, parking lot, exteriors) have been made in the last 5 years, and what's planned in the next 2?
- Built in 1926 — when were the roof, HVAC, electrical panel, plumbing, and water heater last replaced?
- Is there a deadline driving the sale (1031 exchange, divorce, estate, relocation)? That informs how much negotiation room exists.
- Schools are D-rated, which usually means shorter tenancies and higher turnover. Who's the typical renter profile here, and what's been the actual vacancy rate?
- The area grade is low — what's the realistic commute time and amenity access for the typical tenant pool here? Any planned neighborhood developments (good or bad) we should know about?
- What's the average days-on-market for RENTAL listings here right now (not sales)? A rising rental-DOM trend means longer vacancies and softer asking-rent achievability than the comps imply.
- What's the recent tenant-quality profile in this submarket — average credit score on applications, eviction rate, late-payment / NSF rate, and stable-employment percentage? A property-management company in the area should have these aggregated.
- How much new apartment / multifamily construction is in the pipeline within 1–3 miles? Heavy new supply (>2% of stock underway) typically softens rents 12–24 months out; light construction supports rent growth.
Investment metrics
- 1% rule
- 0.84% ✗
- Cap rate
- 6.45%
- Cash-on-cash
- 0.57%
- DSCR
- 1.03
- GRM
- 9.9
CMA / ARV
- ARV (on-the-fly)
- $640,640
- Comps found
- 4
Show comp detail 4 sales within ~0.75 mi
| Address | Dist | Beds/Ba | Sqft | Sold | Price | $/sf | Match |
|---|---|---|---|---|---|---|---|
| 17 Bergh St | 0.20mi | 5/2.0 (+1) | 1,663 (-0%) | 5mo | $540,000 | $325 | 82 |
| 11 Roger Ave | 0.40mi | 4/2.0 | 1,664 (0%) | 5mo | $640,000 | $385 | 77 |
| 35 Merrimac St | 0.56mi | 4/3.0 | 1,911 (+15%) | 9mo | $550,000 | $288 | 38 |
| 16 Crofut St | 0.52mi | 3/2.0 (-1) | 1,436 (-14%) | 20mo | $601,000 | $419 | 31 |
Match score weights: distance 35% · size 25% · config 20% · recency 20%. Top-matched comps best support the ARV.
Projected returns pro-forma
-3.0% appreciation · 3.08% rent growth · sell at horizon
- IRR
- -15.3%
- Equity multiple
- 0.45×
- Total profit
- $-83,988
- Equity at exit
- $81,858
- IRR
- -6.7%
- Equity multiple
- 0.57×
- Total profit
- $-65,849
- Equity at exit
- $47,467
Cash invested: $153,720 (down + closing). Projections, not guarantees.
Landlord ↔ Tenant lean methodology
- Overall (STATE)
- 27 Tenant-Leaning
- State Connecticut
- 27 Tenant-Leaning · D+7
- County
- — inherits STATE
- City
- — inherits STATE
ZIP-level market 06810
- Rents YoY
- 3.1%
- Active inventory
- 197
- Price-to-rent
- 19.8×
Monthly cashflow live
- Estimated rent
- $4,626 high interval (Pro) →
- Mortgage (P&I)
- −$2,879
- Tax from tax record
- −$474 /mo · $5,683/yr
- Insurance
- −$229
- HOA
- −$0
- Vacancy / Maint / Mgmt
- −$971
- Net cashflow
- $73
Break-even live
2-unit breakdown (identical units grouped — click to expand)
| Units | Beds | Baths | Est. rent |
|---|---|---|---|
| 2× units | 2 | 1 | $4,626 |
| #1 | 2 | 1 | $2,313 |
| #2 | 2 | 1 | $2,313 |
| Total (2 units) | $4,626 | ||
UW: 25.0% down · 7.5% · 30yr · 1.5% tax · 5.0% vac · 8.0% maint · 8.0% mgmt
Financing live
Cash to close
- Down payment
- $137,250
- Closing costs
- $16,470
- Reserves months
- —
- Total cash needed
- —
Loan-product check · same deal, 3 products live
Conventional
25% down · 7.5% · 30yr
- Down + closing
- —
- Monthly P&I
- —
- Monthly cashflow
- —
- DSCR
- —
- Eligible?
- —
Personal DTI + credit; lowest rate.
DSCR
20% down · 8.5% · 30yr
- Down + closing
- —
- Monthly P&I
- —
- Monthly cashflow
- —
- DSCR
- —
- Eligible?
- —
No personal income docs; deal must DSCR.
Hard money
10% down · 12.0% · 12mo
- Down + closing
- —
- Monthly P&I
- —
- Monthly cashflow
- —
- DSCR
- —
- Eligible?
- —
Short-term bridge; refi at stabilization.
Rent comps 8 comps
| Address | Beds | Baths | Sqft | Rent | $/sqft | DOM | Units | Dist |
|---|---|---|---|---|---|---|---|---|
| 22 Irving Pl Danbury, CT | 3.0 | 1.0 | 1995 | $3,000 | $1.50 | 23d | 1 | 0.40mi |
| 9 Concord St Unit 3 Danbury, CT | 3.0 | 1.0 | 1160 | $2,600 | $2.24 | 43d | 1 | 0.72mi |
| 113 Park Ave Unit 7 Danbury, CT | 3.0 | 1.5 | 1205 | $3,000 | $2.49 | 23d | 1 | 0.84mi |
| 8 Rose St Unit 26-14 Danbury, CT | 3.0 | 1.5 | 1370 | $3,000 | $2.19 | 3d | 1 | 0.90mi |
| 10 Clapboard Ridge Rd Danbury, CT | 1.0–3.0 | 1.0–2.0 | 1061 | $3,308 | $3.12 | 2d | 20 | 0.97mi |
| 6 Barnum Ct #6 Danbury, CT | 3.0 | 2.5 | 1620 | $3,200 | $1.98 | 14d | 1 | 1.11mi |
| 28 Jefferson Ave Danbury, CT | 5.0 | 2.5 | 2186 | $5,900 | $2.70 | 43d | 1 | 1.17mi |
| 68 Grand St Danbury, CT | 3.0 | 1.0 | 1480 | $1,900 | $1.28 | 2d | 1 | 1.29mi |
Listing history 7 events
-
2026-06-18statusdays on market $549,000 Active 1 DOM
-
2026-06-17days on market $549,000 Coming Soon 8 DOM
-
2026-06-16days on market $549,000 Coming Soon 7 DOM
-
2026-06-15days on market $549,000 Coming Soon 6 DOM
-
2026-06-13days on market $549,000 Coming Soon 4 DOM
-
2026-06-10remarks 401-char remark
-
2026-06-10$549,000 Coming Soon 1 DOM
ⓘ Source: listings_history table (triggers on properties + properties_extension) + one-shot
backfill from property_details.listing_events for pre-trigger history.
Tax reassessment forecast CT · Partial reset (capped growth)
- Current annual tax
- $5,683 · $474/mo
- Projected year-2 tax
- $8,716 · $726/mo
- Expected delta
- +$3,033/yr (+$253/mo · 53.4%)
ⓘ Screening estimate from a state-policy table — verify with the county assessor before closing.
Climate risk First Street
- Flood 1/10 Low FEMA zone X (unshaded) · 0% chance over 30 yrs
- Wildfire 1/10 Low
- Heat 4/10 Moderate 7 d/yr ≥99°F today · 15 d/yr by 30 yrs out
- Wind 5/10 Major 26% chance of damaging wind over 30 yrs
- Air quality 3/10 Moderate 3 unhealthy d/yr today · 4 by 30 yrs out
Nearby sold comps map
Loading sold comps map…
Walkable amenities ~0.75 mi
Loading nearby amenities…
Taxation est. · year 1
- Rental income
- $55,512
- − Mortgage interest
- −$30,753
- − Property taxes
- −$5,683
- − Insurance
- −$2,745
- − Repairs & maintenance
- −$4,441
- − Management
- −$4,441
- − Depreciation
- −$15,971
- Taxable loss
- −$8,521
- Est. tax savings @ 24.0%
- +$2,045
- After-tax cash flow
- $2,923/yr
For passive investors: Depreciation is non-cash, so a rental often shows a tax loss while cash-flowing — sheltering income. Rental losses are passive: they offset passive income freely, and up to $25,000/yr can offset ordinary (W-2) income if you actively participate and your MAGI is under $100k (phasing out to $0 by $150k); unused losses carry forward. On sale, claimed depreciation is recaptured at up to 25%, and gains may owe capital-gains tax (a 1031 exchange can defer both). Figures are a year-1 estimate at your 24.0% rate — not tax advice; consult a CPA.
Schools (NCES district)
- District
- Danbury School District
- NCES district ID
- 0901020
- Math proficiency
- 19% ▼ -17.00%
- Reading proficiency
- 32% ▼ -16.00%
- Median HH income
- $65,793
- Composite
- 23.93/100
- National rank
- #7784
- State rank
- #131 of 153 in CT
Livability — Danbury
- Score
- 76/100
- State rank
- #51
- US rank
- #3379
Category grades
Schools grade is shown separately in the Schools card above.
Census & demographics
- Census place
- Danbury, CT
- County
- Fairfield County · 765,532 people
- City population
- 87,061
- Metro
- Bridgeport-Stamford-Norwalk, CT
- Population (ZIP)
- 55,833
- Household income
- $76,933
- Rent vs Own
- Severe rent burden
- 3255.0
Population outlook (Western Connecticut County) Hauer SSP2
- By 2040
- 685,031
Race, ethnicity, and origin ACS 2023
- Neighborhood character
- Highly diverse neighborhood (Simpson 0.72)
- Race & ethnicity
- Hispanic / Latino 37% White 35% Two or more races 19% Black 12% Asian 5%
- Hispanic origin (detail)
- Mexican 4% Puerto Rican 3% Dominican 6%
- Common ancestry
- Estonian 8% Russian 4% Romanian 3%
- Foreign-born
- 41% · Canada, Jamaica, Dominican Republic
- Languages at home
- 48% English-only · Spanish 32% Other Indo-European 16% Other Asian/Pacific 1%
Political lean MEDSL · Western Connecticut
- 2024 margin
- D (+19.1) · D 58.8% · R 39.7% · Other 1.6%
- All cycles
- 2024: D+19.1
Not yet ingested
- Civics
- —
Market trends
- HPI YoY
- ▼ -309.71%
- Current HPI
- 286.5484
- Rent YoY
- ▲ 3.08%
- Metro
- Bridgeport-Stamford-Norwalk, CT
- State GDP YoY
- ▲ 1.06%
- F500 in state
- 38
Industry mix (Fortune 500 HQ in CT)
| Industry | F500 HQs | Revenue |
|---|---|---|
| Industrial Machinery | 4 | $38B |
|
||
| Insurance | 3 | $71B |
|
||
| Financial Services | 2 | $25B |
|
||
| Transportation / Logistics | 2 | $18B |
|
||
| Healthcare | 1 | $247B |
|
||
| Telecommunications | 1 | $55B |
|
||
Price history
+32.3% since first listed6 events — show timeline
- 2026-06-09 Coming Soon $549,000 Smart MLS
- 2015-09-17 Sold (Public Records) $290,000 Public Records
- 2015-09-17 Sold (MLS) $290,000 Smart MLS
- 2015-09-07 Listing Removed — Smart MLS
- 2015-07-17 Listed $294,900 Smart MLS
- 2004-09-16 Sold (Public Records) $415,000 Public Records
Property tax history
+4.9%/yrLatest (2023): $5,683 · +15.3% YoY. Source: county tax records.
Cash-flow waterfall
monthlySold comps — $/sqft
last 12 mo · ≤1 miLoading sold comps…