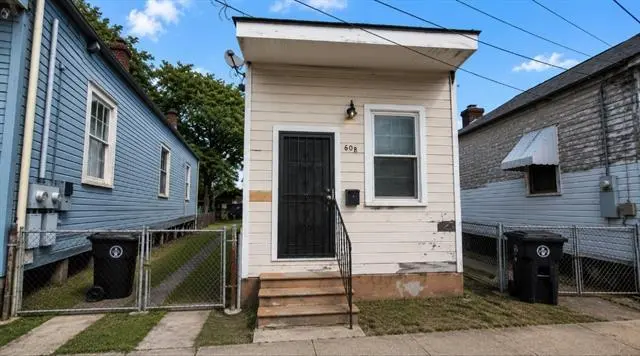
608 Tupelo St · New Orleans, LA
Flood risk 8/10 · Major
- FEMA flood zone
- X (shaded)
- Chance of flooding over 30 yrs
- 0.6%
- Est. flood insurance / yr
- $507 – $1,088
Fire risk 1/10 · Minimal
- Est. fire insurance / yr
- $1,269 – $2,357
Heat risk 10/10 · Severe
- Hot days now (above 108°F)
- 7 days/yr
- Hot days in 30 yrs
- 22 days/yr
Wind risk 10/10 · Severe
- Chance of severe wind over 30 yrs
- 99.0%
Air-quality risk 3/10 · Minor
- Unhealthy air days now
- 3 days/yr
- Unhealthy air days in 30 yrs
- 3 days/yr
Risk factors via First Street. Map © Google.
Why this score? — see what drove the D grade
The composite is a weighted blend of 9 inputs, each scored 0–100. Each bar is that input's sub-score; the figure is the points it added to the 100-point composite (weight × sub-score).
- Cash flow +16.5/30.0
- DSCR +5.1/10.0
- ARV discount +4.5/15.0
- Livability +4.0/5.0
- 1% rule +3.8/10.0
- Rent growth +3.1/5.0
- Condition / age +2.5/5.0
- Schools +1.6/10.0
- Appreciation +0.0/10.0
$140,000
🖨 Deal sheet 📄 Offer letter ✓ Due diligence
Listing remarks MLS
Charming Holy Cross shotgun home offering classic New Orleans character with modern-day convenience. This 2-bedroom, 1-bath single-family residence features 660 sq ft of efficient living space, in one of the city's most historic and vibrant neighborhoods. Shotgun homes are a beloved part of New Orleans architecture, known for their airy, open flow and timeless appeal. This layout maximizes every square foot while maintaining a cozy, functional feel--homeowners or investors alike. The property includes a private driveway, a valuable amenity in the area, along with a small yard that provides just the right amount of outdoor space for relaxing or entertaining. Inside, window units offer flexible cooling, and washer/dryer hookups add everyday convenience. Located in the desirable Holy Cross neighborhood, this home is surrounded by rich history, unique architecture, and a strong sense of community--all just minutes from the Mississippi River and downtown New Orleans. Whether you're looking for a primary residence, rental investment, or a quintessential New Orleans getaway, this shotgun home delivers charm, efficiency, and location. Sold as is
Key facts
- Private driveway
- Washer dryer hookups
- Small yard
Tags
Property features AI
Exterior
- Parking: Driveway
- Utilities: Public water; Public sewer
- Home design: Single-story; Raised foundation
- Construction: Shingle roof
- Exterior features: City lot; Rectangular lot; Lot dimensions approximately 24 x 108
Interior
- Bathrooms: 1 full bathroom
- Heating & cooling: Central air; Window unit(s) for cooling; Window unit heating
- Interior features: Total of 5 rooms; Average condition
- Laundry & utility: Washer hookup; Dryer hookup
Neighborhood map
What this means for you Summary
Snapshot
- This is a 2-bed/1.0-bath single-family listed at $140k.
Deal economics
- At list price, monthly cash flow is $16 ($189/yr) — positive.
- The deal already cash-flows at list — no discount required.
- To meet the 1% rule (rent ≥ 1% of price), the offer needs to be $123k (12.4% below list).
- Recommended offer: $123k (12.4% below list) — sets the bar for 1% rule.
- Cap rate 7.0% vs local median 4.4% in New Orleans — top-decile yield for the area; either an underpriced asset or a hidden risk that comps aren't pricing in. Stress-test before assuming the spread holds.
Location & tenants
- Location reads 81/100 on livability (#3 in LA, #1,383 nationally) — a professional / high-income tenant draw. Strengths: amenities A+, commute A+, health & safety A+; Watch: crime C-, employment D.
- Orleans Parish (urban): math 11% / reading 27% proficiency, ranked #69 of 98 in LA (top 70%) — low school quality limits family demand, transient renter base, plan for 1-2y turnover; 68% free/reduced lunch — lower-income household profile, screen leases tightly.
- Market conditions: Rents rising (+2.5%/yr); 581 active listings in the ZIP; 19 comparable units currently listed for rent nearby; rentals at typical pace (median 24d on market — plan ~3-4 weeks tenant-placement turnaround); 710 units permitted in Orleans Parish in 2024 (244 in 5+ unit buildings).
- This rent runs 32% of the median local income ($46k/yr) — at the standard rent-burdened threshold; future hikes will face affordability resistance.
Forward outlook
- Local home prices are declining (-3.0%/yr); year-one equity from $968 of loan paydown is wiped out by about $4k of value loss. Plan a longer hold.
- Orleans County population projected at +61% by 2050 — long-run rental-demand tailwind backs the buy-and-hold thesis.
Negotiation context
- It's been on market 19 days — a 2% lower offer ($138k) is reasonable based on typical stale-listing flexibility.
- 2 sale attempts with the ask held roughly flat each time — persistent listings suggest the price (not the market) is what's stuck; bring a comps-based counter.
- Current owner paid $8k; list at $140k implies a 1767% gain — meaningful room to come down on a strong offer.
Risks & watch-outs
- Watch-outs: flood insurance adds $66/mo.
- Climate carrying-cost: severe flood risk; severe wind risk, 99% chance of damaging wind over 30y; extreme-heat days projected 7→22/yr by 2055 (HVAC capex compounding) — expect insurance premiums to compound above CPI over the hold.
Questions for the listing agent
- Built in 1960 — when were the roof, HVAC, electrical panel, plumbing, and water heater last replaced?
- What's the actual annual flood-insurance premium (NFIP or private), and is the property in a SFHA with mandatory coverage?
- Is there a deadline driving the sale (1031 exchange, divorce, estate, relocation)? That informs how much negotiation room exists.
- The area grade is low — what's the realistic commute time and amenity access for the typical tenant pool here? Any planned neighborhood developments (good or bad) we should know about?
- What's the average days-on-market for RENTAL listings here right now (not sales)? A rising rental-DOM trend means longer vacancies and softer asking-rent achievability than the comps imply.
- What's the recent tenant-quality profile in this submarket — average credit score on applications, eviction rate, late-payment / NSF rate, and stable-employment percentage? A property-management company in the area should have these aggregated.
- How much new for-sale + rental construction is in the pipeline within 1–3 miles? Heavy new supply typically softens prices + rents 12–24 months out; constrained supply supports both.
Investment metrics
- 1% rule
- 0.88% ✗
- Cap rate
- 7.00%
- Cash-on-cash
- 2.52%
- DSCR
- 1.11
- GRM
- 9.5
CMA / ARV
- ARV (on-the-fly)
- $131,340
- Comps found
- 6
Show comp detail 6 sales within ~0.75 mi
| Address | Dist | Beds/Ba | Sqft | Sold | Price | $/sf | Match |
|---|---|---|---|---|---|---|---|
| 421 Tupelo St | 0.11mi | 2/1.0 | 635 (-4%) | 5mo | $126,500 | $199 | 85 |
| 1409 Delery St | 0.63mi | 2/1.0 | 648 (-2%) | 10mo | $40,000 | $62 | 59 |
| 5118 N Rampart St | 0.61mi | 1/1.0 (-1) | 710 (+8%) | 1mo | $195,000 | $275 | 53 |
| 1311 Delery St | 0.56mi | 2/1.0 | 725 (+10%) | 8mo | $90,000 | $124 | 51 |
| 7 Alice Ct | 0.54mi | 2/1.0 | 738 (+12%) | 7mo | $45,000 | $61 | 50 |
| 411 Lebeau St | 0.69mi | 2/1.0 | 731 (+11%) | 4mo | $194,000 | $265 | 46 |
Match score weights: distance 35% · size 25% · config 20% · recency 20%. Top-matched comps best support the ARV.
Projected returns pro-forma
-3.0% appreciation · 2.49% rent growth · sell at horizon
- IRR
- -16.1%
- Equity multiple
- 0.43×
- Total profit
- $-22,297
- Equity at exit
- $20,874
- IRR
- -8.6%
- Equity multiple
- 0.47×
- Total profit
- $-20,626
- Equity at exit
- $12,105
Cash invested: $39,200 (down + closing). Projections, not guarantees.
Landlord ↔ Tenant lean methodology
- Overall (STATE)
- 90 Strongly Landlord-Friendly
- State Louisiana
- 90 Strongly Landlord-Friendly · R+12
- County
- — inherits STATE
- City
- — inherits STATE
ZIP-level market 70117
- Rents YoY
- 2.5%
- Active inventory
- 581
- Price-to-rent
- 9.5×
Monthly cashflow live
- Estimated rent
- $1,227 high interval (Pro) →
- Mortgage (P&I)
- −$734
- Tax from tax record
- −$94 /mo · $1,134/yr
- Insurance
- −$58
- Flood insurance flood zone
- −$66 /mo · $798/yr
- HOA
- −$0
- Vacancy / Maint / Mgmt
- −$258
- Net cashflow
- $16
Break-even live
UW: 25.0% down · 7.5% · 30yr · 1.5% tax · 5.0% vac · 8.0% maint · 8.0% mgmt
Financing live
Cash to close
- Down payment
- $35,000
- Closing costs
- $4,200
- Reserves months
- —
- Total cash needed
- —
Loan-product check · same deal, 3 products live
Conventional
25% down · 7.5% · 30yr
- Down + closing
- —
- Monthly P&I
- —
- Monthly cashflow
- —
- DSCR
- —
- Eligible?
- —
Personal DTI + credit; lowest rate.
DSCR
20% down · 8.5% · 30yr
- Down + closing
- —
- Monthly P&I
- —
- Monthly cashflow
- —
- DSCR
- —
- Eligible?
- —
No personal income docs; deal must DSCR.
Hard money
10% down · 12.0% · 12mo
- Down + closing
- —
- Monthly P&I
- —
- Monthly cashflow
- —
- DSCR
- —
- Eligible?
- —
Short-term bridge; refi at stabilization.
Rent comps 19 comps
| Address | Beds | Baths | Sqft | Rent | $/sqft | DOM | Units | Dist |
|---|---|---|---|---|---|---|---|---|
| 637 Tupelo St New Orleans, LA | 1.0 | 1.0 | 663 | $1,100 | $1.66 | 23d | 1 | 0.09mi |
| 6310 Douglas St New Orleans, LA | 1.0 | 1.0 | 400 | $1,100 | $2.75 | 23d | 1 | 0.18mi |
| 1030 Gordon St New Orleans, LA | 2.0 | 1.0 | 675 | $1,200 | $1.78 | 3d | 1 | 0.35mi |
| 1030 Gordon St New Orleans, LA | 2.0 | 1.0 | 675 | $1,200 | $1.78 | 3d | 1 | 0.35mi |
| 1030 Gordon St New Orleans, LA | 2.0 | 1.0 | 675 | $12,000 | $17.78 | 43d | 1 | 0.35mi |
| 505 Andry St Unit C New Orleans, LA | 1.0 | 1.0 | 490 | $900 | $1.84 | 23d | 1 | 0.38mi |
| 1028 Fats Domino Ave Unit B New Orleans, LA | 1.0 | 1.0 | 460 | $900 | $1.96 | 23d | 1 | 0.41mi |
| 1015 Government St Unit 11 Arabi, LA | 2.0 | 1.0 | 720 | $999 | $1.39 | 43d | 1 | 0.49mi |
| 4950 Dauphine St New Orleans, LA | 1.0 | 1.0 | 612 | $1,750 | $2.86 | 10d | 16 | 0.69mi |
| 924 Deslonde St Unit B New Orleans, LA | 2.0 | 1.0 | 658 | $1,250 | $1.90 | 23d | 1 | 0.80mi |
| 4824 N Rampart St New Orleans, LA | 2.0 | 1.0 | 606 | $1,450 | $2.39 | 3d | 1 | 0.81mi |
| 4824 N Rampart St New Orleans, LA | 2.0 | 1.0 | 606 | $1,450 | $2.39 | 23d | 1 | 0.81mi |
| 4421 Burgundy St Unit 103 New Orleans, LA | 1.0 | 1.0 | 495 | $1,250 | $2.53 | 23d | 1 | 1.17mi |
| 4545 Urquhart St Unit B New Orleans, LA | 2.0 | 1.0 | 700 | $1,150 | $1.64 | 23d | 1 | 1.20mi |
| 4543 Urquhart St Unit B New Orleans, LA | 2.0 | 1.0 | 700 | $1,150 | $1.64 | 11d | 1 | 1.20mi |
| 4318 N Rampart St New Orleans, LA | 2.0 | 1.0 | 750 | $1,100 | $1.47 | 23d | 1 | 1.25mi |
| 7616 W Judge Perez Dr Unit B Arabi, LA | 2.0 | 1.0 | 750 | $1,200 | $1.60 | 3d | 1 | 1.36mi |
| 7616 W Judge Perez Dr Unit A Arabi, LA | 1.0 | 1.0 | 550 | $1,000 | $1.82 | 43d | 1 | 1.36mi |
| 3900 Royal St Unit 1B New Orleans, LA | 1.0 | 1.0 | 690 | $1,650 | $2.39 | 23d | 1 | 1.48mi |
Listing history 15 events
-
2026-06-18days on market $140,000 Active 19 DOM
-
2026-06-17days on market $140,000 Active 18 DOM
-
2026-06-16days on market $140,000 Active 17 DOM
-
2026-06-15days on market $140,000 Active 16 DOM
-
2026-06-13days on market $140,000 Active 14 DOM
-
2026-06-10days on market $140,000 Active 11 DOM
-
2026-06-09days on market $140,000 Active 10 DOM
-
2026-06-08days on market $140,000 Active 9 DOM
-
2026-06-07days on market $140,000 Active 8 DOM
-
2026-06-05days on market $140,000 Active 5 DOM
-
2026-06-03days on market $140,000 Active 4 DOM
-
2026-06-02days on market $140,000 Active 3 DOM
-
2026-06-01days on market $140,000 Active 2 DOM
-
2026-05-31remarks 687-char remark
-
2026-05-31$140,000 Active 1 DOM
ⓘ Source: listings_history table (triggers on properties + properties_extension) + one-shot
backfill from property_details.listing_events for pre-trigger history.
Tax reassessment forecast LA · Resets to sale price
- Current annual tax
- $1,134 · $94/mo
- Projected year-2 tax
- $1,134 · $94/mo
- Expected delta
- $0/yr ($0/mo · 0.0%)
ⓘ Screening estimate from a state-policy table — verify with the county assessor before closing.
Climate risk First Street
- Flood 8/10 Severe FEMA zone X (shaded) · 60% chance over 30 yrs
- Wildfire 1/10 Low
- Heat 10/10 Extreme 7 d/yr ≥108°F today · 22 d/yr by 30 yrs out
- Wind 10/10 Extreme 99% chance of damaging wind over 30 yrs
- Air quality 3/10 Moderate 3 unhealthy d/yr today · 3 by 30 yrs out
Nearby sold comps map
Loading sold comps map…
Walkable amenities ~0.75 mi
Loading nearby amenities…
Taxation est. · year 1
- Rental income
- $14,723
- − Mortgage interest
- −$7,842
- − Property taxes
- −$1,134
- − Insurance
- −$1,498
- − Repairs & maintenance
- −$1,178
- − Management
- −$1,178
- − Depreciation
- −$4,073
- Taxable loss
- −$2,179
- Est. tax savings @ 24.0%
- +$523
- After-tax cash flow
- $712/yr
For passive investors: Depreciation is non-cash, so a rental often shows a tax loss while cash-flowing — sheltering income. Rental losses are passive: they offset passive income freely, and up to $25,000/yr can offset ordinary (W-2) income if you actively participate and your MAGI is under $100k (phasing out to $0 by $150k); unused losses carry forward. On sale, claimed depreciation is recaptured at up to 25%, and gains may owe capital-gains tax (a 1031 exchange can defer both). Figures are a year-1 estimate at your 24.0% rate — not tax advice; consult a CPA.
Schools (NCES district)
- District
- Orleans Parish
- NCES district ID
- 2201170
- Math proficiency
- 11% ▼ -52.00%
- Reading proficiency
- 27% ▼ -46.00%
- Median HH income
- $37,011
- Composite
- 15.78/100
- National rank
- #9271
- State rank
- #69 of 98 in LA
Livability — New Orleans
- Score
- 81/100
- State rank
- #3
- US rank
- #1383
Category grades
Schools grade is shown separately in the Schools card above.
Census & demographics
- Census place
- New Orleans, LA
- County
- Orleans Parish · 338,817 people
- City population
- 338,817
- Metro
- New Orleans-Metairie, LA
- Population (ZIP)
- 25,652
- Household income
- $45,764
- Rent vs Own
- Severe rent burden
- 1988.0
Population outlook (Orleans County) Hauer SSP2
- Today (2025)
- 513,025 people
- By 2030
- 575,781 · +12.2%
- By 2040
- 700,174 · +36.5%
- By 2050
- 826,541 · +61.1%
- By 2075
- 1,123,374 · +119.0%
- By 2100
- 1,355,609 · +164.2%
Race, ethnicity, and origin ACS 2023
- Neighborhood character
- Majority Black (60%)
- Race & ethnicity
- Black 60% White 30% Two or more races 6% Hispanic / Latino 5%
- Common ancestry
- Lithuanian 5% Italian 1% Romanian 1%
- Foreign-born
- 5% · Canada, South Korea
- Languages at home
- 93% English-only · Spanish 3% Other Indo-European 1% French/Haitian/Cajun 1%
Political lean MEDSL · Orleans
- 2024 margin
- Solid D (+67.0) · D 82.2% · R 15.2% · Other 2.7%
- 2008→2024 swing
- +6.7pp toward D · 2008: 60.3pp · 2024: 67.0pp
- All cycles
- 2024: D+67.0 2020: D+68.2 2016: D+66.2 2012: D+62.5 2008: D+60.3
Not yet ingested
- Civics
- —
Market trends
- HPI YoY
- ▼ -177.22%
- Current HPI
- 184.6061
- Rent YoY
- ▲ 2.49%
- Metro
- New Orleans-Metairie, LA
- State GDP YoY
- ▲ 3.29%
- F500 in state
- 10
Industry mix (Fortune 500 HQ in LA)
| Industry | F500 HQs | Revenue |
|---|---|---|
| Telecommunications | 2 | $23B |
|
||
| Utilities | 1 | $12B |
|
||
| Wholesale / Distribution | 1 | $5B |
|
||
| Advertising | 1 | $2B |
|
||
Price history
+1766.7% since first listed3 events — show timeline
- 2026-05-30 Listed $140,000 AcadianaMLS
- 2026-05-30 Listed $140,000 GSREIN
- 1996-08-20 Sold (Public Records) $7,500 Public Records
Property tax history
+2.0%/yrLatest (2026): $1,134 · +1.0% YoY. Source: county tax records.
Cash-flow waterfall
monthlySold comps — $/sqft
last 12 mo · ≤1 miLoading sold comps…