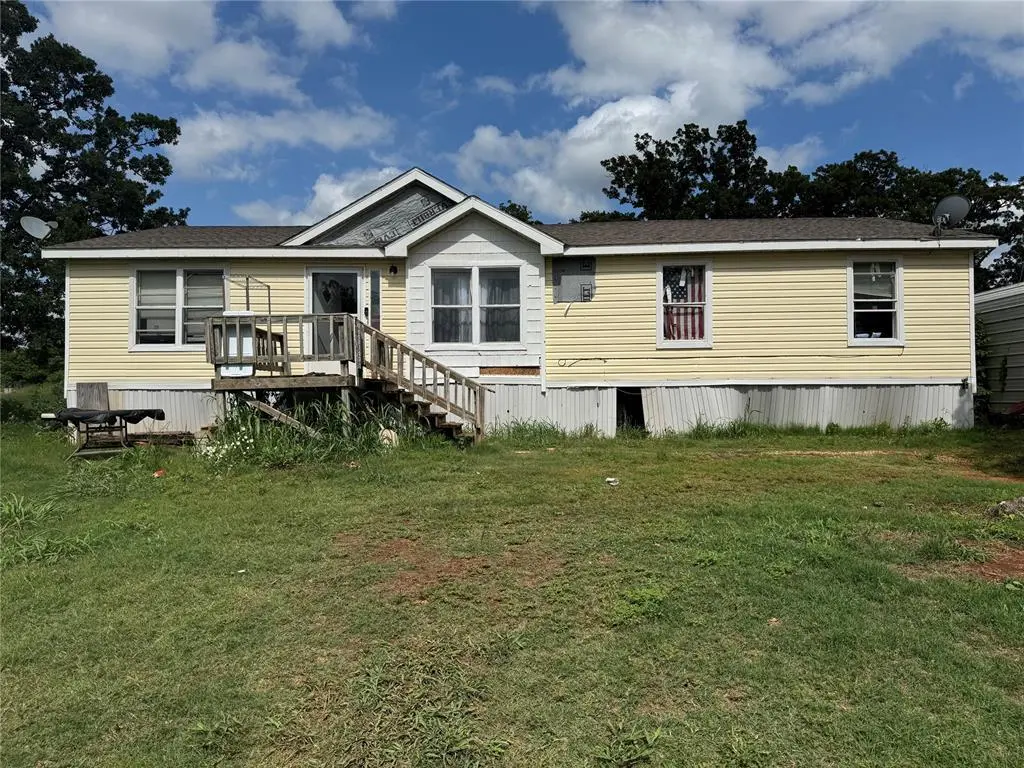
7561 SE 125th St · Slaughterville, OK
Flood risk 1/10 · Minimal
- FEMA flood zone
- X (unshaded)
- Chance of flooding over 30 yrs
- 0.0%
- Est. flood insurance / yr
- $507 – $1,088
Fire risk 5/10 · Moderate
- Est. fire insurance / yr
- $2,463 – $4,575
Heat risk 5/10 · Moderate
- Hot days now (above 109°F)
- 7 days/yr
- Hot days in 30 yrs
- 18 days/yr
Wind risk 3/10 · Minor
- Chance of severe wind over 30 yrs
- 5.0%
Air-quality risk 2/10 · Minimal
- Unhealthy air days now
- 1 days/yr
- Unhealthy air days in 30 yrs
- 1 days/yr
Risk factors via First Street. Map © Google.
Why this score? — see what drove the C grade
The composite is a weighted blend of 9 inputs, each scored 0–100. Each bar is that input's sub-score; the figure is the points it added to the 100-point composite (weight × sub-score).
- Cash flow +26.3/30.0
- DSCR +8.9/10.0
- ARV discount +7.5/15.0
- 1% rule +6.2/10.0
- Livability +3.2/5.0
- Rent growth +2.5/5.0
- Condition / age +2.5/5.0
- Schools +2.1/10.0
- Appreciation +0.0/10.0
$129,900
🖨 Deal sheet (PDF) 📄 Offer letter ✓ Due diligence
Listing remarks MLS
Looking to live in Noble and want a little acreage...This 3 bedroom, 2 bath manufactured home is on 1.25 acres . There is wood like flooring throughout the home. The kitchen has lots of counter space and pantry. The kitchen is open to the dining area and living room. There is a laundry room off of the kitchen. Covered decked patio. Master bathroom has double vanity tub and stand alone shower. There is a detached garage. Lots of trees and space to roam.
Key facts
- 1.29-acre lot
- Open concept
- Covered decked patio
Tags
Property features AI
Finance
- Other: Living area reported as 1,456 (assessor); Property located in Hilltop Heights addition; Homestead: No; Flood insurance: No; Directions available from Hwy 9 to SE 125th St
- Financial info: Assumable loan: No; Loan qualification: Unknown; Current list price: $139,900
- HOA & community: No mandatory association dues
Exterior
- Parking: 2-car garage
- Security: Below-ground storm shelter
- Utilities: Water, sewer and power information not provided
- Home design: Single family residence; Residential property; One-level entry; Property faces south
- Construction: Manufactured construction; Composition roof; Combination foundation; Built (existing)
- Exterior features: Covered patio; Rural, wooded lot
Interior
- Kitchen: Dining area (1)
- Bedrooms: 4 bedrooms (all on one level)
- Bathrooms: 2 full bathrooms
- Heating & cooling: Electric heating
- Interior features: One living area; No fireplace; No separate study; No in-law plan
Neighborhood map
What this means for you Summary
Snapshot
- This is a 3-bed/2.0-bath manufactured listed at $130k.
Deal economics
- At list price, monthly cash flow is $337 ($4k/yr) — positive.
- The deal already cash-flows at list — no discount required.
- Meets the 1% rule at list price ($1k rent vs $130k).
- Recommended offer: $128k (1.5% below list) — sets the bar for market timing.
- Cap rate 9.4% vs local median 4.4% in Slaughterville — top-decile yield for the area; either an underpriced asset or a hidden risk that comps aren't pricing in. Stress-test before assuming the spread holds.
Location & tenants
- Location reads 63/100 on livability (#228 in OK) — a middle-class / working-renter tenant base. Strengths: cost of living A+, housing A+, employment A; Watch: amenities F, commute F, health & safety F.
- Noble (suburban): math 23% / reading 25% proficiency, ranked #108 of 270 in OK (top 40%) — low school quality limits family demand, transient renter base, plan for 1-2y turnover.
- Zoned schools: John K Hubbard Es (math 27% / reading 27%, grade F, #311 of 845 statewide, top 40%, 646 students, 0% FRL); Curtis Inge Ms (math 18% / reading 20%, grade F, #178 of 345 statewide, top 52%, 712 students, 0% FRL); Noble Hs (math 17% / reading 27%, grade F, #222 of 447 statewide, top 52%, 883 students, 0% FRL) — zoned schools average 0% FRL vs 53% district-wide (53 pts lower); this property's tenant base skews higher-income than the district average.
- Market conditions: 215 active listings in the ZIP; 2 comparable units currently listed for rent nearby; 592 units permitted in Cleveland County in 2024 (12 in 5+ unit buildings).
Forward outlook
- Local home prices are declining (-3.0%/yr); year-one equity from $898 of loan paydown is wiped out by about $4k of value loss. Plan a longer hold.
- Cleveland County population projected at +40% by 2050 — long-run rental-demand tailwind backs the buy-and-hold thesis.
- At projected returns (-3.0% appreciation + 3.0% rent growth), your $36k cash investment doubles in ~10 years — after that, you're playing with house money.
Negotiation context
- It's been on market 22 days — a 2% lower offer ($128k) is reasonable based on typical stale-listing flexibility.
- 3 sale attempts since 20y ago; this cycle's ask has dropped $10k (7%) from the opening price — seller is motivated, your offer sets the floor, not the list.
- Current owner paid $89k; 46% above their basis — modest negotiation headroom, anchor on the comps not their cost.
Risks & watch-outs
- Climate carrying-cost: moderate wildfire risk; extreme-heat days projected 7→18/yr by 2055 (HVAC capex compounding) — expect insurance premiums to compound above CPI over the hold.
Questions for the listing agent
- Is there a deadline driving the sale (1031 exchange, divorce, estate, relocation)? That informs how much negotiation room exists.
- Schools are F-rated, which usually means shorter tenancies and higher turnover. Who's the typical renter profile here, and what's been the actual vacancy rate?
- What's the average days-on-market for RENTAL listings here right now (not sales)? A rising rental-DOM trend means longer vacancies and softer asking-rent achievability than the comps imply.
- What's the recent tenant-quality profile in this submarket — average credit score on applications, eviction rate, late-payment / NSF rate, and stable-employment percentage? A property-management company in the area should have these aggregated.
- How much new for-sale + rental construction is in the pipeline within 1–3 miles? Heavy new supply typically softens prices + rents 12–24 months out; constrained supply supports both.
Investment metrics
- 1% rule
- 1.12% ✓
- Cap rate
- 9.40%
- Cash-on-cash
- 11.10%
- DSCR
- 1.49
- GRM
- 7.4
CMA / ARV
No comps found within radius.
Projected returns pro-forma
-3.0% appreciation · 3.0% rent growth · sell at horizon
- IRR
- 0.3%
- Equity multiple
- 1.01×
- Total profit
- $355
- Equity at exit
- $19,369
- IRR
- 9.9%
- Equity multiple
- 1.76×
- Total profit
- $27,795
- Equity at exit
- $11,231
Cash invested: $36,372 (down + closing). Projections, not guarantees.
Landlord ↔ Tenant lean methodology
- Overall (STATE)
- 83 Strongly Landlord-Friendly
- State Oklahoma
- 83 Strongly Landlord-Friendly · R+20
- County
- — inherits STATE
- City
- — inherits STATE
ZIP-level market 73068
- Home prices YoY
- -4.8%
- Active inventory
- 215
- Price-to-rent
- 7.4×
Monthly cashflow live
- Estimated rent
- $1,460 medium interval (Pro) →
- Mortgage (P&I)
- −$681
- Tax from tax record
- −$82 /mo · $981/yr
- Insurance
- −$54
- HOA
- −$0
- Vacancy / Maint / Mgmt
- −$307
- Net cashflow
- $337
Break-even live
Sensitivity live
| Price | -10% $410 | -5% $373 | +0% $337 | +5% $300 | +10% $263 |
|---|---|---|---|---|---|
| Rent | -10% $221 | -5% $279 | +0% $337 | +5% $394 | +10% $452 |
| Rate | -1.0pp $402 | -0.5pp $370 | base $337 | +0.5pp $303 | +1.0pp $269 |
UW: 25.0% down · 7.5% · 30yr · 1.5% tax · 5.0% vac · 8.0% maint · 8.0% mgmt
Financing live
Cash to close
- Down payment
- $32,475
- Closing costs
- $3,897
- Reserves months
- —
- Total cash needed
- —
Loan-product check · same deal, 3 products live
Conventional
25% down · 7.5% · 30yr
- Down + closing
- —
- Monthly P&I
- —
- Monthly cashflow
- —
- DSCR
- —
- Eligible?
- —
Personal DTI + credit; lowest rate.
DSCR
20% down · 8.5% · 30yr
- Down + closing
- —
- Monthly P&I
- —
- Monthly cashflow
- —
- DSCR
- —
- Eligible?
- —
No personal income docs; deal must DSCR.
Hard money
10% down · 12.0% · 12mo
- Down + closing
- —
- Monthly P&I
- —
- Monthly cashflow
- —
- DSCR
- —
- Eligible?
- —
Short-term bridge; refi at stabilization.
Rent comps 2 comps
| Address | Beds | Baths | Sqft | Rent | $/sqft | DOM | Units | Dist |
|---|---|---|---|---|---|---|---|---|
| 7351 142nd St Unit 37 Noble, OK | 3.0 | 2.0 | 1216 | $1,350 | $1.11 | 3d | 1 | 1.42mi |
| 7500 144th St Unit 17 Noble, OK | 3.0 | 2.0 | 1216 | $1,350 | $1.11 | 3d | 1 | 1.48mi |
Listing history 16 events
-
2026-06-21days on market $129,900 Active 22 DOM
-
2026-06-19price $129,900 Active 19 DOM
-
2026-06-18days on market $134,900 Active 19 DOM
-
2026-06-17days on market $134,900 Active 18 DOM
-
2026-06-16days on market $134,900 Active 17 DOM
-
2026-06-15days on market $134,900 Active 16 DOM
-
2026-06-13days on market $134,900 Active 14 DOM
-
2026-06-13pricedays on market $134,900 Active 13 DOM
-
2026-06-09days on market $139,900 Active 10 DOM
-
2026-06-08days on market $139,900 Active 9 DOM
-
2026-06-07days on market $139,900 Active 8 DOM
-
2026-06-03days on market $139,900 Active 4 DOM
-
2026-06-02days on market $139,900 Active 3 DOM
-
2026-06-01days on market $139,900 Active 2 DOM
-
2026-05-31remarks 699-char remark
-
2026-05-31$139,900 Active 1 DOM
ⓘ Source: listings_history table (triggers on properties + properties_extension) + one-shot
backfill from property_details.listing_events for pre-trigger history.
Tax reassessment forecast OK · Resets to sale price
- Current annual tax
- $981 · $82/mo
- Projected year-2 tax
- $1,169 · $97/mo
- Expected delta
- +$188/yr (+$16/mo · 19.2%)
ⓘ Screening estimate from a state-policy table — verify with the county assessor before closing.
Climate risk First Street
- Flood 1/10 Low FEMA zone X (unshaded) · 0% chance over 30 yrs
- Wildfire 5/10 Major
- Heat 5/10 Major 7 d/yr ≥109°F today · 18 d/yr by 30 yrs out
- Wind 3/10 Moderate 5% chance of damaging wind over 30 yrs
- Air quality 2/10 Low 1 unhealthy d/yr today · 1 by 30 yrs out
Nearby sold comps map
Loading sold comps map…
Walkable amenities ~0.75 mi
Loading nearby amenities…
Taxation est. · year 1
- Rental income
- $17,523
- − Mortgage interest
- −$7,276
- − Property taxes
- −$981
- − Insurance
- −$650
- − Repairs & maintenance
- −$1,402
- − Management
- −$1,402
- − Depreciation
- −$3,779
- Taxable income
- $2,033
- Est. tax owed @ 24.0%
- −$488
- After-tax cash flow
- $3,550/yr
For passive investors: Depreciation is non-cash, so a rental often shows a tax loss while cash-flowing — sheltering income. Rental losses are passive: they offset passive income freely, and up to $25,000/yr can offset ordinary (W-2) income if you actively participate and your MAGI is under $100k (phasing out to $0 by $150k); unused losses carry forward. On sale, claimed depreciation is recaptured at up to 25%, and gains may owe capital-gains tax (a 1031 exchange can defer both). Figures are a year-1 estimate at your 24.0% rate — not tax advice; consult a CPA.
Schools (NCES district)
- District
- Noble
- NCES district ID
- 4021630
- Math proficiency
- 23% ▼ -8.00%
- Reading proficiency
- 25% ▼ -7.00%
- Median HH income
- $50,812
- Composite
- 21.31/100
- National rank
- #8384
- State rank
- #108 of 270 in OK
Livability — Slaughterville
- Score
- 63/100
- State rank
- #228
- US rank
- #15883
Category grades
Schools grade is shown separately in the Schools card above.
Census & demographics
- Census place
- Slaughterville, OK
- County
- Cleveland County · 239,547 people
- City population
- 12,003
- Metro
- Oklahoma City, OK
- Population (ZIP)
- 12,258
- Household income
- $73,821
- Rent vs Own
- Severe rent burden
- 301.0
Population outlook (Cleveland County) Hauer SSP2
- Today (2025)
- 323,621 people
- By 2030
- 349,070 · +7.9%
- By 2040
- 400,168 · +23.7%
- By 2050
- 454,101 · +40.3%
- By 2075
- 602,926 · +86.3%
- By 2100
- 734,485 · +127.0%
Race, ethnicity, and origin ACS 2023
- Neighborhood character
- Predominantly White (82%)
- Race & ethnicity
- White 82% Two or more races 8% Hispanic / Latino 5% Native American 5% Black 1%
- Hispanic origin (detail)
- Mexican 4% Puerto Rican 1%
- Common ancestry
- Slovak 3% Lithuanian 2% Italian 2%
- Foreign-born
- 1% · Canada
- Languages at home
- 98% English-only · Spanish 1%
Political lean MEDSL · Cleveland
- 2024 margin
- R (+14.9) · D 41.4% · R 56.4% · Other 2.2%
- 2008→2024 swing
- +9.1pp toward D · 2008: -24.0pp · 2024: -14.9pp
- All cycles
- 2024: R+14.9 2020: R+14.1 2016: R+21.7 2012: R+25.9 2008: R+24.0
Not yet ingested
- Civics
- —
Market trends
- HPI YoY
- ▼ -13.99%
- Current HPI
- 278.428
- Rent YoY
- —
- Metro
- Oklahoma City, OK
- State GDP YoY
- ▲ 1.55%
- F500 in state
- 6
Industry mix (Fortune 500 HQ in OK)
| Industry | F500 HQs | Revenue |
|---|---|---|
| Energy | 3 | $48B |
|
||
Price history
+65.6% since first listed10 events — show timeline
- 2026-05-27 Listed $139,900 MLSOK
- 2019-05-10 Sold (Public Records) $89,000 Public Records
- 2019-05-07 Sold (MLS) $88,900 MLSOK
- 2019-04-22 Pending — MLSOK
- 2019-03-29 Price Changed $86,900 MLSOK
- 2018-12-20 Price Changed $89,900 MLSOK
- 2018-09-08 Listed $99,900 MLSOK
- 2007-01-30 Sold (Public Records) $82,000 Public Records
- 2006-08-22 Listing Removed — MLSOK
- 2006-06-12 Listed $84,500 MLSOK
Property tax history
+3.0%/yrLatest (2024): $981 · +4.9% YoY. Source: county tax records.
Cash-flow waterfall
monthlySold comps — $/sqft
last 12 mo · ≤1 miLoading sold comps…