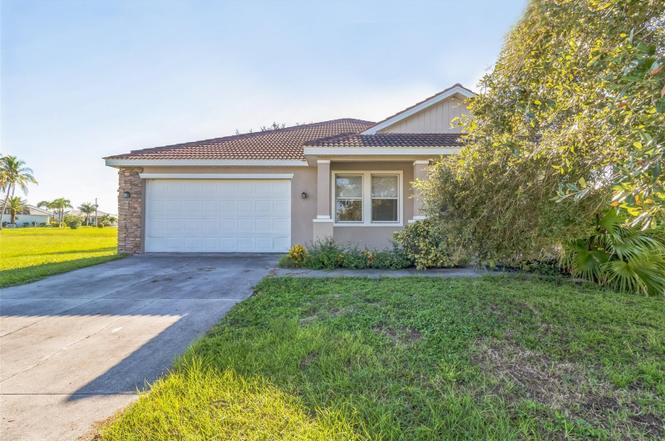
17370 Cape Horn Blvd · Burnt Store Marina, FL
Flood risk 9/10 · Severe
- FEMA flood zone
- AE
- Chance of flooding over 30 yrs
- 0.99%
- Est. flood insurance / yr
- $1,737 – $8,500
Fire risk 5/10 · Moderate
- Est. fire insurance / yr
- $947 – $1,759
Heat risk 10/10 · Severe
- Hot days now (above 107°F)
- 8 days/yr
- Hot days in 30 yrs
- 32 days/yr
Wind risk 10/10 · Severe
- Chance of severe wind over 30 yrs
- 99.0%
Air-quality risk 2/10 · Minimal
- Unhealthy air days now
- 1 days/yr
- Unhealthy air days in 30 yrs
- 2 days/yr
Risk factors via First Street. Map © Google.
Why this score? — see what drove the B+ grade
The composite is a weighted blend of 9 inputs, each scored 0–100. Each bar is that input's sub-score; the figure is the points it added to the 100-point composite (weight × sub-score).
- Cash flow +30.0/30.0
- ARV discount +15.0/15.0
- 1% rule +10.0/10.0
- DSCR +10.0/10.0
- Schools +4.6/10.0
- Livability +3.6/5.0
- Rent growth +2.5/5.0
- Condition / age +2.5/5.0
- Appreciation +0.0/10.0
$313,000
🖨 Deal sheet 📄 Offer letter ✓ Due diligence
Listing remarks
Located in the beautiful Burnt Storke Marina area, this property has everything you are looking for. The property has been freshly painted interior and exterior. Home has tile flooring throughout the wet areas and luxury vinyl plank flooring in the bedrooms. Kitchen features newly touched up kitchen cabinets, granite counter tops, stainless steel appliances. Bedrooms are a great size with ample closet space. Bathrooms have been freshly tiled for a more modern look.
Key facts
- Tile flooring
- Granite counter tops
- 9,598 sq ft lot
Tags
Property features AI
Finance
- Financial info: Lease restrictions apply
- HOA & community: HOA: Burnt Store Lakes Property Owners Association; Monthly HOA fee approximately $34 (annual $408); HOA includes grounds maintenance and recreational facilities; Association approval required; Community deed restrictions, park, sidewalks, street lights; Pets allowed
Exterior
- Parking: Driveway; Attached 2-car garage with garage door opener
- Utilities: Public water; Public sewer; Electricity connected; Cable available; Underground utilities; Water connected; Sewer connected
- Home design: Single-family residence; One story; West facing
- Construction: Block and stucco construction; Tile roof; Slab foundation; Built with living area of approximately 2,221 sq ft
- Exterior features: Covered porch; Rear porch; Screened porch; Exterior lighting; Sidewalk; Sliding doors; Irrigation equipment; Mature landscaping with trees
Interior
- Kitchen: Dishwasher; Disposal; Microwave; Range; Refrigerator; Electric water heater
- Bedrooms: 3 bedrooms
- Flooring: Ceramic tile
- Bathrooms: 2 full bathrooms
- Heating & cooling: Electric heating; Central air conditioning
- Interior features: Ceiling fans; High ceilings; Kitchen open to family room; Open floor plan; Solid surface countertops; Solid wood cabinets; Walk-in closets
- Laundry & utility: Laundry inside; Inside utility
Neighborhood map
What this means for you Summary
Snapshot
- This is a 3-bed/2.0-bath single-family listed at $313k.
Deal economics
- At list price, monthly cash flow is $1k ($13k/yr) — positive.
- The deal already cash-flows at list — no discount required.
- Meets the 1% rule at list price ($5k rent vs $313k).
- Recommended offer: $275k (12.0% below list) — sets the bar for market timing.
- Cap rate 12.1% vs local median 4.8% in Burnt Store Marina — top-decile yield for the area; either an underpriced asset or a hidden risk that comps aren't pricing in. Stress-test before assuming the spread holds.
Location & tenants
- Location reads 72/100 on livability (#354 in FL) — a middle-class / working-renter tenant base. Strengths: crime A+, employment A+, housing A+; Watch: cost of living C-, amenities F, commute F.
- Charlotte (suburban): math 54% / reading 54% proficiency, ranked #22 of 73 in FL (top 30%) — acceptable for families but not a draw, mixed tenant base, ~2y average lease.
- Zoned schools: East Elementary School (math 67% / reading 68%, grade B+, #435 of 2,144 statewide, top 21%, 761 students, 52% FRL); Charlotte High School (math 44% / reading 46%, grade D-, #228 of 667 statewide, top 35%, 1,994 students, 41% FRL).
- Market conditions: 1481 active listings in the ZIP; 22 comparable units currently listed for rent nearby; rentals at typical pace (median 24d on market — plan ~3-4 weeks tenant-placement turnaround); solid renter incomes; 4,585 units permitted in Charlotte County in 2024 (703 in 5+ unit buildings).
- At $4,846/mo this rent would consume 76% of the median local household income ($77k/yr) (locally 226% of renters already pay >50% of income on rent) — very limited rent-growth headroom before tenants either downsize or default.
Forward outlook
- Local home prices are declining (-3.0%/yr); year-one equity from $2k of loan paydown is wiped out by about $9k of value loss. Plan a longer hold.
- Charlotte County population projected at +24% by 2050 — long-run rental-demand tailwind backs the buy-and-hold thesis.
- At projected returns (-3.0% appreciation + 3.0% rent growth), your $88k cash investment doubles in ~8 years — after that, you're playing with house money.
Negotiation context
- It's been on market 307 days — a 12% lower offer ($275k) is reasonable based on typical stale-listing flexibility.
- 8 sale attempts since 21y ago with the ask held roughly flat each time — persistent listings suggest the price (not the market) is what's stuck; bring a comps-based counter.
Risks & watch-outs
- Watch-outs: flood insurance adds $427/mo.
- Climate carrying-cost: in FEMA flood zone AE (mandatory federal flood insurance); severe wind risk, 99% chance of damaging wind over 30y; moderate wildfire risk; extreme-heat days projected 8→32/yr by 2055 (HVAC capex compounding) — expect insurance premiums to compound above CPI over the hold.
Questions for the listing agent
- It's been on market 307 days. Have you received any prior offers? Is the seller open to a 12% concession, seller financing, or rate buy-down credit?
- What's the actual annual flood-insurance premium (NFIP or private), and is the property in a SFHA with mandatory coverage?
- What does the HOA fee cover, when was the last increase, and are there any pending special assessments or reserve-fund shortfalls?
- Why hasn't it sold? Are there any deal-killer items the seller is aware of (foundation, flood, title, zoning, code violations)?
- Is there a deadline driving the sale (1031 exchange, divorce, estate, relocation)? That informs how much negotiation room exists.
- What's the average days-on-market for RENTAL listings here right now (not sales)? A rising rental-DOM trend means longer vacancies and softer asking-rent achievability than the comps imply.
- What's the recent tenant-quality profile in this submarket — average credit score on applications, eviction rate, late-payment / NSF rate, and stable-employment percentage? A property-management company in the area should have these aggregated.
- How much new for-sale + rental construction is in the pipeline within 1–3 miles? Heavy new supply typically softens prices + rents 12–24 months out; constrained supply supports both.
Investment metrics
- 1% rule
- 1.55% ✓
- Cap rate
- 12.08%
- Cash-on-cash
- 20.68%
- DSCR
- 1.92
- GRM
- 5.4
CMA / ARV
- ARV (on-the-fly)
- $517,493
- Comps found
- 12
Show comp detail 12 sales within ~0.75 mi
| Address | Dist | Beds/Ba | Sqft | Sold | Price | $/sf | Match |
|---|---|---|---|---|---|---|---|
| 24378 Peppercorn Rd | 0.35mi | 3/2.0 | 2,305 (+4%) | 9mo | $650,000 | $282 | 70 |
| 17261 Naiad Ct | 0.23mi | 4/3.0 (+1) | 2,351 (+6%) | 4mo | $373,000 | $159 | 68 |
| 17199 Anthem Ln | 0.42mi | 3/3.0 | 2,259 (+2%) | 16mo | $750,000 | $332 | 60 |
| 24228 Peppercorn Rd | 0.33mi | 3/2.0 | 2,099 (-6%) | 20mo | $465,000 | $222 | 59 |
| 17139 Anthem Ln | 0.51mi | 3/2.0 | 1,995 (-10%) | 1mo | $465,000 | $233 | 58 |
| 17313 Muscat Ln | 0.38mi | 4/2.0 (+1) | 1,973 (-11%) | 4mo | $432,000 | $219 | 55 |
| 17533 Megra Ct | 0.43mi | 3/2.0 | 2,094 (-6%) | 22mo | $560,000 | $267 | 52 |
| 17458 Medillin Ct | 0.56mi | 3/2.0 | 2,175 (-2%) | 23mo | $433,400 | $199 | 51 |
| 17320 Comingo Ln | 0.51mi | 4/3.0 (+1) | 2,351 (+6%) | 13mo | $460,000 | $196 | 47 |
| 17013 Alpenhorn Ct | 0.75mi | 4/3.0 (+1) | 2,351 (+6%) | 5mo | $375,000 | $160 | 42 |
| 17122 Barcrest Ln | 0.65mi | 3/3.0 | 2,462 (+11%) | 8mo | $795,000 | $323 | 41 |
| 1040 Matecumbe Key Rd | 0.68mi | 4/3.5 (+1) | 2,359 (+6%) | 17mo | $1,030,000 | $437 | 33 |
Match score weights: distance 35% · size 25% · config 20% · recency 20%. Top-matched comps best support the ARV.
Projected returns pro-forma
-3.0% appreciation · 3.0% rent growth · sell at horizon
- IRR
- 5.5%
- Equity multiple
- 1.21×
- Total profit
- $18,752
- Equity at exit
- $46,669
- IRR
- 15.0%
- Equity multiple
- 2.22×
- Total profit
- $106,979
- Equity at exit
- $27,063
Cash invested: $87,640 (down + closing). Projections, not guarantees.
Landlord ↔ Tenant lean methodology
- Overall (STATE)
- 87 Strongly Landlord-Friendly
- State Florida
- 87 Strongly Landlord-Friendly · R+3
- County
- — inherits STATE
- City
- — inherits STATE
ZIP-level market 33955
- Home prices YoY
- -24.5%
- Active inventory
- 1481
- Price-to-rent
- 5.4×
Monthly cashflow live
- Estimated rent
- $4,846 high interval (Pro) →
- Mortgage (P&I)
- −$1,641
- Tax from tax record
- −$512 /mo · $6,148/yr
- Insurance
- −$130
- Flood insurance flood zone
- −$427 /mo · $5,118/yr
- HOA
- −$34
- Vacancy / Maint / Mgmt
- −$1,018
- Net cashflow
- $1,084
Break-even live
UW: 25.0% down · 7.5% · 30yr · 1.5% tax · 5.0% vac · 8.0% maint · 8.0% mgmt
Financing live
Cash to close
- Down payment
- $78,250
- Closing costs
- $9,390
- Reserves months
- —
- Total cash needed
- —
Loan-product check · same deal, 3 products live
Conventional
25% down · 7.5% · 30yr
- Down + closing
- —
- Monthly P&I
- —
- Monthly cashflow
- —
- DSCR
- —
- Eligible?
- —
Personal DTI + credit; lowest rate.
DSCR
20% down · 8.5% · 30yr
- Down + closing
- —
- Monthly P&I
- —
- Monthly cashflow
- —
- DSCR
- —
- Eligible?
- —
No personal income docs; deal must DSCR.
Hard money
10% down · 12.0% · 12mo
- Down + closing
- —
- Monthly P&I
- —
- Monthly cashflow
- —
- DSCR
- —
- Eligible?
- —
Short-term bridge; refi at stabilization.
Rent comps 22 comps
| Address | Beds | Baths | Sqft | Rent | $/sqft | DOM | Units | Dist |
|---|---|---|---|---|---|---|---|---|
| 17314 Cape Horn Blvd Punta Gorda, FL | 3.0 | 2.0 | 2216 | $2,800 | $1.26 | 13d | 1 | 0.11mi |
| 17434 Oro Ct Punta Gorda, FL | 3.0 | 2.5 | 1864 | $2,000 | $1.07 | 21d | 1 | 0.19mi |
| 24417 Baltic Ave #1102 Punta Gorda, FL | 2.0 | 2.0 | 1788 | $5,250 | $2.94 | 23d | 1 | 0.45mi |
| 4005 Big Pass Ln Punta Gorda, FL | 2.0 | 2.0 | 1423 | $5,500 | $3.87 | 16d | 1 | 0.61mi |
| 17849 Hibiscus Cove Ct #1 Punta Gorda, FL | 3.0 | 2.0 | 1937 | $6,250 | $3.23 | 23d | 1 | 0.80mi |
| 3001 King Tarpon Dr Punta Gorda, FL | 3.0 | 2.0 | 1734 | $5,500 | $3.17 | 23d | 1 | 0.86mi |
| 2091 King Tarpon Dr Punta Gorda, FL | 3.0 | 2.0 | 1640 | $5,200 | $3.17 | 23d | 1 | 0.87mi |
| 1010 Islamorada Blvd Punta Gorda, FL | 3.0 | 2.0 | 1592 | $4,700 | $2.95 | 23d | 1 | 0.94mi |
| 1610 Islamorada Blvd Unit 64A Punta Gorda, FL | 2.0 | 2.0 | 1516 | $2,000 | $1.32 | 23d | 1 | 0.94mi |
| 2060 Matecumbe Key Rd Punta Gorda, FL | 2.0–3.0 | 2.0 | 1271 | $5,400 | $4.25 | 23d | 3 | 0.94mi |
| 3255 Sugarloaf Key Rd Unit 31B Punta Gorda, FL | 2.0 | 2.0 | 1516 | $3,000 | $1.98 | 16d | 1 | 1.00mi |
| 5 Pirates Ln Unit 54B Punta Gorda, FL | 2.0 | 2.0 | 1516 | $4,600 | $3.03 | 23d | 1 | 1.08mi |
| 3471 Sunset Key Cir #102 Punta Gorda, FL | 3.0 | 2.0 | 1991 | $5,750 | $2.89 | 23d | 1 | 1.09mi |
| 3304 Sunset Key Cir Unit D Punta Gorda, FL | 3.0 | 2.0 | 2255 | $5,750 | $2.55 | 23d | 1 | 1.20mi |
| 3313 Sunset Key Cir Punta Gorda, FL | 3.0 | 2.0–3.0 | 2089 | $6,750 | $3.23 | 23d | 4 | 1.24mi |
| 3313 Sunset Key Cir Unit Reservation spot 1 Punta Gorda, FL | 2.0 | 2.0 | 2099 | $2,750 | $1.31 | 23d | 1 | 1.24mi |
| 24378 Belize Ct Punta Gorda, FL | 4.0 | 2.5 | 2251 | $6,750 | $3.00 | 21d | 1 | 1.34mi |
| 3250 Southshore Dr Unit 54B Punta Gorda, FL | 3.0 | 2.0 | 2069 | $5,750 | $2.78 | 23d | 1 | 1.35mi |
| 3270 Southshore Dr Unit 72B Punta Gorda, FL | 3.0 | 2.0 | 2069 | $5,750 | $2.78 | 23d | 1 | 1.36mi |
| 16229 Cape Horn Blvd Punta Gorda, FL | 3.0 | 2.0 | 1726 | $2,749 | $1.59 | 21d | 1 | 1.38mi |
| 3280 Southshore Dr Unit 87A Punta Gorda, FL | 3.0 | 2.0 | 2069 | $4,000 | $1.93 | 23d | 1 | 1.40mi |
| 25377 Doredo Dr Punta Gorda, FL | 4.0 | 3.0 | 2092 | $2,300 | $1.10 | 21d | 1 | 1.50mi |
HOA detail
- Monthly dues
- $34 · $408/yr
Listing history 39 events
-
2026-06-18days on market $313,000 Active 307 DOM
-
2026-06-17days on market $313,000 Active 306 DOM
-
2026-06-16days on market $313,000 Active 305 DOM
-
2026-06-15days on market $313,000 Active 304 DOM
-
2026-06-14days on market $313,000 Active 302 DOM
-
2026-06-13days on market $313,000 Active 301 DOM
-
2026-06-10days on market $313,000 Active 299 DOM
-
2026-06-09days on market $313,000 Active 298 DOM
-
2026-06-08days on market $313,000 Active 297 DOM
-
2026-06-05days on market $313,000 Active 293 DOM
-
2026-06-02days on market $313,000 Active 291 DOM
-
2026-06-01days on market $313,000 Active 290 DOM
-
2026-05-31days on market $313,000 Active 289 DOM
-
2026-05-30days on market $313,000 Active 288 DOM
-
2025-08-15$313,000 Active
-
2025-08-14historical
-
2025-07-29price $313,000
-
2025-07-10price $323,000
-
2025-05-30price $345,000
-
2025-02-23$350,000 Active
-
2025-02-23historical
-
2024-11-13$425,000 Active
-
2024-10-31historical
-
2024-10-02$275,000 Active
-
2022-12-01soldstatus $330,000
-
2022-11-23soldstatus $335,000 Closed
-
2022-10-19status Pending
-
2022-10-07historical
-
2022-09-19status Active
-
2022-09-15status Pending
-
2022-09-02price $369,000
-
2022-08-16price $379,000
-
2022-08-05price $398,000
-
2022-07-24$399,000 Active
-
2007-03-13historical
-
2006-11-02$259,000
-
2006-08-03historical
-
2005-07-12$359,000
-
2004-01-22soldstatus $2,184,000
ⓘ Source: listings_history table (triggers on properties + properties_extension) + one-shot
backfill from property_details.listing_events for pre-trigger history.
Tax reassessment forecast FL · Resets to sale price
- Current annual tax
- $6,148 · $512/mo
- Projected year-2 tax
- $6,148 · $512/mo
- Expected delta
- $0/yr ($0/mo · 0.0%)
ⓘ Screening estimate from a state-policy table — verify with the county assessor before closing.
Climate risk First Street
- Flood 9/10 Extreme FEMA zone AE · 99% chance over 30 yrs
- Wildfire 5/10 Major
- Heat 10/10 Extreme 8 d/yr ≥107°F today · 32 d/yr by 30 yrs out
- Wind 10/10 Extreme 99% chance of damaging wind over 30 yrs
- Air quality 2/10 Low 1 unhealthy d/yr today · 2 by 30 yrs out
Nearby sold comps map
Loading sold comps map…
Walkable amenities ~0.75 mi
Loading nearby amenities…
Taxation est. · year 1
- Rental income
- $58,157
- − Mortgage interest
- −$17,533
- − Property taxes
- −$6,148
- − Insurance
- −$6,684
- − Repairs & maintenance
- −$4,653
- − Management
- −$4,653
- − HOA
- −$408
- − Depreciation
- −$9,105
- Taxable income
- $8,974
- Est. tax owed @ 24.0%
- −$2,154
- After-tax cash flow
- $10,854/yr
For passive investors: Depreciation is non-cash, so a rental often shows a tax loss while cash-flowing — sheltering income. Rental losses are passive: they offset passive income freely, and up to $25,000/yr can offset ordinary (W-2) income if you actively participate and your MAGI is under $100k (phasing out to $0 by $150k); unused losses carry forward. On sale, claimed depreciation is recaptured at up to 25%, and gains may owe capital-gains tax (a 1031 exchange can defer both). Figures are a year-1 estimate at your 24.0% rate — not tax advice; consult a CPA.
Schools (NCES district)
- District
- Charlotte
- NCES district ID
- 1200240
- Math proficiency
- 54% ▼ -6.00%
- Reading proficiency
- 54% ▼ -1.00%
- Median HH income
- $44,864
- Composite
- 45.62/100
- National rank
- #2586
- State rank
- #22 of 73 in FL
Livability — Burnt Store Marina
- Score
- 72/100
- State rank
- #354
- US rank
- #6145
Category grades
Schools grade is shown separately in the Schools card above.
Census & demographics
- County
- Charlotte County · 196,994 people
- Metro
- Punta Gorda, FL
- Population (ZIP)
- 12,399
- Household income
- $76,943
- Rent vs Own
- Severe rent burden
- 226.0
Population outlook (Charlotte County) Hauer SSP2
- Today (2025)
- 198,646 people
- By 2030
- 210,507 · +6.0%
- By 2040
- 230,857 · +16.2%
- By 2050
- 247,148 · +24.4%
- By 2075
- 281,777 · +41.8%
- By 2100
- 293,609 · +47.8%
Race, ethnicity, and origin ACS 2023
- Neighborhood character
- Predominantly White (84%)
- Race & ethnicity
- White 84% Hispanic / Latino 10% Two or more races 9% Black 2%
- Hispanic origin (detail)
- Mexican 4% Puerto Rican 2% Cuban 4%
- Common ancestry
- Romanian 5% Italian 3% Serbian 3%
- Foreign-born
- 8% · Canada
- Languages at home
- 91% English-only · Spanish 5% Other Indo-European 1%
Political lean MEDSL · Charlotte
- 2024 margin
- Solid R (+34.0) · D 32.7% · R 66.7%
- 2008→2024 swing
- -26.7pp toward R · 2008: -7.2pp · 2024: -34.0pp
- All cycles
- 2024: R+34.0 2020: R+26.6 2016: R+27.8 2012: R+14.3 2008: R+7.2
Not yet ingested
- Civics
- —
Market trends
- HPI YoY
- ▼ -78.71%
- Current HPI
- 242.9043
- Rent YoY
- —
- Metro
- Punta Gorda, FL
- State GDP YoY
- ▲ 3.28%
- F500 in state
- 36
Industry mix (Fortune 500 HQ in FL)
| Industry | F500 HQs | Revenue |
|---|---|---|
| Industrial Technology | 2 | $29B |
|
||
| Insurance | 2 | $17B |
|
||
| Retail | 1 | $60B |
|
||
| Technology Distribution | 1 | $58B |
|
||
| Homebuilding | 1 | $35B |
|
||
| Technology Manufacturing | 1 | $35B |
|
||
Price history
-85.7% since first listed25 events — show timeline
- 2025-08-15 Listed $313,000 Stellar MLS as Distributed by MLS Grid
- 2025-08-14 Listing Removed — Stellar MLS as Distributed by MLS Grid
- 2025-07-29 Price Changed $313,000 Stellar MLS as Distributed by MLS Grid
- 2025-07-10 Price Changed $323,000 Stellar MLS as Distributed by MLS Grid
- 2025-05-30 Price Changed $345,000 Stellar MLS as Distributed by MLS Grid
- 2025-02-23 Listing Removed — Stellar MLS as Distributed by MLS Grid
- 2025-02-23 Listed $350,000 Stellar MLS as Distributed by MLS Grid
- 2024-11-13 Listed $425,000 Stellar MLS as Distributed by MLS Grid
- 2024-10-31 Listing Removed — Stellar MLS as Distributed by MLS Grid
- 2024-10-02 Listed $275,000 Stellar MLS as Distributed by MLS Grid
- 2022-12-01 Sold (Public Records) $330,000 Public Records
- 2022-11-23 Sold (MLS) $335,000 Stellar MLS as Distributed by MLS Grid
- 2022-10-19 Pending — Stellar MLS as Distributed by MLS Grid
- 2022-10-07 Listing Removed — Stellar MLS as Distributed by MLS Grid
- 2022-09-19 Relisted — Stellar MLS as Distributed by MLS Grid
- 2022-09-15 Pending — Stellar MLS as Distributed by MLS Grid
- 2022-09-02 Price Changed $369,000 Stellar MLS as Distributed by MLS Grid
- 2022-08-16 Price Changed $379,000 Stellar MLS as Distributed by MLS Grid
- 2022-08-05 Price Changed $398,000 Stellar MLS as Distributed by MLS Grid
- 2022-07-24 Listed $399,000 Stellar MLS as Distributed by MLS Grid
- 2007-03-13 Listing Removed — Stellar MLS as Distributed by MLS Grid
- 2006-11-02 Listed $259,000 Stellar MLS as Distributed by MLS Grid
- 2006-08-03 Listing Removed — Stellar MLS as Distributed by MLS Grid
- 2005-07-12 Listed $359,000 Stellar MLS as Distributed by MLS Grid
- 2004-01-22 Sold (Public Records) $2,184,000 Public Records
Property tax history
+8.8%/yrLatest (2025): $6,148 · -3.2% YoY. Source: county tax records.
Cash-flow waterfall
monthlySold comps — $/sqft
last 12 mo · ≤1 miLoading sold comps…