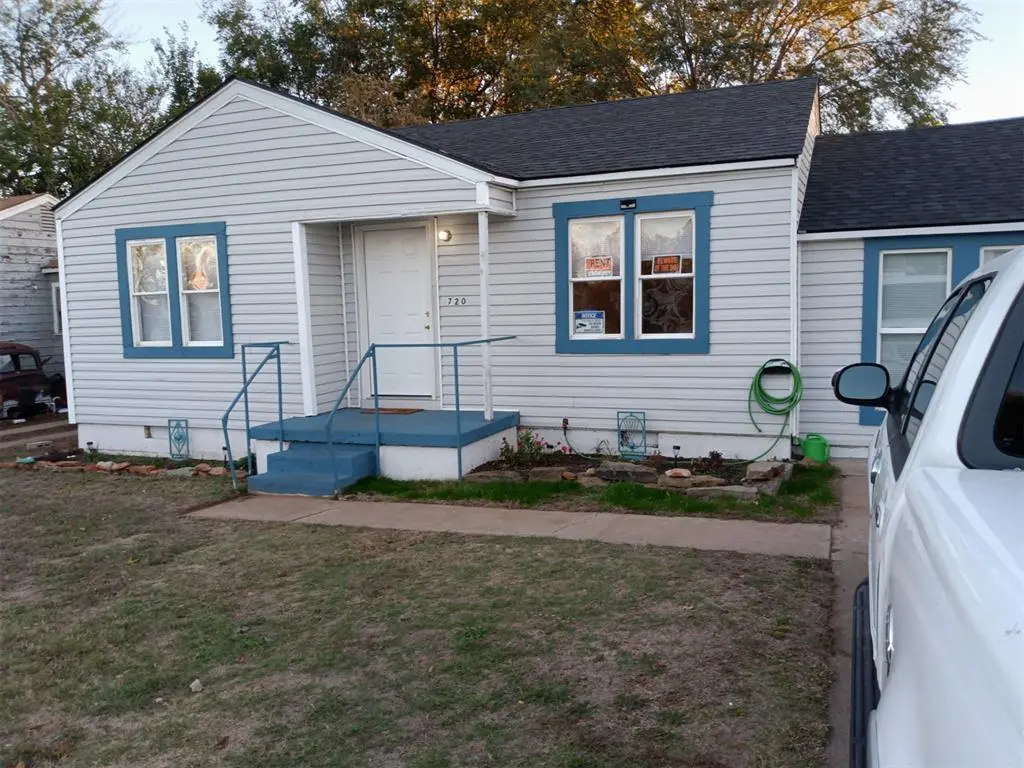
720 W D Ave · Elk City, OK
Flood risk 1/10 · Minimal
- FEMA flood zone
- X (unshaded)
- Chance of flooding over 30 yrs
- 0.0%
- Est. flood insurance / yr
- $507 – $1,088
Fire risk 4/10 · Minor
- Est. fire insurance / yr
- $2,463 – $4,575
Heat risk 6/10 · Moderate
- Hot days now (above 104°F)
- 7 days/yr
- Hot days in 30 yrs
- 20 days/yr
Wind risk 2/10 · Minimal
- Chance of severe wind over 30 yrs
- 2.0%
Air-quality risk 1/10 · Minimal
- Unhealthy air days now
- 0 days/yr
- Unhealthy air days in 30 yrs
- 0 days/yr
Risk factors via First Street. Map © Google.
Why this score? — see what drove the C- grade
The composite is a weighted blend of 9 inputs, each scored 0–100. Each bar is that input's sub-score; the figure is the points it added to the 100-point composite (weight × sub-score).
- Cash flow +25.9/30.0
- DSCR +8.7/10.0
- 1% rule +5.9/10.0
- ARV discount +4.5/15.0
- Livability +3.2/5.0
- Rent growth +2.5/5.0
- Condition / age +2.5/5.0
- Schools +1.3/10.0
- Appreciation +0.0/10.0
$81,000
🖨 Deal sheet 📄 Offer letter ✓ Due diligence
Listing remarks MLS
Seller has never lived in house but filled out disclosures as best they could. "minerals do not pass to buyer but will remain with family.
Key facts
- Spacious lot
- Updated kitchen
- Updated bathroom
Tags
Property features AI
Finance
- Other: Property is currently leased; Occupied
- Financial info: Listing accepts cash, conventional, FHA/VA, or seller financing; Loan qualification possible; Not assumable
- HOA & community: No mandatory association dues
Exterior
- Parking: No parking details provided
- Utilities: Electricity available; Natural gas available; Public water/sewer
- Home design: Single-family residence; One-story; North-facing; Existing property
- Construction: Frame construction; Composition roof; Conventional foundation; Built previously (existing)
- Exterior features: Interior lot
Interior
- Kitchen: Remodeled kitchen
- Bedrooms: 3 bedrooms
- Flooring: Combination of flooring types
- Bathrooms: 2 full bathrooms
- Heating & cooling: Window air conditioning units
- Interior features: Ceiling fans
- Laundry & utility: No storm shelter listed
Neighborhood map
What this means for you Summary
Snapshot
- This is a 2-bed/1.0-bath single-family listed at $81k.
Deal economics
- At list price, monthly cash flow is $199 ($2k/yr) — positive.
- The deal already cash-flows at list — no discount required.
- Meets the 1% rule at list price ($880 rent vs $81k).
- Recommended offer: $79k (3.0% below list) — sets the bar for market timing.
- Cap rate 9.2% vs local median 4.1% in Elk City — top-decile yield for the area; either an underpriced asset or a hidden risk that comps aren't pricing in. Stress-test before assuming the spread holds.
Location & tenants
- Location reads 65/100 on livability (#141 in OK) — a middle-class / working-renter tenant base. Strengths: cost of living A+, housing A, crime B+; Watch: employment D+, amenities F, commute F.
- Elk City (town): math 14% / reading 15% proficiency, ranked #218 of 270 in OK (top 81%) — low school quality limits family demand, transient renter base, plan for 1-2y turnover.
- Zoned schools: Elk City Es (math 22% / reading 17%, grade F, #479 of 845 statewide, top 63%, 753 students, 0% FRL); Elk City Hs (math 8% / reading 22%, grade F, #332 of 447 statewide, top 78%, 615 students, 0% FRL) — zoned schools average 0% FRL vs 48% district-wide (48 pts lower); this property's tenant base skews higher-income than the district average.
- Market conditions: 122 active listings in the ZIP; 16 units permitted in Beckham County in 2024 (0 in 5+ unit buildings).
Forward outlook
- Local home prices are declining (-3.0%/yr); year-one equity from $560 of loan paydown is wiped out by about $2k of value loss. Plan a longer hold.
- Beckham County population projected at +35% by 2050 — long-run rental-demand tailwind backs the buy-and-hold thesis.
Negotiation context
- It's been on market 58 days — a 3% lower offer ($79k) is reasonable based on typical stale-listing flexibility.
- 6 sale attempts since 4y ago; this cycle's ask has dropped $7k (8%) from the opening price — seller is motivated, your offer sets the floor, not the list.
- Current owner paid $15k; list at $81k implies a 440% gain — meaningful room to come down on a strong offer.
Risks & watch-outs
- Watch-outs: built in 1950 — expect roof / HVAC / electrical / plumbing capex.
- Climate carrying-cost: extreme-heat days projected 7→20/yr by 2055 (HVAC capex compounding) — expect insurance premiums to compound above CPI over the hold.
Questions for the listing agent
- It's been on market 58 days. Have you received any prior offers? Is the seller open to a 3% concession, seller financing, or rate buy-down credit?
- Built in 1950 — when were the roof, HVAC, electrical panel, plumbing, and water heater last replaced?
- Is there a deadline driving the sale (1031 exchange, divorce, estate, relocation)? That informs how much negotiation room exists.
- Schools are F-rated, which usually means shorter tenancies and higher turnover. Who's the typical renter profile here, and what's been the actual vacancy rate?
- What's the average days-on-market for RENTAL listings here right now (not sales)? A rising rental-DOM trend means longer vacancies and softer asking-rent achievability than the comps imply.
- What's the recent tenant-quality profile in this submarket — average credit score on applications, eviction rate, late-payment / NSF rate, and stable-employment percentage? A property-management company in the area should have these aggregated.
- How much new for-sale + rental construction is in the pipeline within 1–3 miles? Heavy new supply typically softens prices + rents 12–24 months out; constrained supply supports both.
Investment metrics
- 1% rule
- 1.09% ✓
- Cap rate
- 9.24%
- Cash-on-cash
- 10.51%
- DSCR
- 1.47
- GRM
- 7.7
CMA / ARV
- ARV (on-the-fly)
- $75,998
- Comps found
- 12
Show comp detail 12 sales within ~0.75 mi
| Address | Dist | Beds/Ba | Sqft | Sold | Price | $/sf | Match |
|---|---|---|---|---|---|---|---|
| 906 Halsey Dr | 0.15mi | 3/1.0 (+1) | 970 (+1%) | 12mo | $92,000 | $95 | 77 |
| 415 Eisenhower Blvd | 0.24mi | 3/1.0 (+1) | 1,012 (+5%) | 1mo | $97,000 | $96 | 74 |
| 1401 W 2nd St | 0.53mi | 2/1.0 | 986 (+2%) | 1mo | $41,000 | $42 | 70 |
| 420 N Howard Ave | 0.25mi | 3/1.0 (+1) | 1,008 (+5%) | 10mo | $18,500 | $18 | 67 |
| 1010 N Washington Ave | 0.33mi | 2/1.0 | 900 (-6%) | 15mo | $115,000 | $128 | 62 |
| 116 Blackburn Blvd | 0.68mi | 2/1.0 | 936 (-3%) | 13mo | $55,000 | $59 | 53 |
| 1403 W Broadway Ave | 0.63mi | 3/1.0 (+1) | 1,008 (+5%) | 10mo | $80,000 | $79 | 50 |
| 1219 Crestview Dr | 0.50mi | 2/1.0 | 1,102 (+15%) | 4mo | $70,000 | $64 | 49 |
| 311 W 1st St | 0.36mi | 2/1.0 | 1,096 (+14%) | 16mo | $66,000 | $60 | 46 |
| 150 Herring Dr | 0.69mi | 3/1.5 (+1) | 926 (-4%) | 11mo | $99,900 | $108 | 45 |
| 127 Sunset St | 0.68mi | 3/1.0 (+1) | 1,060 (+10%) | 16mo | $131,900 | $124 | 33 |
| 211 S Boone Ave | 0.56mi | 3/2.0 (+1) | 1,084 (+13%) | 15mo | $40,000 | $37 | 31 |
Match score weights: distance 35% · size 25% · config 20% · recency 20%. Top-matched comps best support the ARV.
Projected returns pro-forma
-3.0% appreciation · 3.0% rent growth · sell at horizon
- IRR
- -0.6%
- Equity multiple
- 0.98×
- Total profit
- $-497
- Equity at exit
- $12,077
- IRR
- 9.1%
- Equity multiple
- 1.69×
- Total profit
- $15,757
- Equity at exit
- $7,003
Cash invested: $22,680 (down + closing). Projections, not guarantees.
Landlord ↔ Tenant lean methodology
- Overall (STATE)
- 83 Strongly Landlord-Friendly
- State Oklahoma
- 83 Strongly Landlord-Friendly · R+20
- County
- — inherits STATE
- City
- — inherits STATE
ZIP-level market 73644
- Home prices YoY
- -24.0%
- Active inventory
- 122
- Price-to-rent
- 7.7×
Monthly cashflow live
- Estimated rent
- $880 medium interval (Pro) →
- Mortgage (P&I)
- −$425
- Tax from tax record
- −$38 /mo · $454/yr
- Insurance
- −$34
- HOA
- −$0
- Vacancy / Maint / Mgmt
- −$185
- Net cashflow
- $199
Break-even live
UW: 25.0% down · 7.5% · 30yr · 1.5% tax · 5.0% vac · 8.0% maint · 8.0% mgmt
Financing live
Cash to close
- Down payment
- $20,250
- Closing costs
- $2,430
- Reserves months
- —
- Total cash needed
- —
Loan-product check · same deal, 3 products live
Conventional
25% down · 7.5% · 30yr
- Down + closing
- —
- Monthly P&I
- —
- Monthly cashflow
- —
- DSCR
- —
- Eligible?
- —
Personal DTI + credit; lowest rate.
DSCR
20% down · 8.5% · 30yr
- Down + closing
- —
- Monthly P&I
- —
- Monthly cashflow
- —
- DSCR
- —
- Eligible?
- —
No personal income docs; deal must DSCR.
Hard money
10% down · 12.0% · 12mo
- Down + closing
- —
- Monthly P&I
- —
- Monthly cashflow
- —
- DSCR
- —
- Eligible?
- —
Short-term bridge; refi at stabilization.
Listing history 29 events
-
2026-06-18days on market $81,000 Active 58 DOM
-
2026-06-17days on market $81,000 Active 57 DOM
-
2026-06-16days on market $81,000 Active 56 DOM
-
2026-06-15days on market $81,000 Active 55 DOM
-
2026-06-13days on market $81,000 Active 53 DOM
-
2026-06-12days on market $81,000 Active 52 DOM
-
2026-06-09days on market $81,000 Active 49 DOM
-
2026-06-08days on market $81,000 Active 48 DOM
-
2026-06-08days on market $81,000 Active 47 DOM
-
2026-06-07days on market $81,000 Active 46 DOM
-
2026-06-04days on market $81,000 Active 43 DOM
-
2026-06-02pricedays on market $81,000 Active 42 DOM
-
2026-06-01days on market $85,000 Active 41 DOM
-
2026-05-31days on market $85,000 Active 40 DOM
-
2026-05-03price $85,000
-
2026-05-03status Active
-
2026-04-20status Pending
-
2026-04-08$88,000 Active
-
2023-09-08status Pending 144-char remark
Show marketing remark (144 chars)
Seller has never lived in house but filled out disclosures as best they could. "minerals do not pass to buyer but will remain with family.
-
2023-09-08soldstatus $15,000 Closed 144-char remark
Show marketing remark (144 chars)
Seller has never lived in house but filled out disclosures as best they could. "minerals do not pass to buyer but will remain with family.
-
2023-08-31status Active 144-char remark
Show marketing remark (144 chars)
Seller has never lived in house but filled out disclosures as best they could. "minerals do not pass to buyer but will remain with family.
-
2023-08-07historical 144-char remark
Show marketing remark (144 chars)
Seller has never lived in house but filled out disclosures as best they could. "minerals do not pass to buyer but will remain with family.
-
2023-08-01status Pending 144-char remark
Show marketing remark (144 chars)
Seller has never lived in house but filled out disclosures as best they could. "minerals do not pass to buyer but will remain with family.
-
2023-02-24status Active 144-char remark
Show marketing remark (144 chars)
Seller has never lived in house but filled out disclosures as best they could. "minerals do not pass to buyer but will remain with family.
-
2023-02-15status Pending 144-char remark
Show marketing remark (144 chars)
Seller has never lived in house but filled out disclosures as best they could. "minerals do not pass to buyer but will remain with family.
-
2023-01-12$27,500 Active 144-char remark
Show marketing remark (144 chars)
Seller has never lived in house but filled out disclosures as best they could. "minerals do not pass to buyer but will remain with family.
-
2022-11-29historical
-
2022-01-20$35,000 Active
-
1998-10-13soldstatus $15,000
ⓘ Source: listings_history table (triggers on properties + properties_extension) + one-shot
backfill from property_details.listing_events for pre-trigger history.
Tax reassessment forecast OK · Resets to sale price
- Current annual tax
- $454 · $38/mo
- Projected year-2 tax
- $729 · $61/mo
- Expected delta
- +$275/yr (+$23/mo · 60.6%)
ⓘ Screening estimate from a state-policy table — verify with the county assessor before closing.
Climate risk First Street
- Flood 1/10 Low FEMA zone X (unshaded) · 0% chance over 30 yrs
- Wildfire 4/10 Moderate
- Heat 6/10 Major 7 d/yr ≥104°F today · 20 d/yr by 30 yrs out
- Wind 2/10 Low 2% chance of damaging wind over 30 yrs
- Air quality 1/10 Low 0 unhealthy d/yr today · 0 by 30 yrs out
Nearby sold comps map
Loading sold comps map…
Walkable amenities ~0.75 mi
Loading nearby amenities…
Taxation est. · year 1
- Rental income
- $10,557
- − Mortgage interest
- −$4,537
- − Property taxes
- −$454
- − Insurance
- −$405
- − Repairs & maintenance
- −$845
- − Management
- −$845
- − Depreciation
- −$2,356
- Taxable income
- $1,116
- Est. tax owed @ 24.0%
- −$268
- After-tax cash flow
- $2,116/yr
For passive investors: Depreciation is non-cash, so a rental often shows a tax loss while cash-flowing — sheltering income. Rental losses are passive: they offset passive income freely, and up to $25,000/yr can offset ordinary (W-2) income if you actively participate and your MAGI is under $100k (phasing out to $0 by $150k); unused losses carry forward. On sale, claimed depreciation is recaptured at up to 25%, and gains may owe capital-gains tax (a 1031 exchange can defer both). Figures are a year-1 estimate at your 24.0% rate — not tax advice; consult a CPA.
Schools (NCES district)
- District
- Elk City
- NCES district ID
- 4010740
- Math proficiency
- 14% ▼ -11.00%
- Reading proficiency
- 15% ▼ -14.00%
- Median HH income
- $49,040
- Composite
- 13.26/100
- National rank
- #9547
- State rank
- #218 of 270 in OK
Livability — Elk City
- Score
- 65/100
- State rank
- #141
- US rank
- #13090
Category grades
Schools grade is shown separately in the Schools card above.
Census & demographics
- Census place
- Elk City, OK
- City population
- 13,687
- Population (ZIP)
- 13,687
Population outlook (Beckham County) Hauer SSP2
- Today (2025)
- 26,564 people
- By 2030
- 28,217 · +6.2%
- By 2040
- 31,865 · +20.0%
- By 2050
- 35,862 · +35.0%
- By 2075
- 47,189 · +77.6%
- By 2100
- 55,622 · +109.4%
Race, ethnicity, and origin ACS 2023
- Neighborhood character
- Predominantly White (80%)
- Race & ethnicity
- White 80% Hispanic / Latino 15% Two or more races 6% Black 1% Asian 1%
- Hispanic origin (detail)
- Mexican 13%
- Common ancestry
- Iranian 2% Lithuanian 2% Italian 2%
- Foreign-born
- 4% · Canada, China
- Languages at home
- 89% English-only · Spanish 10%
Political lean MEDSL · Beckham
- 2024 margin
- Solid R (+70.1) · D 14.2% · R 84.3% · Other 1.4%
- 2008→2024 swing
- -14.0pp toward R · 2008: -56.1pp · 2024: -70.1pp
- All cycles
- 2024: R+70.1 2020: R+72.0 2016: R+70.8 2012: R+59.1 2008: R+56.1
Not yet ingested
- Civics
- —
Market trends
- HPI YoY
- ▼ -56.11%
- Current HPI
- 178.0217
- Rent YoY
- —
- Metro
- —
- State GDP YoY
- ▲ 1.55%
- F500 in state
- 6
Industry mix (Fortune 500 HQ in OK)
| Industry | F500 HQs | Revenue |
|---|---|---|
| Energy | 3 | $48B |
|
||
Price history
+466.7% since first listed15 events — show timeline
- 2026-05-03 Price Changed $85,000 MLSOK
- 2026-05-03 Relisted — MLSOK
- 2026-04-20 Pending — MLSOK
- 2026-04-08 Listed $88,000 MLSOK
- 2023-09-08 Pending — MLSOK
- 2023-09-08 Sold (MLS) $15,000 MLSOK
- 2023-08-31 Relisted — MLSOK
- 2023-08-07 Listing Removed — MLSOK
- 2023-08-01 Pending — MLSOK
- 2023-02-24 Relisted — MLSOK
- 2023-02-15 Pending — MLSOK
- 2023-01-12 Listed $27,500 MLSOK
- 2022-11-29 Listing Removed — MLSOK
- 2022-01-20 Listed $35,000 MLSOK
- 1998-10-13 Sold (Public Records) $15,000 Public Records
Property tax history
+12.4%/yrLatest (2025): $454 · -1.5% YoY. Source: county tax records.
Cash-flow waterfall
monthlySold comps — $/sqft
last 12 mo · ≤1 miLoading sold comps…