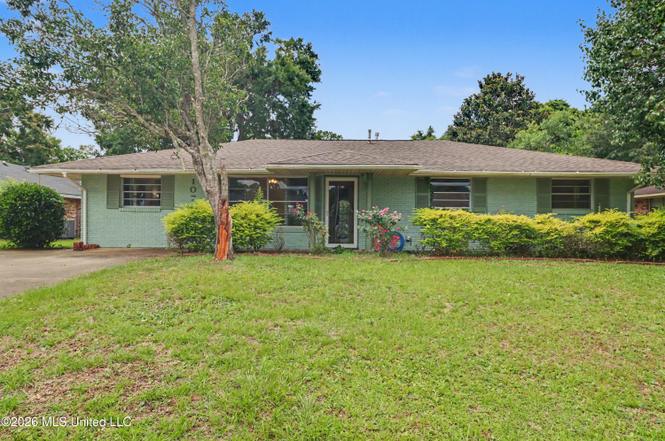
107 Vance Pl · Long Beach, MS
Flood risk 1/10 · Minimal
- FEMA flood zone
- X (unshaded)
- Chance of flooding over 30 yrs
- 0.0%
- Est. flood insurance / yr
- $507 – $1,088
Fire risk 2/10 · Minimal
- Est. fire insurance / yr
- $1,241 – $2,305
Heat risk 10/10 · Severe
- Hot days now (above 106°F)
- 7 days/yr
- Hot days in 30 yrs
- 24 days/yr
Wind risk 9/10 · Severe
- Chance of severe wind over 30 yrs
- 99.0%
Air-quality risk 1/10 · Minimal
- Unhealthy air days now
- 0 days/yr
- Unhealthy air days in 30 yrs
- 0 days/yr
Risk factors via First Street. Map © Google.
Why this score? — see what drove the D+ grade
The composite is a weighted blend of 9 inputs, each scored 0–100. Each bar is that input's sub-score; the figure is the points it added to the 100-point composite (weight × sub-score).
- ARV discount +15.0/15.0
- Cash flow +12.8/30.0
- Schools +4.4/10.0
- DSCR +3.8/10.0
- 1% rule +3.6/10.0
- Livability +3.5/5.0
- Rent growth +3.0/5.0
- Condition / age +2.5/5.0
- Appreciation +0.0/10.0
$215,000
🖨 Deal sheet (PDF) 📄 Offer letter ✓ Due diligence
Listing remarks MLS
GREEN ACRES UNDER $130,000!!! Cute, older home in one of Long Beach's favorite neighborhoods. Family friendly, walking distance to Reeves Elementary School. This home is neat and clean with nice shade trees. Inside, you will find a large living / great room with large windows and lots of natural light. The galley style kitchen overlooks another family / dinning room with french doors overlooking the back yard. There are 3 spacious bedrooms and 2 baths. All hard surface floors... ceramic tile or laminate. Central Air / Heat system is 2 years old. Large interior laundry room. In the back yard, there is a nice shed / workshop with power. Just a few minutes to the beach. Easy access to anywhere via Railroad to Beatline or to beautiful downtown Long Beach.
Key facts
- Spacious living area
- 0.26 acre lot
- Built 1969
Tags
Property features AI
Exterior
- Parking: Driveway; On-street parking
- Utilities: Public water; Public sewer; Electricity available; Natural gas available
- Home design: Single-family house; One level; Brick veneer construction; Architectural shingle roof; Slab foundation
- Construction: Built (year source: public records)
- Exterior features: Patio; Porch; Private yard; Rain gutters; Chain link fencing; Fenced lot; Curbs; Near entertainment
Interior
- Kitchen: Dishwasher; Disposal; Microwave; Oven; Refrigerator
- Flooring: Ceramic tile; Laminate
- Bathrooms: 2 bathrooms
- Heating & cooling: Central heating (natural gas); Central air conditioning (electric)
- Interior features: Ceiling fans; French doors
Neighborhood map
What this means for you Summary
Snapshot
- This is a 3-bed/2.0-bath single-family listed at $215k.
Deal economics
- At list price, monthly cash flow is $-21 ($-257/yr) — negative.
- To cash-flow at today's rent, offer at most $212k (1.4% below list).
- To meet the 1% rule (rent ≥ 1% of price), the offer needs to be $185k (13.8% below list).
- Recommended offer: $185k (13.8% below list) — sets the bar for 1% rule.
- Cap rate 6.2% vs local median 4.7% in Long Beach — top-decile yield for the area; either an underpriced asset or a hidden risk that comps aren't pricing in. Stress-test before assuming the spread holds.
Location & tenants
- Location reads 69/100 on livability (#52 in MS) — a middle-class / working-renter tenant base. Strengths: crime A+, cost of living A+, housing A+; Watch: amenities F, commute F, health & safety F.
- Long Beach School District (suburban): math 52% / reading 50% proficiency, ranked #9 of 130 in MS (top 7%) — acceptable for families but not a draw, mixed tenant base, ~2y average lease.
- Zoned schools: Thomas L Reeves Elementary School (math 37% / reading 52%, grade F, #92 of 375 statewide, top 26%, 431 students, 99% FRL); Long Beach Middle School (math 65% / reading 52%, grade B, #10 of 179 statewide, top 5%, 453 students, 99% FRL); Long Beach Senior High School (math 22% / reading 47%, grade F, #68 of 197 statewide, top 39%, 932 students, 100% FRL) — zoned schools average 99% FRL vs 43% district-wide (57 pts higher); higher-poverty schools than district average — tighter screening recommended.
- Market conditions: Rents rising (+1.9%/yr); 311 active listings in the ZIP; 10 comparable units currently listed for rent nearby; rentals at typical pace (median 16d on market — plan ~3-4 weeks tenant-placement turnaround); 2,194 units permitted in Harrison County in 2024 (0 in 5+ unit buildings).
- This rent runs 32% of the median local income ($70k/yr) — at the standard rent-burdened threshold; future hikes will face affordability resistance.
Forward outlook
- Local home prices are declining (-3.0%/yr); year-one equity from $1k of loan paydown is wiped out by about $6k of value loss. Plan a longer hold.
- Harrison County population projected at +27% by 2050 — long-run rental-demand tailwind backs the buy-and-hold thesis.
Negotiation context
- Only 11 days on market — expect competitive offers; lowballing is unlikely to land.
- 2 sale attempts since 7y ago with the ask held roughly flat each time — persistent listings suggest the price (not the market) is what's stuck; bring a comps-based counter.
Risks & watch-outs
- Climate carrying-cost: severe wind risk, 99% chance of damaging wind over 30y; extreme-heat days projected 7→24/yr by 2055 (HVAC capex compounding) — expect insurance premiums to compound above CPI over the hold.
Questions for the listing agent
- What do current leases actually rent for vs. the listed asking? Can we see a recent rent roll and the last 12 months of T-12 income?
- Built in 1969 — when were the roof, HVAC, electrical panel, plumbing, and water heater last replaced?
- Is there a deadline driving the sale (1031 exchange, divorce, estate, relocation)? That informs how much negotiation room exists.
- Schools are B-rated — typically a magnet for longer-tenancy family renters. What's the average tenant stay here, and is there a school-zone premium baked into asking?
- The area grade is low — what's the realistic commute time and amenity access for the typical tenant pool here? Any planned neighborhood developments (good or bad) we should know about?
- What's the average days-on-market for RENTAL listings here right now (not sales)? A rising rental-DOM trend means longer vacancies and softer asking-rent achievability than the comps imply.
- What's the recent tenant-quality profile in this submarket — average credit score on applications, eviction rate, late-payment / NSF rate, and stable-employment percentage? A property-management company in the area should have these aggregated.
- How much new for-sale + rental construction is in the pipeline within 1–3 miles? Heavy new supply typically softens prices + rents 12–24 months out; constrained supply supports both.
Investment metrics
- 1% rule
- 0.86% ✗
- Cap rate
- 6.17%
- Cash-on-cash
- -0.43%
- DSCR
- 0.98
- GRM
- 9.7
CMA / ARV
- ARV (on-the-fly)
- $283,920
- Comps found
- 12
Show comp detail 12 sales within ~0.75 mi
| Address | Dist | Beds/Ba | Sqft | Sold | Price | $/sf | Match |
|---|---|---|---|---|---|---|---|
| 205 Alyce Pl | 0.10mi | 3/2.0 | 1,435 (-1%) | 3mo | $164,900 | $115 | 91 |
| 208 Saint Augustine Dr | 0.11mi | 3/2.0 | 1,336 (-8%) | 14mo | $220,000 | $165 | 69 |
| 210 S Seashore Ave | 0.32mi | 3/2.0 | 1,392 (-4%) | 14mo | $339,750 | $244 | 66 |
| 2003 W 2nd St | 0.50mi | 3/2.0 | 1,382 (-5%) | 10mo | $299,900 | $217 | 60 |
| 134 Markham Dr | 0.44mi | 3/2.0 | 1,311 (-10%) | 7mo | $400,000 | $305 | 57 |
| 112 S Island View Ave | 0.64mi | 3/2.0 | 1,431 (-2%) | 18mo | $279,000 | $195 | 52 |
| 129 Markham Dr | 0.49mi | 3/2.0 | 1,627 (+12%) | 9mo | $476,500 | $293 | 50 |
| 313 Twin Lakes Blvd | 0.46mi | 3/2.0 | 1,271 (-13%) | 14mo | $205,000 | $161 | 46 |
| 115 S Island View Ave | 0.67mi | 2/2.0 (-1) | 1,500 (+3%) | 17mo | $249,900 | $167 | 45 |
| 162 Holiday | 0.68mi | 4/2.0 (+1) | 1,532 (+5%) | 12mo | $298,000 | $195 | 44 |
| 114 Olson Ave | 0.73mi | 4/3.0 (+1) | 1,600 (+10%) | 7mo | $259,000 | $162 | 35 |
| 211 Lantana Blvd | 0.62mi | 3/2.0 | 1,258 (-14%) | 17mo | $194,900 | $155 | 34 |
Match score weights: distance 35% · size 25% · config 20% · recency 20%. Top-matched comps best support the ARV.
Projected returns pro-forma
-3.0% appreciation · 1.93% rent growth · sell at horizon
- IRR
- -18.2%
- Equity multiple
- 0.37×
- Total profit
- $-38,150
- Equity at exit
- $32,057
- IRR
- -12.7%
- Equity multiple
- 0.29×
- Total profit
- $-42,794
- Equity at exit
- $18,589
Cash invested: $60,200 (down + closing). Projections, not guarantees.
Landlord ↔ Tenant lean methodology
- Overall (STATE)
- 90 Strongly Landlord-Friendly
- State Mississippi
- 90 Strongly Landlord-Friendly · R+11
- County
- — inherits STATE
- City
- — inherits STATE
ZIP-level market 39560
- Home prices YoY
- -25.7%
- Rents YoY
- 1.9%
- Active inventory
- 311
- Price-to-rent
- 9.7×
Monthly cashflow live
- Estimated rent
- $1,854 high interval (Pro) →
- Mortgage (P&I)
- −$1,127
- Tax est. 1.5%
- −$269 /mo · $3,225/yr
- Insurance
- −$90
- HOA
- −$0
- Vacancy / Maint / Mgmt
- −$389
- Net cashflow
- $-21
Break-even live
Sensitivity live
| Price | -10% $127 | -5% $53 | +0% $-21 | +5% $-96 | +10% $-170 |
|---|---|---|---|---|---|
| Rent | -10% $-168 | -5% $-95 | +0% $-21 | +5% $52 | +10% $125 |
| Rate | -1.0pp $87 | -0.5pp $33 | base $-21 | +0.5pp $-77 | +1.0pp $-134 |
UW: 25.0% down · 7.5% · 30yr · 1.5% tax · 5.0% vac · 8.0% maint · 8.0% mgmt
Financing live
Cash to close
- Down payment
- $53,750
- Closing costs
- $6,450
- Reserves months
- —
- Total cash needed
- —
Loan-product check · same deal, 3 products live
Conventional
25% down · 7.5% · 30yr
- Down + closing
- —
- Monthly P&I
- —
- Monthly cashflow
- —
- DSCR
- —
- Eligible?
- —
Personal DTI + credit; lowest rate.
DSCR
20% down · 8.5% · 30yr
- Down + closing
- —
- Monthly P&I
- —
- Monthly cashflow
- —
- DSCR
- —
- Eligible?
- —
No personal income docs; deal must DSCR.
Hard money
10% down · 12.0% · 12mo
- Down + closing
- —
- Monthly P&I
- —
- Monthly cashflow
- —
- DSCR
- —
- Eligible?
- —
Short-term bridge; refi at stabilization.
Rent comps 10 comps
| Address | Beds | Baths | Sqft | Rent | $/sqft | DOM | Units | Dist |
|---|---|---|---|---|---|---|---|---|
| 1000 Arbor Station Dr Long Beach, MS | 1.0–3.0 | 1.0–2.0 | 1281 | $1,669 | $1.30 | 13d | 1 | 0.42mi |
| 500 E Marigold Dr Long Beach, MS | 4.0 | 2.0 | 1800 | $2,300 | $1.28 | 15d | 1 | 0.45mi |
| 303 Twin Lakes Blvd Long Beach, MS | 3.0 | 2.0 | 1233 | $2,000 | $1.62 | 15d | 1 | 0.55mi |
| 2012 W Second St Long Beach, MS | 1.0–3.0 | 1.0–2.0 | 1125 | $1,550 | $1.38 | 4d | 17 | 0.73mi |
| 7 Oak Alley Ln Long Beach, MS | 2.0 | 2.5 | 1520 | $2,600 | $1.71 | 15d | 1 | 0.78mi |
| 4401 Beatline Rd Long Beach, MS | 2.0 | 2.0 | 1098 | $1,267 | $1.15 | 22d | 1 | 0.85mi |
| 4401 Beatline Rd Long Beach, MS | 2.0 | 2.0 | 1098 | $1,156 | $1.05 | 45d | 1 | 0.85mi |
| 4401 Beatline Rd Long Beach, MS | 2.0 | 2.0 | 1098 | $1,366 | $1.24 | 15d | 1 | 0.85mi |
| 1033 Enclave Cir Long Beach, MS | 4.0 | 2.0 | 1791 | $2,250 | $1.26 | 22d | 1 | 0.95mi |
| 105 Eleanor Ave Pass Christian, MS | 2.0 | 2.0 | 1535 | $2,400 | $1.56 | 5d | 1 | 1.27mi |
Listing history 8 events
-
2026-06-22days on market $215,000 Active 11 DOM
-
2026-06-18days on market $215,000 Active 8 DOM
-
2026-06-17days on market $215,000 Active 7 DOM
-
2026-06-16days on market $215,000 Active 6 DOM
-
2026-06-15days on market $215,000 Active 5 DOM
-
2026-06-14days on market $215,000 Active 3 DOM
-
2026-06-13remarks 699-char remark
-
2026-06-13$215,000 Active 2 DOM
ⓘ Source: listings_history table (triggers on properties + properties_extension) + one-shot
backfill from property_details.listing_events for pre-trigger history.
Climate risk First Street
- Flood 1/10 Low FEMA zone X (unshaded) · 0% chance over 30 yrs
- Wildfire 2/10 Low
- Heat 10/10 Extreme 7 d/yr ≥106°F today · 24 d/yr by 30 yrs out
- Wind 9/10 Extreme 99% chance of damaging wind over 30 yrs
- Air quality 1/10 Low 0 unhealthy d/yr today · 0 by 30 yrs out
Nearby sold comps map
Loading sold comps map…
Walkable amenities ~0.75 mi
Loading nearby amenities…
Taxation est. · year 1
- Rental income
- $22,244
- − Mortgage interest
- −$12,043
- − Property taxes
- −$3,225
- − Insurance
- −$1,075
- − Repairs & maintenance
- −$1,780
- − Management
- −$1,780
- − Depreciation
- −$6,255
- Taxable loss
- −$3,913
- Est. tax savings @ 24.0%
- +$939
- After-tax cash flow
- $682/yr
For passive investors: Depreciation is non-cash, so a rental often shows a tax loss while cash-flowing — sheltering income. Rental losses are passive: they offset passive income freely, and up to $25,000/yr can offset ordinary (W-2) income if you actively participate and your MAGI is under $100k (phasing out to $0 by $150k); unused losses carry forward. On sale, claimed depreciation is recaptured at up to 25%, and gains may owe capital-gains tax (a 1031 exchange can defer both). Figures are a year-1 estimate at your 24.0% rate — not tax advice; consult a CPA.
Schools (NCES district)
- District
- Long Beach School District
- NCES district ID
- 2802670
- Math proficiency
- 52% ▼ -8.00%
- Reading proficiency
- 50% ▼ -7.00%
- Median HH income
- $50,548
- Composite
- 43.68/100
- National rank
- #2955
- State rank
- #9 of 130 in MS
Livability — Long Beach
- Score
- 69/100
- State rank
- #52
- US rank
- #8554
Category grades
Schools grade is shown separately in the Schools card above.
Census & demographics
- Census place
- Long Beach, MS
- County
- Harrison County · 178,171 people
- City population
- 18,702
- Metro
- Gulfport-Biloxi, MS
- Population (ZIP)
- 18,702
- Household income
- $69,769
- Rent vs Own
- Severe rent burden
- 658.0
Population outlook (Harrison County) Hauer SSP2
- Today (2025)
- 228,444 people
- By 2030
- 241,942 · +5.9%
- By 2040
- 267,531 · +17.1%
- By 2050
- 291,062 · +27.4%
- By 2075
- 346,711 · +51.8%
- By 2100
- 378,165 · +65.5%
Race, ethnicity, and origin ACS 2023
- Neighborhood character
- Predominantly White (80%)
- Race & ethnicity
- White 80% Black 10% Two or more races 7% Hispanic / Latino 3% Asian 2%
- Common ancestry
- Lithuanian 6% Slovak 2% Serbian 1%
- Foreign-born
- 5% · Canada, South Korea
- Languages at home
- 94% English-only · Spanish 2% Other Indo-European 2% Tagalog/Filipino 1%
Political lean MEDSL · Harrison
- 2024 margin
- Strong R (+28.9) · D 35.0% · R 63.9% · Other 1.1%
- 2008→2024 swing
- -2.9pp toward R · 2008: -26.0pp · 2024: -28.9pp
- All cycles
- 2024: R+28.9 2020: R+25.2 2016: R+30.7 2012: R+26.6 2008: R+26.0
Not yet ingested
- Civics
- —
Market trends
- HPI YoY
- ▼ -67.49%
- Current HPI
- 195.0807
- Rent YoY
- ▲ 1.93%
- Metro
- Gulfport-Biloxi, MS
- State GDP YoY
- —
- F500 in state
- 0
Price history
+66.7% since first listed5 events — show timeline
- 2026-06-09 Listed $215,000 MLSU
- 2020-01-08 Sold (Public Records) — Public Records
- 2020-01-07 Sold (MLS) — MLSU
- 2019-10-02 Listed $129,000 MLSU
- 2012-08-17 Sold (Public Records) — Public Records
Property tax history
+17.1%/yrLatest (2025): $170 · +0.7% YoY. Source: county tax records.
Cash-flow waterfall
monthlySold comps — $/sqft
last 12 mo · ≤1 miLoading sold comps…