8740 Francis Lewis Blvd · New York, NY
Flood risk 1/10 · Minimal
- FEMA flood zone
- X (unshaded)
- Chance of flooding over 30 yrs
- 0.0%
- Est. flood insurance / yr
- $507 – $1,088
Fire risk 1/10 · Minimal
- Est. fire insurance / yr
- $691 – $1,283
Heat risk 6/10 · Moderate
- Hot days now (above 97°F)
- 7 days/yr
- Hot days in 30 yrs
- 14 days/yr
Wind risk 6/10 · Moderate
- Chance of severe wind over 30 yrs
- 54.0%
Air-quality risk 4/10 · Minor
- Unhealthy air days now
- 6 days/yr
- Unhealthy air days in 30 yrs
- 6 days/yr
Risk factors via First Street. Map © Google.
Why this score? — see what drove the F grade
The composite is a weighted blend of 9 inputs, each scored 0–100. Each bar is that input's sub-score; the figure is the points it added to the 100-point composite (weight × sub-score).
- 1% rule +9.7/10.0
- ARV discount +7.5/15.0
- Schools +5.0/10.0
- Livability +3.8/5.0
- Rent growth +2.5/5.0
- Condition / age +2.5/5.0
- Cash flow +0.0/30.0
- DSCR +0.0/10.0
- Appreciation +0.0/10.0
$174,000
🖨 Deal sheet (PDF) 📄 Offer letter ✓ Due diligence
Listing remarks
Fantastic one bedroom apartment in the heart of Queens Village. Steps away from multiple bus lines this apartment is a commuters dream. Located on the 6th floor of an elevator building, this apartment affords you the peace and quiet while providing you access to all the neighborhood has to offer. As you enter, you will step into a large open dining room/ living. This apartment has large closets for storage. Cook like a chef in the recently updated kitchen with granite counters and new appliances. This apartment also has a nice sized bedroom and bathroom.
Key facts
- New appliances
- Granite counters
- Elevator building
Tags
Property features AI
Exterior
- Home design: Built in 1953
- Exterior features: Located in the Queens Village subdivision
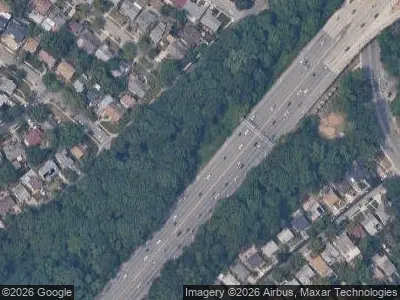
Neighborhood map
What this means for you Summary
Snapshot
- This is a 1-bed/1.0-bath condo listed at $174k.
Deal economics
- At list price, monthly cash flow is $-224k ($-2.69M/yr) — negative.
- The deal already cash-flows at list — no discount required.
- Meets the 1% rule at list price ($3k rent vs $174k).
- Recommended offer: $171k (1.5% below list) — sets the bar for market timing.
- Cap rate -1540.4% vs local median 2.6% in New York — below-typical yield; the buyer is paying a premium for something (appreciation thesis, condition, location) that the cap rate doesn't capture.
Location & tenants
- Location reads 75/100 on livability (#268 in NY, #4,188 nationally) — a middle-class / working-renter tenant base. Strengths: amenities A+, commute A+, health & safety A; Watch: crime F, cost of living F.
- Market conditions: 115 active listings in the ZIP; solid renter incomes; 5,302 units permitted in Queens County in 2024 (4,918 in 5+ unit buildings).
- This rent runs 35% of the median local income ($89k/yr) — at the standard rent-burdened threshold; future hikes will face affordability resistance.
Forward outlook
- Local home prices are declining (-3.0%/yr); year-one equity from $1k of loan paydown is wiped out by about $5k of value loss. Plan a longer hold.
- Queens County population projected at +16% by 2050 — long-run rental-demand tailwind backs the buy-and-hold thesis.
Negotiation context
- It's been on market 26 days — a 2% lower offer ($171k) is reasonable based on typical stale-listing flexibility.
Risks & watch-outs
- Watch-outs: HOA is 8788% of rent; built in 1953 — expect roof / HVAC / electrical / plumbing capex.
- Climate carrying-cost: major wind risk, 54% chance of damaging wind over 30y; extreme-heat days projected 7→14/yr by 2055 (HVAC capex compounding) — expect insurance premiums to compound above CPI over the hold.
Questions for the listing agent
- What do current leases actually rent for vs. the listed asking? Can we see a recent rent roll and the last 12 months of T-12 income?
- Built in 1953 — when were the roof, HVAC, electrical panel, plumbing, and water heater last replaced?
- What does the HOA fee cover, when was the last increase, and are there any pending special assessments or reserve-fund shortfalls?
- Any open or pending special assessments — roof, HVAC, plumbing, elevator, façade? What's the per-unit balance and payoff schedule, and is the seller paying it off at close or rolling it to the buyer?
- Is there a deadline driving the sale (1031 exchange, divorce, estate, relocation)? That informs how much negotiation room exists.
- Schools are B-rated — typically a magnet for longer-tenancy family renters. What's the average tenant stay here, and is there a school-zone premium baked into asking?
- Crime grade is F in this area — have there been break-ins, vandalism, or insurance claims at this property in the last 3 years? What carrier currently insures it and at what premium?
- The area grade is low — what's the realistic commute time and amenity access for the typical tenant pool here? Any planned neighborhood developments (good or bad) we should know about?
- What's the average days-on-market for RENTAL listings here right now (not sales)? A rising rental-DOM trend means longer vacancies and softer asking-rent achievability than the comps imply.
- What's the recent tenant-quality profile in this submarket — average credit score on applications, eviction rate, late-payment / NSF rate, and stable-employment percentage? A property-management company in the area should have these aggregated.
- How much new apartment / multifamily construction is in the pipeline within 1–3 miles? Heavy new supply (>2% of stock underway) typically softens rents 12–24 months out; light construction supports rent growth.
Investment metrics
- 1% rule
- 1.47% ✓
- Cap rate
- -1540.43%
- Cash-on-cash
- -5524.01%
- DSCR
- -244.79
- GRM
- 5.7
CMA / ARV
No comps found within radius.
Projected returns pro-forma
-3.0% appreciation · 3.0% rent growth · sell at horizon
- IRR
- —
- Equity multiple
- -289.93×
- Total profit
- $-14,174,010
- Equity at exit
- $25,944
- IRR
- —
- Equity multiple
- -618.33×
- Total profit
- $-30,173,535
- Equity at exit
- $15,044
Cash invested: $48,720 (down + closing). Projections, not guarantees.
Landlord ↔ Tenant lean methodology
- Overall (CITY)
- 0 Strongly Tenant-Friendly
- State New York
- 15 Strongly Tenant-Friendly · D+10
- County
- — inherits STATE
- City New York
- 0 Strongly Tenant-Friendly · D+34
ZIP-level market 11427
- Active inventory
- 115
- Price-to-rent
- 5.7×
Monthly cashflow live
- Estimated rent
- $2,561 medium interval (Pro) →
- Mortgage (P&I)
- −$912
- Tax est. 1.5%
- −$218 /mo · $2,610/yr
- Insurance
- −$72
- HOA est. from 1 same-building comp
- −$225,096
- Vacancy / Maint / Mgmt
- −$538
- Net cashflow
- $-224,275
Break-even live
Sensitivity live
| Price | -10% $-224,155 | -5% $-224,215 | +0% $-224,275 | +5% $-224,335 | +10% $-224,395 |
|---|---|---|---|---|---|
| Rent | -10% $-224,477 | -5% $-224,376 | +0% $-224,275 | +5% $-224,174 | +10% $-224,073 |
| Rate | -1.0pp $-224,187 | -0.5pp $-224,231 | base $-224,275 | +0.5pp $-224,320 | +1.0pp $-224,366 |
UW: 25.0% down · 7.5% · 30yr · 1.5% tax · 5.0% vac · 8.0% maint · 8.0% mgmt
Financing live
Cash to close
- Down payment
- $43,500
- Closing costs
- $5,220
- Reserves months
- —
- Total cash needed
- —
Loan-product check · same deal, 3 products live
Conventional
25% down · 7.5% · 30yr
- Down + closing
- —
- Monthly P&I
- —
- Monthly cashflow
- —
- DSCR
- —
- Eligible?
- —
Personal DTI + credit; lowest rate.
DSCR
20% down · 8.5% · 30yr
- Down + closing
- —
- Monthly P&I
- —
- Monthly cashflow
- —
- DSCR
- —
- Eligible?
- —
No personal income docs; deal must DSCR.
Hard money
10% down · 12.0% · 12mo
- Down + closing
- —
- Monthly P&I
- —
- Monthly cashflow
- —
- DSCR
- —
- Eligible?
- —
Short-term bridge; refi at stabilization.
HOA detail condo
- Monthly dues
- $0 · $0/yr
- Assessments
- None detected in remarks — confirm with the listing agent.
Listing history 11 events
-
2026-06-21days on market $174,000 Active 26 DOM
-
2026-06-18days on market $174,000 Active 23 DOM
-
2026-06-17days on market $174,000 Active 22 DOM
-
2026-06-15days on market $174,000 Active 20 DOM
-
2026-06-13days on market $174,000 Active 18 DOM
-
2026-06-10days on market $174,000 Active 14 DOM
-
2026-06-08days on market $174,000 Active 13 DOM
-
2026-06-03days on market $174,000 Active 8 DOM
-
2026-06-01days on market $174,000 Active 6 DOM
-
2026-05-31remarks 561-char remark
-
2026-05-31$174,000 Active 5 DOM
ⓘ Source: listings_history table (triggers on properties + properties_extension) + one-shot
backfill from property_details.listing_events for pre-trigger history.
Climate risk First Street
- Flood 1/10 Low FEMA zone X (unshaded) · 0% chance over 30 yrs
- Wildfire 1/10 Low
- Heat 6/10 Major 7 d/yr ≥97°F today · 14 d/yr by 30 yrs out
- Wind 6/10 Major 54% chance of damaging wind over 30 yrs
- Air quality 4/10 Moderate 6 unhealthy d/yr today · 6 by 30 yrs out
Nearby sold comps map
Loading sold comps map…
Walkable amenities ~0.75 mi
Loading nearby amenities…
Taxation est. · year 1
- Rental income
- $30,736
- − Mortgage interest
- −$9,747
- − Property taxes
- −$2,610
- − Insurance
- −$870
- − Repairs & maintenance
- −$2,459
- − Management
- −$2,459
- − HOA
- −$2,701,152
- − Depreciation
- −$5,062
- Taxable loss
- −$2,693,622
- Est. tax savings @ 24.0%
- +$646,469
- After-tax cash flow
- $-2,044,831/yr
For passive investors: Depreciation is non-cash, so a rental often shows a tax loss while cash-flowing — sheltering income. Rental losses are passive: they offset passive income freely, and up to $25,000/yr can offset ordinary (W-2) income if you actively participate and your MAGI is under $100k (phasing out to $0 by $150k); unused losses carry forward. On sale, claimed depreciation is recaptured at up to 25%, and gains may owe capital-gains tax (a 1031 exchange can defer both). Figures are a year-1 estimate at your 24.0% rate — not tax advice; consult a CPA.
Schools (NCES district)
No district data.
Livability — New York
- Score
- 75/100
- State rank
- #268
- US rank
- #4188
Category grades
Schools grade is shown separately in the Schools card above.
Census & demographics
- Census place
- New York, NY
- County
- Queens County · 1,914,869 people
- City population
- 7,731,280
- Metro
- New York-Newark-Jersey City, NY-NJ-PA
- Population (ZIP)
- 24,607
- Household income
- $88,980
- Rent vs Own
- Severe rent burden
- 811.0
Population outlook (Queens County) Hauer SSP2
- Today (2025)
- 2,546,320 people
- By 2030
- 2,643,059 · +3.8%
- By 2040
- 2,815,563 · +10.6%
- By 2050
- 2,944,423 · +15.6%
- By 2075
- 3,123,338 · +22.7%
- By 2100
- 3,098,688 · +21.7%
Race, ethnicity, and origin ACS 2023
- Neighborhood character
- Highly diverse neighborhood (Simpson 0.77)
- Race & ethnicity
- Asian 37% Black 22% Hispanic / Latino 17% White 14% Two or more races 11%
- Hispanic origin (detail)
- Puerto Rican 3% Dominican 2%
- Common ancestry
- Hispanic 5% Scotch-Irish 2% Romanian 1%
- Foreign-born
- 51% · Canada, China, Jamaica
- Languages at home
- 49% English-only · Other Indo-European 16% Spanish 14% Tagalog/Filipino 5%
Political lean MEDSL · Queens
- 2024 margin
- Strong D (+24.6) · D 62.3% · R 37.7%
- 2008→2024 swing
- -26.2pp toward R · 2008: 50.8pp · 2024: 24.6pp
- All cycles
- 2024: D+24.6 2020: D+45.2 2016: D+53.4 2012: D+58.5 2008: D+50.8
Not yet ingested
- Civics
- —
Market trends
- HPI YoY
- ▼ -436.66%
- Current HPI
- 297.7969
- Rent YoY
- —
- Metro
- New York-Newark-Jersey City, NY-NJ-PA
- State GDP YoY
- ▲ 2.60%
- F500 in state
- 92
Industry mix (Fortune 500 HQ in NY)
| Industry | F500 HQs | Revenue |
|---|---|---|
| Financial Services | 10 | $950B |
|
||
| Consumer Goods | 9 | $162B |
|
||
| Insurance | 4 | $225B |
|
||
| Telecommunications | 2 | $144B |
|
||
| Pharmaceuticals | 2 | $112B |
|
||
| Media / Entertainment | 2 | $69B |
|
||
Price history
1 event — show timeline
- 2026-05-26 Listed $174,000 FSBO.com
Property tax history
+1.6%/yrLatest (2025): $503,869 · +1.6% YoY. Source: county tax records.
Cash-flow waterfall
monthlySold comps — $/sqft
last 12 mo · ≤1 miLoading sold comps…