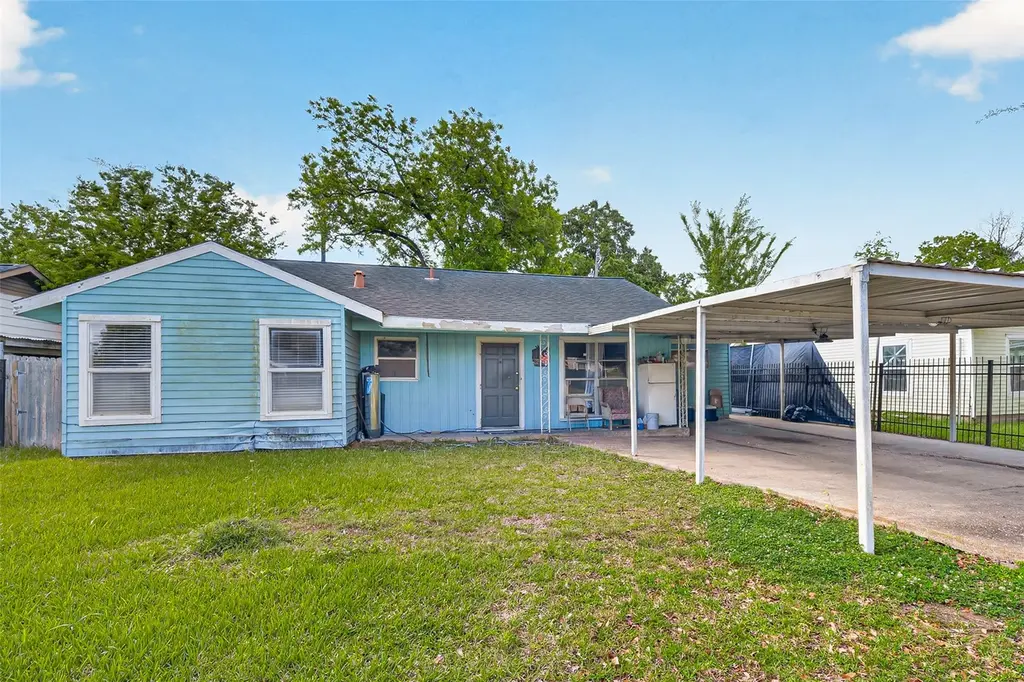
919 Christine St · Houston, TX
Flood risk 5/10 · Moderate
- FEMA flood zone
- X (unshaded)
- Chance of flooding over 30 yrs
- 0.24%
- Est. flood insurance / yr
- $507 – $1,088
Fire risk 1/10 · Minimal
- Est. fire insurance / yr
- $1,222 – $2,270
Heat risk 9/10 · Severe
- Hot days now (above 109°F)
- 6 days/yr
- Hot days in 30 yrs
- 18 days/yr
Wind risk 9/10 · Severe
- Chance of severe wind over 30 yrs
- 99.0%
Air-quality risk 2/10 · Minimal
- Unhealthy air days now
- 2 days/yr
- Unhealthy air days in 30 yrs
- 2 days/yr
Risk factors via First Street. Map © Google.
Why this score? — see what drove the D grade
The composite is a weighted blend of 9 inputs, each scored 0–100. Each bar is that input's sub-score; the figure is the points it added to the 100-point composite (weight × sub-score).
- ARV discount +12.1/15.0
- Cash flow +11.6/30.0
- 1% rule +3.8/10.0
- Livability +3.7/5.0
- DSCR +3.4/10.0
- Rent growth +2.7/5.0
- Schools +2.7/10.0
- Condition / age +2.5/5.0
- Appreciation +0.0/10.0
$175,000
🖨 Deal sheet (PDF) 📄 Offer letter ✓ Due diligence
Listing remarks
Charming Fixer-Upper with Big Potential – Perfect for Owners & Investors Alike! Welcome to 919 Christine St, a wonderful opportunity nestled in an established Houston neighborhood. Whether you're looking to put down roots and build sweat equity or add a value-add property to your portfolio, this home checks all the boxes. Priced to reflect condition — bring your contractor and your creativity! Sold AS-IS. Cash, conventional.
Key facts
- 6,599 sq ft lot
- 2 parking spots
- Built 1952
Property features AI
Exterior
- Parking: Attached carport; Carport with 2 spaces
- Utilities: Public water; Public sewer
- Home design: Residential property; Built in 1952; Slab foundation
- Construction: Aluminum siding; Vinyl siding; Composition roof
- Exterior features: Subdivision lot
Interior
- Bedrooms: Three bedrooms on the first floor; Primary bedroom on the first floor
- Bathrooms: One full bathroom on the first floor
- Heating & cooling: Central heating (electric); Central air conditioning (electric)
- Interior features: Total of 4 rooms
Neighborhood map
What this means for you Summary
Snapshot
- This is a 3-bed/1.0-bath single-family listed at $175k.
Deal economics
- At list price, monthly cash flow is $-53 ($-638/yr) — negative.
- To cash-flow at today's rent, offer at most $166k (5.4% below list).
- To meet the 1% rule (rent ≥ 1% of price), the offer needs to be $154k (12.3% below list).
- Recommended offer: $154k (12.3% below list) — sets the bar for 1% rule.
- Cap rate 5.9% vs local median 3.2% in Houston — top-decile yield for the area; either an underpriced asset or a hidden risk that comps aren't pricing in. Stress-test before assuming the spread holds.
Location & tenants
- Location reads 74/100 on livability (#184 in TX, #4,771 nationally) — a middle-class / working-renter tenant base. Strengths: amenities A+, cost of living A+, housing A+; Watch: crime F.
- Houston ISD (urban): math 27% / reading 35% proficiency, ranked #593 of 826 in TX (top 72%) — families likely to look elsewhere, expect single-tenant / working-renter base with shorter leases; 71% free/reduced lunch — lower-income household profile, screen leases tightly.
- Zoned schools: Rucker El (math 12% / reading 17%, grade F, #4,048 of 4,322 statewide, top 95%, 394 students, 96% FRL); Stevenson Middle (math 22% / reading 35%, grade F, #1,122 of 1,662 statewide, top 69%, 1,192 students, 92% FRL); Chavez H S (math 26% / reading 26%, grade F, #1,234 of 1,632 statewide, top 76%, 2,272 students, 93% FRL) — zoned schools average 94% FRL vs 71% district-wide (23 pts higher); higher-poverty schools than district average — tighter screening recommended.
- Market conditions: Rents flat; 88 active listings in the ZIP; 12 comparable units currently listed for rent nearby; rentals leasing fast (median 13d on market — plan ~1-2 weeks tenant-placement turnaround); 29,883 units permitted in Harris County in 2024 (8,621 in 5+ unit buildings).
- This rent runs 36% of the median local income ($51k/yr) — at the standard rent-burdened threshold; future hikes will face affordability resistance.
Forward outlook
- Local home prices are declining (-3.0%/yr); year-one equity from $1k of loan paydown is wiped out by about $5k of value loss. Plan a longer hold.
- Harris County population projected at +47% by 2050 — long-run rental-demand tailwind backs the buy-and-hold thesis.
Negotiation context
- It's been on market 37 days — a 3% lower offer ($170k) is reasonable based on typical stale-listing flexibility.
Risks & watch-outs
- Watch-outs: built in 1952 — expect roof / HVAC / electrical / plumbing capex.
- Climate carrying-cost: moderate flood risk; severe wind risk, 99% chance of damaging wind over 30y; extreme-heat days projected 6→18/yr by 2055 (HVAC capex compounding) — expect insurance premiums to compound above CPI over the hold.
Questions for the listing agent
- What do current leases actually rent for vs. the listed asking? Can we see a recent rent roll and the last 12 months of T-12 income?
- It's been on market 37 days. Have you received any prior offers? Is the seller open to a 12% concession, seller financing, or rate buy-down credit?
- Built in 1952 — when were the roof, HVAC, electrical panel, plumbing, and water heater last replaced?
- Is there a deadline driving the sale (1031 exchange, divorce, estate, relocation)? That informs how much negotiation room exists.
- Schools are D-rated, which usually means shorter tenancies and higher turnover. Who's the typical renter profile here, and what's been the actual vacancy rate?
- Crime grade is F in this area — have there been break-ins, vandalism, or insurance claims at this property in the last 3 years? What carrier currently insures it and at what premium?
- The area grade is low — what's the realistic commute time and amenity access for the typical tenant pool here? Any planned neighborhood developments (good or bad) we should know about?
- What's the average days-on-market for RENTAL listings here right now (not sales)? A rising rental-DOM trend means longer vacancies and softer asking-rent achievability than the comps imply.
- What's the recent tenant-quality profile in this submarket — average credit score on applications, eviction rate, late-payment / NSF rate, and stable-employment percentage? A property-management company in the area should have these aggregated.
- How much new for-sale + rental construction is in the pipeline within 1–3 miles? Heavy new supply typically softens prices + rents 12–24 months out; constrained supply supports both.
Investment metrics
- 1% rule
- 0.88% ✗
- Cap rate
- 5.93%
- Cash-on-cash
- -1.30%
- DSCR
- 0.94
- GRM
- 9.5
CMA / ARV
- ARV (median comp)
- $195,153
- List price
- $175,000
- Delta
- -10.33%
- Verdict
- UNDERPRICED
- Comps
- 20 within 1.0 mi
Show comp detail 12 sales within ~0.75 mi
| Address | Dist | Beds/Ba | Sqft | Sold | Price | $/sf | Match |
|---|---|---|---|---|---|---|---|
| 919 Oak Meadows St | 0.12mi | 3/1.0 | 1,218 (-3%) | 0mo | $195,500 | $161 | 89 |
| 1106 Aubert St | 0.14mi | 3/2.0 | 1,290 (+3%) | 6mo | $215,000 | $167 | 80 |
| 1114 Maroby St | 0.20mi | 3/1.0 | 1,200 (-4%) | 7mo | $215,000 | $179 | 78 |
| 306 Ogilvie St | 0.33mi | 3/1.0 | 1,310 (+4%) | 7mo | $209,000 | $160 | 72 |
| 907 Axilda St | 0.22mi | 3/1.0 | 1,172 (-7%) | 10mo | $139,882 | $119 | 70 |
| 5403 Primrose St | 0.39mi | 4/1.0 (+1) | 1,269 (+1%) | 6mo | $190,000 | $150 | 70 |
| 214 Axilda St | 0.43mi | 3/1.0 | 1,203 (-4%) | 6mo | $228,000 | $190 | 68 |
| 1308 Pecan Dr | 0.73mi | 3/1.0 | 1,256 (+0%) | 2mo | $120,000 | $96 | 64 |
| 4921 Michael Dr | 0.44mi | 3/1.0 | 1,140 (-9%) | 8mo | $179,900 | $158 | 57 |
| 8850 Howard Dr | 0.42mi | 2/1.5 (-1) | 1,072 (-15%) | 4mo | $299,900 | $280 | 46 |
| 1206 Gober St | 0.40mi | 3/2.0 | 1,415 (+13%) | 12mo | $233,900 | $165 | 46 |
| 5611 Woodlark St | 0.61mi | 2/1.0 (-1) | 1,137 (-9%) | 11mo | $75,000 | $66 | 41 |
Match score weights: distance 35% · size 25% · config 20% · recency 20%. Top-matched comps best support the ARV.
Projected returns pro-forma
-3.0% appreciation · 0.88% rent growth · sell at horizon
- IRR
- -20.9%
- Equity multiple
- 0.29×
- Total profit
- $-34,894
- Equity at exit
- $26,093
- IRR
- -20.3%
- Equity multiple
- 0.04×
- Total profit
- $-47,123
- Equity at exit
- $15,131
Cash invested: $49,000 (down + closing). Projections, not guarantees.
Landlord ↔ Tenant lean methodology
- Overall (STATE)
- 87 Strongly Landlord-Friendly
- State Texas
- 87 Strongly Landlord-Friendly · R+5
- County
- — inherits STATE
- City
- — inherits STATE
ZIP-level market 77017
- Home prices YoY
- -21.7%
- Rents YoY
- 0.9%
- Active inventory
- 88
- Price-to-rent
- 9.5×
Monthly cashflow live
- Estimated rent
- $1,536 high interval (Pro) →
- Mortgage (P&I)
- −$918
- Tax from tax record
- −$276 /mo · $3,307/yr
- Insurance
- −$73
- HOA
- −$0
- Vacancy / Maint / Mgmt
- −$322
- Net cashflow
- $-53
Break-even live
Sensitivity live
| Price | -10% $46 | -5% $-4 | +0% $-53 | +5% $-103 | +10% $-152 |
|---|---|---|---|---|---|
| Rent | -10% $-174 | -5% $-114 | +0% $-53 | +5% $7 | +10% $68 |
| Rate | -1.0pp $35 | -0.5pp $-9 | base $-53 | +0.5pp $-99 | +1.0pp $-145 |
UW: 25.0% down · 7.5% · 30yr · 1.5% tax · 5.0% vac · 8.0% maint · 8.0% mgmt
Financing live
Cash to close
- Down payment
- $43,750
- Closing costs
- $5,250
- Reserves months
- —
- Total cash needed
- —
Loan-product check · same deal, 3 products live
Conventional
25% down · 7.5% · 30yr
- Down + closing
- —
- Monthly P&I
- —
- Monthly cashflow
- —
- DSCR
- —
- Eligible?
- —
Personal DTI + credit; lowest rate.
DSCR
20% down · 8.5% · 30yr
- Down + closing
- —
- Monthly P&I
- —
- Monthly cashflow
- —
- DSCR
- —
- Eligible?
- —
No personal income docs; deal must DSCR.
Hard money
10% down · 12.0% · 12mo
- Down + closing
- —
- Monthly P&I
- —
- Monthly cashflow
- —
- DSCR
- —
- Eligible?
- —
Short-term bridge; refi at stabilization.
Rent comps 12 comps
| Address | Beds | Baths | Sqft | Rent | $/sqft | DOM | Units | Dist |
|---|---|---|---|---|---|---|---|---|
| 1514 Allen Genoa Rd Houston, TX | 1.0–2.0 | 1.0–2.0 | 846 | $1,715 | $2.03 | 3d | 24 | 0.65mi |
| 4921 Barkley St Houston, TX | 3.0 | 2.0 | 1502 | $1,900 | $1.26 | 21d | 1 | 0.68mi |
| 4806 Allendale Rd Houston, TX | 2.0 | 2.0 | 1322 | $1,152 | $0.87 | 45d | 1 | 0.88mi |
| 4800 Allendale Rd Unit 2162 Houston, TX | 2.0 | 2.0 | 1322 | $1,349 | $1.02 | 7d | 1 | 0.90mi |
| 4800 Allendale Rd Unit 2165 Houston, TX | 2.0 | 2.0 | 1322 | $1,333 | $1.01 | 0d | 1 | 0.90mi |
| 4800 Allendale Rd Unit 425 Houston, TX | 2.0 | 2.0 | 1322 | $1,349 | $1.02 | 9d | 1 | 0.90mi |
| 4800 Allendale Rd Unit 4857 Houston, TX | 2.0 | 2.0 | 1322 | $1,373 | $1.04 | 12d | 1 | 0.90mi |
| 4800 Allendale Rd Unit 2047 Houston, TX | 2.0 | 2.0 | 1322 | $1,384 | $1.05 | 12d | 1 | 0.92mi |
| 4206 E Villa St Houston, TX | 3.0 | 1.0 | 1190 | $1,845 | $1.55 | 16d | 1 | 1.10mi |
| 5535 Timber Creek Place Dr Houston, TX | 1.0–2.0 | 1.0–2.0 | 757 | $1,214 | $1.60 | 4d | 18 | 1.26mi |
| 2810 Forest Oaks Blvd Houston, TX | 4.0 | 2.0 | 1280 | $1,675 | $1.31 | 46d | 1 | 1.43mi |
| 1009 Richey St Pasadena, TX | 1.0–3.0 | 1.0–2.0 | 885 | $1,499 | $1.69 | 0d | 24 | 1.47mi |
Listing history 15 events
-
2026-06-21days on market $175,000 Active 37 DOM
-
2026-06-18days on market $175,000 Active 34 DOM
-
2026-06-17days on market $175,000 Active 33 DOM
-
2026-06-16days on market $175,000 Active 32 DOM
-
2026-06-15days on market $175,000 Active 31 DOM
-
2026-06-13days on market $175,000 Active 29 DOM
-
2026-06-10days on market $175,000 Active 25 DOM
-
2026-06-08days on market $175,000 Active 24 DOM
-
2026-06-07pricedays on market $175,000 Active 23 DOM
-
2026-06-04days on market $190,000 Active 20 DOM
-
2026-06-01days on market $190,000 Active 17 DOM
-
2026-05-31days on market $190,000 Active 16 DOM
-
2026-05-16$190,000 Active 445-char remark
-
2026-05-13historical $190,000 445-char remark
-
2000-04-19soldstatus
ⓘ Source: listings_history table (triggers on properties + properties_extension) + one-shot
backfill from property_details.listing_events for pre-trigger history.
Tax reassessment forecast TX · Resets to sale price
- Current annual tax
- $3,307 · $276/mo
- Projected year-2 tax
- $3,307 · $276/mo
- Expected delta
- $0/yr ($0/mo · 0.0%)
ⓘ Screening estimate from a state-policy table — verify with the county assessor before closing.
Climate risk First Street
- Flood 5/10 Major FEMA zone X (unshaded) · 24% chance over 30 yrs
- Wildfire 1/10 Low
- Heat 9/10 Extreme 6 d/yr ≥109°F today · 18 d/yr by 30 yrs out
- Wind 9/10 Extreme 99% chance of damaging wind over 30 yrs
- Air quality 2/10 Low 2 unhealthy d/yr today · 2 by 30 yrs out
Nearby sold comps map
Loading sold comps map…
Walkable amenities ~0.75 mi
Loading nearby amenities…
Taxation est. · year 1
- Rental income
- $18,426
- − Mortgage interest
- −$9,803
- − Property taxes
- −$3,307
- − Insurance
- −$875
- − Repairs & maintenance
- −$1,474
- − Management
- −$1,474
- − Depreciation
- −$5,091
- Taxable loss
- −$3,598
- Est. tax savings @ 24.0%
- +$863
- After-tax cash flow
- $225/yr
For passive investors: Depreciation is non-cash, so a rental often shows a tax loss while cash-flowing — sheltering income. Rental losses are passive: they offset passive income freely, and up to $25,000/yr can offset ordinary (W-2) income if you actively participate and your MAGI is under $100k (phasing out to $0 by $150k); unused losses carry forward. On sale, claimed depreciation is recaptured at up to 25%, and gains may owe capital-gains tax (a 1031 exchange can defer both). Figures are a year-1 estimate at your 24.0% rate — not tax advice; consult a CPA.
Schools (NCES district)
- District
- Houston ISD
- NCES district ID
- 4823640
- Math proficiency
- 27% ▼ -18.00%
- Reading proficiency
- 35% ▼ -6.00%
- Median HH income
- $46,054
- Composite
- 26.63/100
- National rank
- #7173
- State rank
- #593 of 826 in TX
Livability — Houston
- Score
- 74/100
- State rank
- #184
- US rank
- #4771
Category grades
Schools grade is shown separately in the Schools card above.
Census & demographics
- Census place
- Houston, TX
- County
- Harris County · 4,702,590 people
- City population
- 3,226,434
- Metro
- Houston-The Woodlands-Sugar Land, TX
- Population (ZIP)
- 29,640
- Household income
- $51,079
- Rent vs Own
- Severe rent burden
- 1601.0
Population outlook (Harris County) Hauer SSP2
- Today (2025)
- 5,571,493 people
- By 2030
- 6,089,821 · +9.3%
- By 2040
- 7,142,806 · +28.2%
- By 2050
- 8,185,864 · +46.9%
- By 2075
- 10,574,329 · +89.8%
- By 2100
- 12,109,958 · +117.4%
Race, ethnicity, and origin ACS 2023
- Neighborhood character
- Predominantly Hispanic (81%)
- Race & ethnicity
- Hispanic / Latino 81% Two or more races 38% White 7% Black 6% Asian 4%
- Hispanic origin (detail)
- Mexican 65%
- Common ancestry
- Lithuanian 1%
- Foreign-born
- 39% · Canada, Vietnam
- Languages at home
- 32% English-only · Spanish 63% Vietnamese 4%
Political lean MEDSL · Harris
- 2024 margin
- Lean D (+5.5) · D 52.0% · R 46.4% · Other 1.6%
- 2008→2024 swing
- +3.9pp toward D · 2008: 1.6pp · 2024: 5.5pp
- All cycles
- 2024: D+5.5 2020: D+13.3 2016: D+12.4 2012: D+0.1 2008: D+1.6
Not yet ingested
- Civics
- —
Market trends
- HPI YoY
- ▼ -76.86%
- Current HPI
- 277.3656
- Rent YoY
- ▲ 0.88%
- Metro
- Houston-The Woodlands-Sugar Land, TX
- State GDP YoY
- ▲ 3.95%
- F500 in state
- 110
Industry mix (Fortune 500 HQ in TX)
| Industry | F500 HQs | Revenue |
|---|---|---|
| Energy | 16 | $1,198B |
|
||
| Technology | 5 | $198B |
|
||
| Engineering / Construction | 4 | $72B |
|
||
| Energy Services | 3 | $60B |
|
||
| Utilities | 3 | $41B |
|
||
| Healthcare | 2 | $330B |
|
||
Price history
-7.9% since first listed4 events — show timeline
- 2026-06-06 Price Changed $175,000 HARMLS
- 2026-05-16 Listed $190,000 HARMLS
- 2026-05-13 Coming Soon $190,000 HARMLS
- 2000-04-19 Sold (Public Records) — Public Records
Property tax history
+2.3%/yrLatest (2025): $3,307 · +7.9% YoY. Source: county tax records.
Cash-flow waterfall
monthlySold comps — $/sqft
last 12 mo · ≤1 miLoading sold comps…