1222 S Bluffview Ave · Farmington, NM
Flood risk 1/10 · Minimal
- FEMA flood zone
- X (unshaded)
- Chance of flooding over 30 yrs
- 0.0%
- Est. flood insurance / yr
- $507 – $1,088
Fire risk 3/10 · Minor
- Est. fire insurance / yr
- $706 – $1,312
Heat risk 4/10 · Minor
- Hot days now (above 93°F)
- 7 days/yr
- Hot days in 30 yrs
- 18 days/yr
Wind risk 1/10 · Minimal
- Chance of severe wind over 30 yrs
- —
Air-quality risk 2/10 · Minimal
- Unhealthy air days now
- 0 days/yr
- Unhealthy air days in 30 yrs
- 1 days/yr
Risk factors via First Street. Map © Google.
Why this score? — see what drove the D grade
The composite is a weighted blend of 9 inputs, each scored 0–100. Each bar is that input's sub-score; the figure is the points it added to the 100-point composite (weight × sub-score).
- Cash flow +15.7/30.0
- ARV discount +7.5/15.0
- DSCR +4.8/10.0
- Rent growth +3.8/5.0
- Livability +3.3/5.0
- Schools +3.2/10.0
- 1% rule +2.9/10.0
- Condition / age +2.5/5.0
- Appreciation +0.0/10.0
$165,000
🖨 Deal sheet (PDF) 📄 Offer letter ✓ Due diligence
Listing remarks MLS
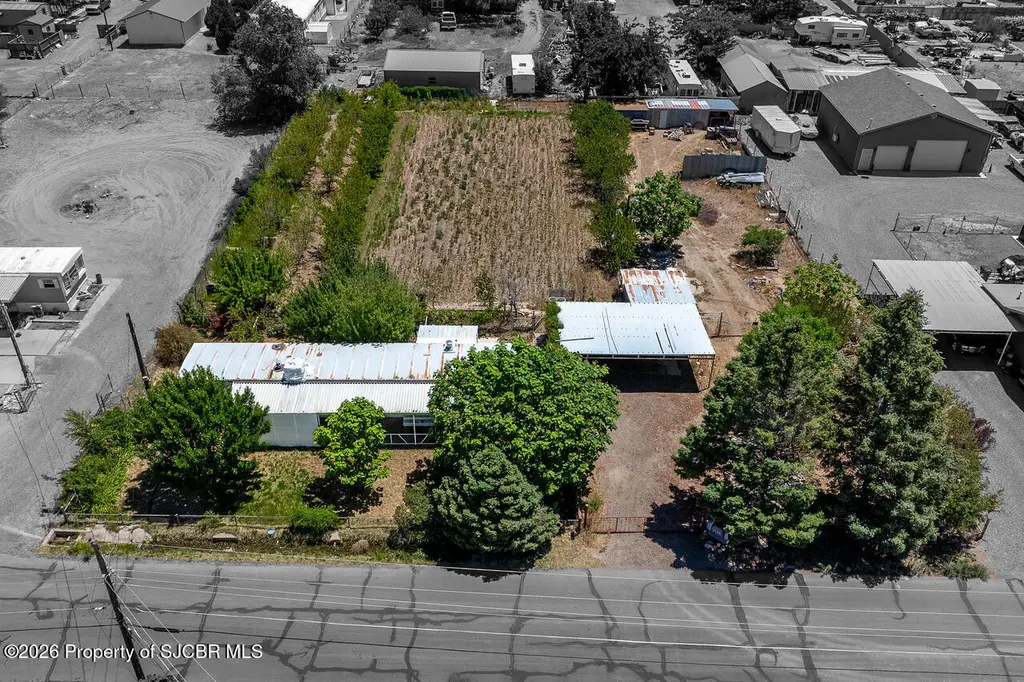
Opportunity awaits with this unique in-town property featuring two irrigated lots totaling approximately 3/4 acre in Farmington! Whether you're looking for a renovation project, investment opportunity, or the perfect site for a new home, this property offers incredible potential. The existing single-wide mobile home is being given NO value and is ready for your vision. Restore it and bring it back to life or remove it and place your new dream home on this spacious, well-established property. Outside, you'll find numerous valuable features including outbuildings, a workshop, a root cellar, and an amazing flood-irrigated garden. Enjoy the benefits of established apple trees, a thriving peach orchard, and mature shade trees that create a peaceful setting. With plenty of room for gardening, animals, hobbies, equipment, or future improvements, the possibilities are endless. Properties with irrigation, acreage, and this much potential within the city limits are hard to find. Priced at just $165,000 and available to cash buyers only. Don't miss this chance to create something truly special!Also listed as Residential - MLS # 26-633
Key facts
- Apple trees
- Outbuildings
- Root cellar
Tags
Property features AI
Exterior
- Utilities: Public water; Septic tank; Natural gas available
- Home design: Manufactured home; Residential property
- Construction: Structure type: None
- Exterior features: Covered patio/porch; Chain link fencing
Interior
- Bathrooms: 1 full bathroom
- Interior features: Has Fireplace
Neighborhood map
What this means for you Summary
Snapshot
- This is a 3-bed/1.0-bath other listed at $165k.
Deal economics
- At list price, monthly cash flow is $72 ($866/yr) — positive.
- The deal already cash-flows at list — no discount required.
- To meet the 1% rule (rent ≥ 1% of price), the offer needs to be $131k (20.6% below list).
- Recommended offer: $131k (20.6% below list) — sets the bar for 1% rule.
Location & tenants
- Location reads 66/100 on livability (#38 in NM) — a middle-class / working-renter tenant base. Strengths: cost of living A+, housing A+, health & safety A+; Watch: employment C-, crime F, commute F.
- Farmington Municipal Schools (urban): math 23% / reading 43% proficiency, ranked #23 of 95 in NM (top 24%) — families likely to look elsewhere, expect single-tenant / working-renter base with shorter leases.
- Zoned schools: Mccormick Elementary (411 students, 100% FRL); Tibbetts Middle School (683 students, 100% FRL); Farmington High (math 50% / reading 90%, grade B+, #18 of 110 statewide, top 17%, 1,824 students, 49% FRL) — zoned schools average 83% FRL vs 48% district-wide (35 pts higher); higher-poverty schools than district average — tighter screening recommended.
- Zoned-school proficiency averages 70% at this address vs 33% district-wide (+37 pts) — the actual schools serving this property are materially stronger than the Farmington Municipal Schools average implies; a family-tenant draw the district grade alone would hide.
- Market conditions: Rents rising fast (+5.1%/yr); 246 active listings in the ZIP; 1 comparable units currently listed for rent nearby; 78 units permitted in San Juan County in 2024 (8 in 5+ unit buildings).
Forward outlook
- Local home prices are declining (-3.0%/yr); year-one equity from $1k of loan paydown is wiped out by about $5k of value loss. Plan a longer hold.
- San Juan County population projected at -51% by 2050 — secular population decline; favor cash flow + early exit over multi-decade hold.
Negotiation context
- It's been on market 22 days — a 2% lower offer ($163k) is reasonable based on typical stale-listing flexibility.
- 2 sale attempts with the ask held roughly flat each time — persistent listings suggest the price (not the market) is what's stuck; bring a comps-based counter.
Questions for the listing agent
- Built in 1968 — when were the roof, HVAC, electrical panel, plumbing, and water heater last replaced?
- Is there a deadline driving the sale (1031 exchange, divorce, estate, relocation)? That informs how much negotiation room exists.
- Schools are D-rated, which usually means shorter tenancies and higher turnover. Who's the typical renter profile here, and what's been the actual vacancy rate?
- Crime grade is F in this area — have there been break-ins, vandalism, or insurance claims at this property in the last 3 years? What carrier currently insures it and at what premium?
- The area grade is low — what's the realistic commute time and amenity access for the typical tenant pool here? Any planned neighborhood developments (good or bad) we should know about?
- What's the average days-on-market for RENTAL listings here right now (not sales)? A rising rental-DOM trend means longer vacancies and softer asking-rent achievability than the comps imply.
- What's the recent tenant-quality profile in this submarket — average credit score on applications, eviction rate, late-payment / NSF rate, and stable-employment percentage? A property-management company in the area should have these aggregated.
- How much new for-sale + rental construction is in the pipeline within 1–3 miles? Heavy new supply typically softens prices + rents 12–24 months out; constrained supply supports both.
Investment metrics
- 1% rule
- 0.79% ✗
- Cap rate
- 6.82%
- Cash-on-cash
- 1.87%
- DSCR
- 1.08
- GRM
- 10.5
CMA / ARV
No comps found within radius.
Projected returns pro-forma
-3.0% appreciation · 5.08% rent growth · sell at horizon
- IRR
- -11.4%
- Equity multiple
- 0.58×
- Total profit
- $-19,431
- Equity at exit
- $24,602
- IRR
- 0.2%
- Equity multiple
- 1.01×
- Total profit
- $624
- Equity at exit
- $14,266
Cash invested: $46,200 (down + closing). Projections, not guarantees.
Landlord ↔ Tenant lean methodology
- Overall (STATE)
- 55 Moderately Landlord-Leaning
- State New Mexico
- 55 Moderately Landlord-Leaning · D+3
- County
- — inherits STATE
- City
- — inherits STATE
ZIP-level market 87401
- Rents YoY
- 5.1%
- Active inventory
- 246
- Price-to-rent
- 10.5×
Monthly cashflow live
- Estimated rent
- $1,311 medium interval (Pro) →
- Mortgage (P&I)
- −$865
- Tax from tax record
- −$29 /mo · $350/yr
- Insurance
- −$69
- HOA
- −$0
- Vacancy / Maint / Mgmt
- −$275
- Net cashflow
- $72
Break-even live
Sensitivity live
| Price | -10% $166 | -5% $119 | +0% $72 | +5% $25 | +10% $-219 |
|---|---|---|---|---|---|
| Rent | -10% $-31 | -5% $20 | +0% $72 | +5% $124 | +10% $176 |
| Rate | -1.0pp $155 | -0.5pp $114 | base $72 | +0.5pp $29 | +1.0pp $-14 |
UW: 25.0% down · 7.5% · 30yr · 1.5% tax · 5.0% vac · 8.0% maint · 8.0% mgmt
Financing live
Cash to close
- Down payment
- $41,250
- Closing costs
- $4,950
- Reserves months
- —
- Total cash needed
- —
Loan-product check · same deal, 3 products live
Conventional
25% down · 7.5% · 30yr
- Down + closing
- —
- Monthly P&I
- —
- Monthly cashflow
- —
- DSCR
- —
- Eligible?
- —
Personal DTI + credit; lowest rate.
DSCR
20% down · 8.5% · 30yr
- Down + closing
- —
- Monthly P&I
- —
- Monthly cashflow
- —
- DSCR
- —
- Eligible?
- —
No personal income docs; deal must DSCR.
Hard money
10% down · 12.0% · 12mo
- Down + closing
- —
- Monthly P&I
- —
- Monthly cashflow
- —
- DSCR
- —
- Eligible?
- —
Short-term bridge; refi at stabilization.
Rent comps 1 comps
| Address | Beds | Baths | Sqft | Rent | $/sqft | DOM | Units | Dist |
|---|---|---|---|---|---|---|---|---|
| 652 E Main St Farmington, NM | 2.0 | 1.0 | 425 | $1,195 | $2.81 | 45d | 9 | 1.07mi |
Listing history 15 events
-
2026-06-21days on market $165,000 Active 22 DOM
-
2026-06-19days on market $165,000 Active 20 DOM
-
2026-06-18days on market $165,000 Active 19 DOM
-
2026-06-17days on market $165,000 Active 18 DOM
-
2026-06-16days on market $165,000 Active 17 DOM
-
2026-06-15days on market $165,000 Active 16 DOM
-
2026-06-14days on market $165,000 Active 14 DOM
-
2026-06-12days on market $165,000 Active 13 DOM
-
2026-06-09days on market $165,000 Active 10 DOM
-
2026-06-08days on market $165,000 Active 9 DOM
-
2026-06-07days on market $165,000 Active 8 DOM
-
2026-06-05days on market $165,000 Active 5 DOM
-
2026-06-02days on market $165,000 Active 3 DOM
-
2026-06-01days on market $165,000 Active 2 DOM
-
2026-05-31$165,000 Active 1 DOM
ⓘ Source: listings_history table (triggers on properties + properties_extension) + one-shot
backfill from property_details.listing_events for pre-trigger history.
Tax reassessment forecast NM · Resets to sale price
- Current annual tax
- $350 · $29/mo
- Projected year-2 tax
- $1,320 · $110/mo
- Expected delta
- +$970/yr (+$81/mo · 277.2%)
ⓘ Screening estimate from a state-policy table — verify with the county assessor before closing.
Climate risk First Street
- Flood 1/10 Low FEMA zone X (unshaded) · 0% chance over 30 yrs
- Wildfire 3/10 Moderate
- Heat 4/10 Moderate 7 d/yr ≥93°F today · 18 d/yr by 30 yrs out
- Wind 1/10 Low
- Air quality 2/10 Low 0 unhealthy d/yr today · 1 by 30 yrs out
Nearby sold comps map
Loading sold comps map…
Walkable amenities ~0.75 mi
Loading nearby amenities…
Taxation est. · year 1
- Rental income
- $15,727
- − Mortgage interest
- −$9,243
- − Property taxes
- −$350
- − Insurance
- −$825
- − Repairs & maintenance
- −$1,258
- − Management
- −$1,258
- − Depreciation
- −$4,800
- Taxable loss
- −$2,007
- Est. tax savings @ 24.0%
- +$482
- After-tax cash flow
- $1,348/yr
For passive investors: Depreciation is non-cash, so a rental often shows a tax loss while cash-flowing — sheltering income. Rental losses are passive: they offset passive income freely, and up to $25,000/yr can offset ordinary (W-2) income if you actively participate and your MAGI is under $100k (phasing out to $0 by $150k); unused losses carry forward. On sale, claimed depreciation is recaptured at up to 25%, and gains may owe capital-gains tax (a 1031 exchange can defer both). Figures are a year-1 estimate at your 24.0% rate — not tax advice; consult a CPA.
Schools (NCES district)
- District
- Farmington Municipal Schools
- NCES district ID
- 3500990
- Math proficiency
- 23% —
- Reading proficiency
- 43% —
- Median HH income
- $51,365
- Composite
- 31.5/100
- National rank
- #11178
- State rank
- #23 of 95 in NM
Livability — Farmington
- Score
- 66/100
- State rank
- #38
- US rank
- #11926
Category grades
Schools grade is shown separately in the Schools card above.
Census & demographics
- Census place
- Farmington, NM
- County
- San Juan County · 45,229 people
- City population
- 45,229
- Metro
- Farmington, NM
- Population (ZIP)
- 45,229
- Household income
- $61,886
- Rent vs Own
- Severe rent burden
- 1190.0
Population outlook (San Juan County) Hauer SSP2
- Today (2025)
- 95,201 people
- By 2030
- 84,154 · -11.6%
- By 2040
- 63,810 · -33.0%
- By 2050
- 46,929 · -50.7%
- By 2075
- 21,097 · -77.8%
- By 2100
- 9,410 · -90.1%
Race, ethnicity, and origin ACS 2023
- Neighborhood character
- Highly diverse neighborhood (Simpson 0.80)
- Race & ethnicity
- White 38% Native American 32% Hispanic / Latino 24% Two or more races 12% Asian 1%
- Hispanic origin (detail)
- Mexican 14%
- Common ancestry
- Lithuanian 2% Slovak 2% Italian 2%
- Foreign-born
- 4% · Canada
- Languages at home
- 72% English-only · Spanish 13%
Political lean MEDSL · San Juan
- 2024 margin
- Solid R (+31.7) · D 33.0% · R 64.7% · Other 2.3%
- 2008→2024 swing
- -10.6pp toward R · 2008: -21.2pp · 2024: -31.7pp
- All cycles
- 2024: R+31.7 2020: R+28.3 2016: R+33.1 2012: R+28.5 2008: R+21.2
Not yet ingested
- Civics
- —
Market trends
- HPI YoY
- ▼ -224.62%
- Current HPI
- 170.162
- Rent YoY
- ▲ 5.08%
- Metro
- Farmington, NM
- State GDP YoY
- —
- F500 in state
- 0
Price history
+0.0% since first listed2 events — show timeline
- 2026-05-30 Listed $165,000 SJCMLS
- 2026-05-29 Listed $165,000 SJCMLS
Property tax history
+2.2%/yrLatest (2025): $350 · +2.1% YoY. Source: county tax records.
Cash-flow waterfall
monthlySold comps — $/sqft
last 12 mo · ≤1 miLoading sold comps…