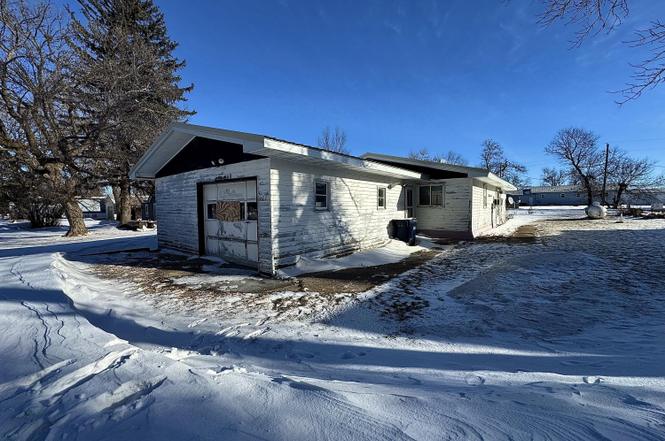
128 Park Ave W · Bowdon, ND
Flood risk No data
- FEMA flood zone
- —
- Chance of flooding over 30 yrs
- —
- Est. flood insurance / yr
- —
Fire risk No data
- Est. fire insurance / yr
- —
Heat risk No data
- Hot days now (above threshold)
- —
- Hot days in 30 yrs
- —
Wind risk No data
- Chance of severe wind over 30 yrs
- —
Air-quality risk No data
- Unhealthy air days now
- —
- Unhealthy air days in 30 yrs
- —
Risk factors via First Street. Map © Google.
Why this score? — see what drove the B grade
The composite is a weighted blend of 9 inputs, each scored 0–100. Each bar is that input's sub-score; the figure is the points it added to the 100-point composite (weight × sub-score).
- Cash flow +30.0/30.0
- 1% rule +10.0/10.0
- DSCR +10.0/10.0
- ARV discount +7.5/15.0
- Appreciation +5.0/10.0
- Schools +4.3/10.0
- Livability +2.9/5.0
- Rent growth +2.5/5.0
- Condition / age +2.5/5.0
$30,000
🖨 Deal sheet (PDF) 📄 Offer letter ✓ Due diligence
Key facts
- Small-town location
- New exterior doors
- Single-level layout
Tags
Property features AI
Finance
- Other: Property listed as residential single-family
Exterior
- Parking: Attached garage with garage door opener (1 garage space) — garage faces front
- Utilities: Public water; Public sewer; Electricity connected; Propane available; Sewer connected; Water connected
- Home design: Single family residence; One story
- Construction: Wood siding; Asphalt roof; Concrete perimeter foundation; Built on a 0.3-acre lot (approx. 50 x 120)
- Exterior features: Rain gutters; Level lot; Gravel road access; City street frontage; Publicly maintained road
Interior
- Kitchen: Gas cooktop; Oven; Range; Refrigerator; Freezer; Dishwasher not listed
- Flooring: Vinyl flooring; Carpet flooring
- Bathrooms: 1 full bathroom
- Heating & cooling: Radiant floor heating; Hot water heating; Propane heating; Wall/Window cooling units
- Interior features: Dryer, Freezer, Oven, Range, Refrigerator; Gas cooktop; Basement: concrete partial crawl space with sump pump; unfinished; Vinyl and carpet flooring
- Laundry & utility: Washer and dryer; Propane heating supply
Neighborhood map
What this means for you Summary
Snapshot
- This is a 3-bed/1.0-bath other listed at $30k.
Deal economics
- At list price, monthly cash flow is $677 ($8k/yr) — positive.
- The deal already cash-flows at list — no discount required.
- Meets the 1% rule at list price ($1k rent vs $30k).
- Recommended offer: $27k (9.0% below list) — sets the bar for market timing.
Location & tenants
- Location reads 57/100 on livability (#312 in ND) — a working-class tenant base; expect higher turnover. Strengths: cost of living A+; Watch: housing C-, employment D+, crime D-.
- Fessenden-Bowdon 25 (rural): math 45% / reading 50% proficiency, ranked #68 of 169 in ND (top 40%) — families likely to look elsewhere, expect single-tenant / working-renter base with shorter leases; only 18% free/reduced lunch — higher-income household profile.
- Zoned schools: Fessenden-Bowdon Elementary School (math 37% / reading 27%, grade F, #173 of 236 statewide, top 76%, 130 students, 20% FRL); Fessenden-Bowdon High School (math 24% / reading 24%, grade F, #108 of 144 statewide, top 88%, 49 students, 20% FRL) — zoned schools at 20% FRL track the district average.
- Zoned-school proficiency averages 28% at this address vs 48% district-wide (-19 pts) — the specific schools serving this property underperform the Fessenden-Bowdon 25 average; the district grade overstates school quality for this exact location.
- Market conditions: 2 active listings in the ZIP; 1 units permitted in Wells County in 2024 (0 in 5+ unit buildings).
Forward outlook
- In year one you build about $1k of equity ($207 loan paydown + $900 appreciation (3.0% local appreciation)).
- At projected returns (3.0% appreciation + 3.0% rent growth), your $8k cash investment doubles in ~1 year — after that, you're playing with house money.
Negotiation context
- It's been on market 94 days — a 9% lower offer ($27k) is reasonable based on typical stale-listing flexibility.
- 2 sale attempts with the ask held roughly flat each time — persistent listings suggest the price (not the market) is what's stuck; bring a comps-based counter.
- Current owner paid $15k; list at $30k implies a 100% gain — meaningful room to come down on a strong offer.
Questions for the listing agent
- It's been on market 94 days. Have you received any prior offers? Is the seller open to a 9% concession, seller financing, or rate buy-down credit?
- Why hasn't it sold? Are there any deal-killer items the seller is aware of (foundation, flood, title, zoning, code violations)?
- Is there a deadline driving the sale (1031 exchange, divorce, estate, relocation)? That informs how much negotiation room exists.
- Schools are F-rated, which usually means shorter tenancies and higher turnover. Who's the typical renter profile here, and what's been the actual vacancy rate?
- Crime grade is D in this area — have there been break-ins, vandalism, or insurance claims at this property in the last 3 years? What carrier currently insures it and at what premium?
- What's the average days-on-market for RENTAL listings here right now (not sales)? A rising rental-DOM trend means longer vacancies and softer asking-rent achievability than the comps imply.
- What's the recent tenant-quality profile in this submarket — average credit score on applications, eviction rate, late-payment / NSF rate, and stable-employment percentage? A property-management company in the area should have these aggregated.
- How much new for-sale + rental construction is in the pipeline within 1–3 miles? Heavy new supply typically softens prices + rents 12–24 months out; constrained supply supports both.
Investment metrics
- 1% rule
- 3.66% ✓
- Cap rate
- 33.37%
- Cash-on-cash
- 96.71%
- DSCR
- 5.30
- GRM
- 2.3
CMA / ARV
No comps found within radius.
Projected returns pro-forma
3.0% appreciation · 3.0% rent growth · sell at horizon
- IRR
- —
- Equity multiple
- 6.56×
- Total profit
- $46,736
- Equity at exit
- $13,489
- IRR
- —
- Equity multiple
- 13.61×
- Total profit
- $105,964
- Equity at exit
- $20,789
Cash invested: $8,400 (down + closing). Projections, not guarantees.
Landlord ↔ Tenant lean methodology
- Overall (STATE)
- 82 Strongly Landlord-Friendly
- State North Dakota
- 82 Strongly Landlord-Friendly · R+20
- County
- — inherits STATE
- City
- — inherits STATE
ZIP-level market 58418
- Active inventory
- 2
- Price-to-rent
- 2.3×
Monthly cashflow live
- Estimated rent
- $1,099 medium interval (Pro) →
- Mortgage (P&I)
- −$157
- Tax from tax record
- −$21 /mo · $256/yr
- Insurance
- −$12
- HOA
- −$0
- Lot rent
- −$0
- Vacancy / Maint / Mgmt
- −$231
- Net cashflow
- $677
Break-even live
Sensitivity live
| Price | -10% $694 | -5% $685 | +0% $677 | +5% $668 | +10% $660 |
|---|---|---|---|---|---|
| Rent | -10% $590 | -5% $634 | +0% $677 | +5% $720 | +10% $764 |
| Rate | -1.0pp $692 | -0.5pp $685 | base $677 | +0.5pp $669 | +1.0pp $661 |
UW: 25.0% down · 7.5% · 30yr · 1.5% tax · 5.0% vac · 8.0% maint · 8.0% mgmt
Financing live
Cash to close
- Down payment
- $7,500
- Closing costs
- $900
- Reserves months
- —
- Total cash needed
- —
Loan-product check · same deal, 3 products live
Conventional
25% down · 7.5% · 30yr
- Down + closing
- —
- Monthly P&I
- —
- Monthly cashflow
- —
- DSCR
- —
- Eligible?
- —
Personal DTI + credit; lowest rate.
DSCR
20% down · 8.5% · 30yr
- Down + closing
- —
- Monthly P&I
- —
- Monthly cashflow
- —
- DSCR
- —
- Eligible?
- —
No personal income docs; deal must DSCR.
Hard money
10% down · 12.0% · 12mo
- Down + closing
- —
- Monthly P&I
- —
- Monthly cashflow
- —
- DSCR
- —
- Eligible?
- —
Short-term bridge; refi at stabilization.
Listing history 5 events
-
2026-05-20status Pending
-
2026-02-16status Active
-
2026-02-04soldstatus $15,000
-
2026-01-31status Pending
-
2026-01-28$30,000 Active
ⓘ Source: listings_history table (triggers on properties + properties_extension) + one-shot
backfill from property_details.listing_events for pre-trigger history.
Tax reassessment forecast ND · Resets to sale price
- Current annual tax
- $256 · $21/mo
- Projected year-2 tax
- $294 · $24/mo
- Expected delta
- +$38/yr (+$3/mo · 14.9%)
ⓘ Screening estimate from a state-policy table — verify with the county assessor before closing.
Nearby sold comps map
Loading sold comps map…
Walkable amenities ~0.75 mi
Loading nearby amenities…
Taxation est. · year 1
- Rental income
- $13,186
- − Mortgage interest
- −$1,680
- − Property taxes
- −$256
- − Insurance
- −$150
- − Repairs & maintenance
- −$1,055
- − Management
- −$1,055
- − Depreciation
- −$873
- Taxable income
- $8,117
- Est. tax owed @ 24.0%
- −$1,948
- After-tax cash flow
- $6,175/yr
For passive investors: Depreciation is non-cash, so a rental often shows a tax loss while cash-flowing — sheltering income. Rental losses are passive: they offset passive income freely, and up to $25,000/yr can offset ordinary (W-2) income if you actively participate and your MAGI is under $100k (phasing out to $0 by $150k); unused losses carry forward. On sale, claimed depreciation is recaptured at up to 25%, and gains may owe capital-gains tax (a 1031 exchange can defer both). Figures are a year-1 estimate at your 24.0% rate — not tax advice; consult a CPA.
Schools (NCES district)
- District
- Fessenden-Bowdon 25
- NCES district ID
- 3800049
- Math proficiency
- 45% ▬ 0.00%
- Reading proficiency
- 50% ▼ -10.00%
- Median HH income
- $49,109
- Composite
- 42.74/100
- National rank
- #6780
- State rank
- #68 of 169 in ND
Livability — Bowdon
- Score
- 57/100
- State rank
- #312
- US rank
- #22151
Category grades
Schools grade is shown separately in the Schools card above.
Census & demographics
- Census place
- Bowdon, ND
- Population (ZIP)
- 336
Population outlook (Wells County) Hauer SSP2
- Today (2025)
- 4,023 people
- By 2030
- 3,980 · -1.1%
- By 2040
- 4,035 · +0.3%
- By 2050
- 4,088 · +1.6%
- By 2075
- 4,900 · +21.8%
- By 2100
- 4,939 · +22.8%
Race, ethnicity, and origin ACS 2023
- Neighborhood character
- Predominantly White (100%)
- Race & ethnicity
- White 100%
- Common ancestry
- Portuguese 16% Slovak 4% Scotch-Irish 1%
Political lean MEDSL · Wells
- 2024 margin
- Solid R (+62.9) · D 18.1% · R 81.0%
- 2008→2024 swing
- -36.5pp toward R · 2008: -26.4pp · 2024: -62.9pp
- All cycles
- 2024: R+62.9 2020: R+61.1 2016: R+58.4 2012: R+41.3 2008: R+26.4
Not yet ingested
- Civics
- —
Market trends
- HPI YoY
- —
- Current HPI
- —
- Rent YoY
- —
- Metro
- —
- State GDP YoY
- ▲ 2.09%
- F500 in state
- 2
Industry mix (Fortune 500 HQ in ND)
| Industry | F500 HQs | Revenue |
|---|---|---|
| Utilities / Construction | 1 | $6B |
|
||
Price history
-50.0% since first listed5 events — show timeline
- 2026-05-20 Pending — GNMLS
- 2026-02-16 Relisted — GNMLS
- 2026-02-04 Sold (Public Records) $15,000 Public Records
- 2026-01-31 Pending — GNMLS
- 2026-01-28 Listed $30,000 GNMLS
Property tax history
+1.1%/yrLatest (2025): $256 · -12.1% YoY. Source: county tax records.
Cash-flow waterfall
monthlySold comps — $/sqft
last 12 mo · ≤1 miLoading sold comps…