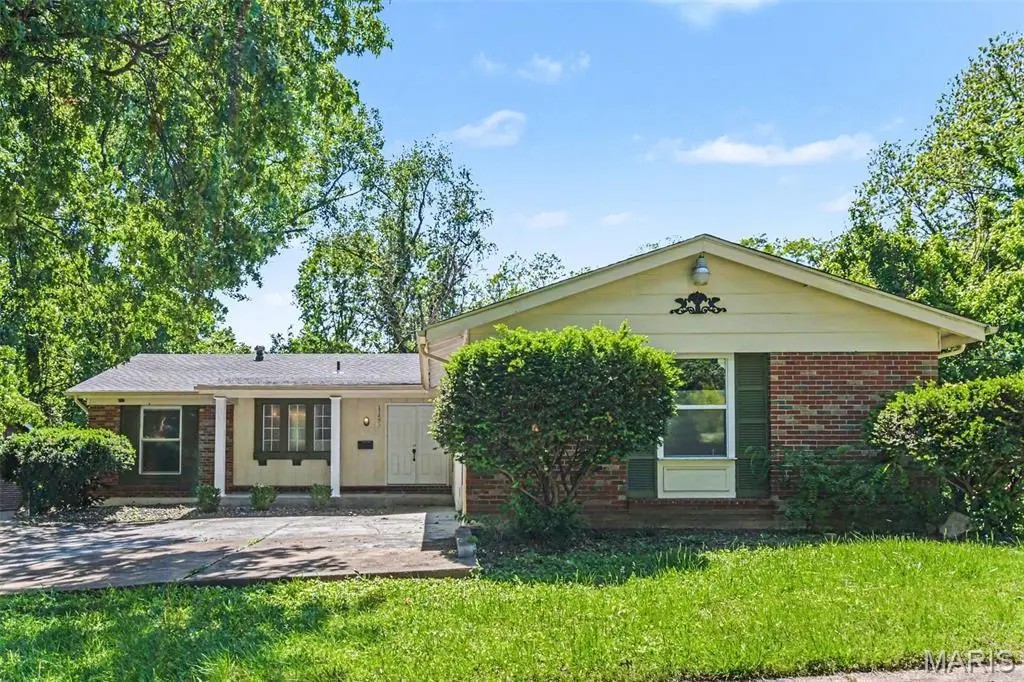
11433 Tobaggon Trl · Black Jack, MO
Flood risk 1/10 · Minimal
- FEMA flood zone
- X (unshaded)
- Chance of flooding over 30 yrs
- 0.0%
- Est. flood insurance / yr
- $473 – $860
Fire risk 1/10 · Minimal
- Est. fire insurance / yr
- $1,054 – $1,958
Heat risk 5/10 · Moderate
- Hot days now (above 106°F)
- 7 days/yr
- Hot days in 30 yrs
- 21 days/yr
Wind risk 2/10 · Minimal
- Chance of severe wind over 30 yrs
- 1.0%
Air-quality risk 3/10 · Minor
- Unhealthy air days now
- 3 days/yr
- Unhealthy air days in 30 yrs
- 5 days/yr
Risk factors via First Street. Map © Google.
Why this score? — see what drove the C- grade
The composite is a weighted blend of 9 inputs, each scored 0–100. Each bar is that input's sub-score; the figure is the points it added to the 100-point composite (weight × sub-score).
- Cash flow +14.8/30.0
- Appreciation +10.0/10.0
- ARV discount +6.3/15.0
- DSCR +4.5/10.0
- Rent growth +4.4/5.0
- 1% rule +4.0/10.0
- Livability +3.5/5.0
- Condition / age +2.5/5.0
- Schools +1.7/10.0
$214,900
🖨 Deal sheet 📄 Offer letter ✓ Due diligence
Listing remarks
Discover this charming 3-bedroom, 3-bathroom home located in the desirable Hathaway Trails community. This residence offers a traditional layout that provides a classic sense of separation and structure throughout the living spaces. The heart of the home features a functional, eat-in kitchen updated with stainless-steel appliances and durable granite countertops. Adding to the home's versatility is a partially finished basement, offering excellent potential for additional storage, a hobby space, or future customization to fit your needs. The location is a standout feature, providing easy access to local shopping, dining, and major highways, making for a convenient daily commute and effortle
Key facts
- Eat-in kitchen
- Granite countertops
- 9,125 sq ft lot
Tags
Property features AI
Finance
- Financial info: Lease not considered; No second mortgage indicated
- HOA & community: Hathaway Trails 2 Homeowners Association; Annual HOA fee of $215 (includes other services)
Exterior
- Parking: Attached 2-car garage
- Utilities: Public water; Private sewer; Electricity connected; Natural gas available; Water connected; Electric service listed as other
- Home design: Single family residence; One-story house; Residence facing unspecified direction
- Construction: Brick and wood siding exterior; Composition roof; Full, unfinished concrete basement
- Exterior features: Covered front porch; Patio; Rain gutters; Level lot; Asphalt/paved road frontage on a city street
Interior
- Kitchen: Dishwasher; Microwave; Oven; Gas range; Refrigerator
- Bedrooms: 3 bedrooms (all on the main level)
- Flooring: Carpet; Hardwood; Vinyl
- Bathrooms: 3 full bathrooms (two on the main level, one on the lower level)
- Heating & cooling: Forced air heating (natural gas); Central air conditioning (electric)
- Interior features: Built-in features; Ceiling fan(s); Eat-in kitchen; Kitchen/dining room combo; Open floorplan; Pantry; Walk-in closet(s)
Neighborhood map
What this means for you Summary
Snapshot
- This is a 3-bed/2.5-bath single-family listed at $215k.
Deal economics
- At list price, monthly cash flow is $57 ($689/yr) — positive.
- The deal already cash-flows at list — no discount required.
- To meet the 1% rule (rent ≥ 1% of price), the offer needs to be $193k (10.1% below list).
- Recommended offer: $193k (10.1% below list) — sets the bar for 1% rule.
Location & tenants
- Location reads 70/100 on livability (#132 in MO) — a middle-class / working-renter tenant base. Strengths: cost of living A+, housing A+; Watch: health & safety C-, crime D+, amenities F.
- Hazelwood (suburban): math 11% / reading 26% proficiency, ranked #306 of 324 in MO (top 94%) — low school quality limits family demand, transient renter base, plan for 1-2y turnover.
- Zoned schools: Jury Elem. (math 5% / reading 19%, grade F, #1,016 of 1,115 statewide, top 92%, 420 students, 99% FRL); Hazelwood Central High (math 12% / reading 33%, grade F, #455 of 521 statewide, top 88%, 1,628 students, 52% FRL) — zoned schools average 75% FRL vs 53% district-wide (22 pts higher); higher-poverty schools than district average — tighter screening recommended.
- Market conditions: Rents rising fast (+7.5%/yr); 218 active listings in the ZIP; 12 comparable units currently listed for rent nearby; rentals at typical pace (median 18d on market — plan ~3-4 weeks tenant-placement turnaround); 920 units permitted in St. Louis County in 2024 (250 in 5+ unit buildings).
- This rent runs 35% of the median local income ($67k/yr) — at the standard rent-burdened threshold; future hikes will face affordability resistance.
Forward outlook
- In year one you build about $23k of equity ($1k loan paydown + $21k appreciation (10.0% local appreciation)).
- At projected returns (10.0% appreciation + 7.5% rent growth), your $60k cash investment doubles in ~3 years — after that, you're playing with house money.
- By year 2, paydown + projected appreciation supports a ~$37k cash-out refi (75% LTV) — recoverable capital for the next deal without selling this one.
Negotiation context
- It's been on market 35 days — a 3% lower offer ($208k) is reasonable based on typical stale-listing flexibility.
- 7 sale attempts since 7y ago with the ask held roughly flat each time — persistent listings suggest the price (not the market) is what's stuck; bring a comps-based counter.
Risks & watch-outs
- Climate carrying-cost: extreme-heat days projected 7→21/yr by 2055 (HVAC capex compounding) — expect insurance premiums to compound above CPI over the hold.
Questions for the listing agent
- It's been on market 35 days. Have you received any prior offers? Is the seller open to a 10% concession, seller financing, or rate buy-down credit?
- Built in 1968 — when were the roof, HVAC, electrical panel, plumbing, and water heater last replaced?
- What does the HOA fee cover, when was the last increase, and are there any pending special assessments or reserve-fund shortfalls?
- Is there a deadline driving the sale (1031 exchange, divorce, estate, relocation)? That informs how much negotiation room exists.
- Crime grade is D in this area — have there been break-ins, vandalism, or insurance claims at this property in the last 3 years? What carrier currently insures it and at what premium?
- What's the average days-on-market for RENTAL listings here right now (not sales)? A rising rental-DOM trend means longer vacancies and softer asking-rent achievability than the comps imply.
- What's the recent tenant-quality profile in this submarket — average credit score on applications, eviction rate, late-payment / NSF rate, and stable-employment percentage? A property-management company in the area should have these aggregated.
- How much new for-sale + rental construction is in the pipeline within 1–3 miles? Heavy new supply typically softens prices + rents 12–24 months out; constrained supply supports both.
Investment metrics
- 1% rule
- 0.90% ✗
- Cap rate
- 6.61%
- Cash-on-cash
- 1.14%
- DSCR
- 1.05
- GRM
- 9.3
CMA / ARV
- ARV (median comp)
- $209,257
- List price
- $214,900
- Delta
- 2.70%
- Verdict
- FAIR
- Comps
- 20 within 1.0 mi
Show comp detail 12 sales within ~0.75 mi
| Address | Dist | Beds/Ba | Sqft | Sold | Price | $/sf | Match |
|---|---|---|---|---|---|---|---|
| 11675 Helenoak Dr | 0.37mi | 3/2.0 | 1,674 (+0%) | 12mo | $245,000 | $146 | 70 |
| 4461 Rhine Dr | 0.56mi | 3/2.5 | 1,607 (-4%) | 5mo | $150,000 | $93 | 64 |
| 19 Bridekirk Ct | 0.54mi | 4/2.0 (+1) | 1,624 (-2%) | 1mo | $220,000 | $135 | 63 |
| 11636 Macrinus Dr | 0.59mi | 4/3.0 (+1) | 1,525 (-8%) | 1mo | $229,900 | $151 | 51 |
| 11588 Galba Dr | 0.53mi | 3/2.0 | 1,552 (-7%) | 13mo | $200,000 | $129 | 51 |
| 11875 Old Halls Ferry Rd | 0.71mi | 3/3.0 | 1,802 (+8%) | 4mo | $269,000 | $149 | 48 |
| 4471 Rhine Dr | 0.55mi | 4/3.0 (+1) | 1,525 (-8%) | 7mo | $245,000 | $161 | 47 |
| 4451 Rhine Dr | 0.57mi | 3/2.0 | 1,421 (-15%) | 0mo | $165,000 | $116 | 46 |
| 11027 Landseer Dr | 0.64mi | 4/2.0 (+1) | 1,600 (-4%) | 13mo | $165,000 | $103 | 46 |
| 1 Welwyn Ct | 0.75mi | 3/2.5 | 1,848 (+11%) | 3mo | $200,000 | $108 | 44 |
| 11015 Landseer Dr | 0.67mi | 2/3.0 (-1) | 1,893 (+14%) | 9mo | $130,000 | $69 | 32 |
| 5 Calderabby Rd | 0.69mi | 4/2.5 (+1) | 1,893 (+14%) | 12mo | $274,900 | $145 | 31 |
Match score weights: distance 35% · size 25% · config 20% · recency 20%. Top-matched comps best support the ARV.
Projected returns pro-forma
10.0% appreciation · 7.51% rent growth · sell at horizon
- IRR
- 26.7%
- Equity multiple
- 3.16×
- Total profit
- $129,883
- Equity at exit
- $193,599
- IRR
- 24.7%
- Equity multiple
- 7.68×
- Total profit
- $401,928
- Equity at exit
- $417,503
Cash invested: $60,172 (down + closing). Projections, not guarantees.
Landlord ↔ Tenant lean methodology
- Overall (STATE)
- 81 Strongly Landlord-Friendly
- State Missouri
- 81 Strongly Landlord-Friendly · R+10
- County
- — inherits STATE
- City
- — inherits STATE
ZIP-level market 63033
- Home prices YoY
- 2.5%
- Rents YoY
- 7.5%
- Active inventory
- 218
- Price-to-rent
- 9.3×
Monthly cashflow live
- Estimated rent
- $1,932 high interval (Pro) →
- Mortgage (P&I)
- −$1,127
- Tax from tax record
- −$235 /mo · $2,817/yr
- Insurance
- −$90
- HOA
- −$18
- Vacancy / Maint / Mgmt
- −$406
- Net cashflow
- $57
Break-even live
UW: 25.0% down · 7.5% · 30yr · 1.5% tax · 5.0% vac · 8.0% maint · 8.0% mgmt
Financing live
Cash to close
- Down payment
- $53,725
- Closing costs
- $6,447
- Reserves months
- —
- Total cash needed
- —
Loan-product check · same deal, 3 products live
Conventional
25% down · 7.5% · 30yr
- Down + closing
- —
- Monthly P&I
- —
- Monthly cashflow
- —
- DSCR
- —
- Eligible?
- —
Personal DTI + credit; lowest rate.
DSCR
20% down · 8.5% · 30yr
- Down + closing
- —
- Monthly P&I
- —
- Monthly cashflow
- —
- DSCR
- —
- Eligible?
- —
No personal income docs; deal must DSCR.
Hard money
10% down · 12.0% · 12mo
- Down + closing
- —
- Monthly P&I
- —
- Monthly cashflow
- —
- DSCR
- —
- Eligible?
- —
Short-term bridge; refi at stabilization.
Rent comps 12 comps
| Address | Beds | Baths | Sqft | Rent | $/sqft | DOM | Units | Dist |
|---|---|---|---|---|---|---|---|---|
| 11635 Hazeloak Dr Black Jack, MO | 3.0 | 2.0 | 1124 | $1,728 | $1.54 | 17d | 1 | 0.38mi |
| 4872 Bristol Rock Rd Black Jack, MO | 4.0 | 2.0 | 1448 | $2,061 | $1.42 | 2d | 1 | 0.52mi |
| 2544 Netherton Dr Saint Louis, MO | 3.0 | 2.0 | 1288 | $1,945 | $1.51 | 2d | 1 | 0.54mi |
| 2257 Luxmore Dr Saint Louis, MO | 3.0 | 3.0 | 1073 | $1,495 | $1.39 | 24d | 1 | 0.91mi |
| 4583 Whisper Lake Dr Black Jack, MO | 1.0–5.0 | 1.0–2.5 | 1225 | $1,156 | $0.94 | 2d | 17 | 0.99mi |
| 11321 Amboy Ln Saint Louis, MO | 3.0 | 3.0 | 1182 | $1,756 | $1.49 | 2d | 1 | 1.03mi |
| 4440 Parker Rd Black Jack, MO | 3.0 | 2.0 | 1900 | $1,711 | $0.90 | 2d | 1 | 1.04mi |
| 5364 Trailview Dr Black Jack, MO | 4.0 | 3.0 | 1992 | $2,330 | $1.17 | 22d | 1 | 1.05mi |
| 2259 Ainsworth Dr Saint Louis, MO | 4.0 | 2.0 | 1500 | $1,776 | $1.18 | 44d | 1 | 1.10mi |
| 2259 Ainsworth Dr Saint Louis, MO | 4.0 | 2.0 | 1561 | $2,100 | $1.35 | 2d | 1 | 1.10mi |
| 10606 Kilbourn Dr Saint Louis, MO | 3.0 | 2.0 | 2100 | $1,395 | $0.66 | 44d | 1 | 1.18mi |
| 5320 Springtrail Dr Black Jack, MO | 4.0 | 2.5 | 1712 | $2,390 | $1.40 | 22d | 1 | 1.23mi |
HOA detail
- Monthly dues
- $18 · $216/yr
Listing history 33 events
-
2026-06-17status $214,900 Pending 35 DOM
-
2026-06-16days on market $214,900 Active 35 DOM
-
2026-06-15days on market $214,900 Active 34 DOM
-
2026-06-13days on market $214,900 Active 32 DOM
-
2026-06-13pricedays on market $214,900 Active 31 DOM
-
2026-06-09days on market $219,900 Active 28 DOM
-
2026-06-08days on market $219,900 Active 27 DOM
-
2026-06-07days on market $219,900 Active 26 DOM
-
2026-06-05days on market $219,900 Active 23 DOM
-
2026-06-03days on market $219,900 Active 22 DOM
-
2026-06-02days on market $219,900 Active 21 DOM
-
2026-06-01days on market $219,900 Active 20 DOM
-
2026-05-31days on market $219,900 Active 19 DOM
-
2026-05-12$219,900 Active 755-char remark
-
2025-03-04historical
-
2025-02-21price $220,000
-
2025-01-24$225,000 Active
-
2024-11-26status Active
-
2024-11-23historical
-
2024-11-16price $219,900
-
2024-10-19price $229,900
-
2024-09-20price $235,000
-
2024-08-26$245,000 Active
-
2022-05-26soldstatus $208,000
-
2022-05-18soldstatus Closed
-
2022-02-18status Pending
-
2022-02-08$196,000 Active
-
2021-08-05soldstatus $178,800
-
2019-11-15soldstatus Closed
-
2019-11-14status Pending
-
2019-11-13status Active
-
2019-10-19status Pending
-
2019-10-14$86,000 Active
ⓘ Source: listings_history table (triggers on properties + properties_extension) + one-shot
backfill from property_details.listing_events for pre-trigger history.
Tax reassessment forecast MO · Resets to sale price
- Current annual tax
- $2,817 · $235/mo
- Projected year-2 tax
- $2,817 · $235/mo
- Expected delta
- $0/yr ($0/mo · 0.0%)
ⓘ Screening estimate from a state-policy table — verify with the county assessor before closing.
Climate risk First Street
- Flood 1/10 Low FEMA zone X (unshaded) · 0% chance over 30 yrs
- Wildfire 1/10 Low
- Heat 5/10 Major 7 d/yr ≥106°F today · 21 d/yr by 30 yrs out
- Wind 2/10 Low 100% chance of damaging wind over 30 yrs
- Air quality 3/10 Moderate 3 unhealthy d/yr today · 5 by 30 yrs out
Nearby sold comps map
Loading sold comps map…
Walkable amenities ~0.75 mi
Loading nearby amenities…
Taxation est. · year 1
- Rental income
- $23,190
- − Mortgage interest
- −$12,038
- − Property taxes
- −$2,817
- − Insurance
- −$1,074
- − Repairs & maintenance
- −$1,855
- − Management
- −$1,855
- − HOA
- −$216
- − Depreciation
- −$6,252
- Taxable loss
- −$2,918
- Est. tax savings @ 24.0%
- +$700
- After-tax cash flow
- $1,389/yr
For passive investors: Depreciation is non-cash, so a rental often shows a tax loss while cash-flowing — sheltering income. Rental losses are passive: they offset passive income freely, and up to $25,000/yr can offset ordinary (W-2) income if you actively participate and your MAGI is under $100k (phasing out to $0 by $150k); unused losses carry forward. On sale, claimed depreciation is recaptured at up to 25%, and gains may owe capital-gains tax (a 1031 exchange can defer both). Figures are a year-1 estimate at your 24.0% rate — not tax advice; consult a CPA.
Schools (NCES district)
- District
- Hazelwood
- NCES district ID
- 2913830
- Math proficiency
- 11% ▼ -13.00%
- Reading proficiency
- 26% ▼ -6.00%
- Median HH income
- $51,621
- Composite
- 16.77/100
- National rank
- #9156
- State rank
- #306 of 324 in MO
Livability — Black Jack
- Score
- 70/100
- State rank
- #132
- US rank
- #7706
Category grades
Schools grade is shown separately in the Schools card above.
Census & demographics
- County
- Saint Louis County · 888,823 people
- City population
- 42,258
- Metro
- St. Louis, MO-IL
- Population (ZIP)
- 43,056
- Household income
- $66,776
- Rent vs Own
- Severe rent burden
- 1429.0
Population outlook (St. Louis County) Hauer SSP2
- Today (2025)
- 1,025,227 people
- By 2030
- 1,028,023 · +0.3%
- By 2040
- 1,020,940 · -0.4%
- By 2050
- 1,007,280 · -1.8%
- By 2075
- 987,277 · -3.7%
- By 2100
- 921,984 · -10.1%
Race, ethnicity, and origin ACS 2023
- Neighborhood character
- Predominantly Black (71%)
- Race & ethnicity
- Black 71% White 23% Two or more races 4% Hispanic / Latino 1%
- Common ancestry
- Romanian 1% Lithuanian 1% Italian 1%
- Foreign-born
- 3% · Canada, Vietnam
- Languages at home
- 95% English-only · Spanish 1% French/Haitian/Cajun 1%
Political lean MEDSL · St. Louis
- 2024 margin
- Strong D (+23.4) · D 60.8% · R 37.4% · Other 1.7%
- 2008→2024 swing
- +3.5pp toward D · 2008: 19.9pp · 2024: 23.4pp
- All cycles
- 2024: D+23.4 2020: D+24.0 2016: D+16.2 2012: D+13.7 2008: D+19.9
Not yet ingested
- Civics
- —
Market trends
- HPI YoY
- ▲ 13.78%
- Current HPI
- 570.6
- Rent YoY
- ▲ 7.51%
- Metro
- St. Louis, MO-IL
- State GDP YoY
- ▲ 1.84%
- F500 in state
- 20
Industry mix (Fortune 500 HQ in MO)
| Industry | F500 HQs | Revenue |
|---|---|---|
| Healthcare | 1 | $163B |
|
||
| Insurance | 1 | $21B |
|
||
| Industrial Technology | 1 | $17B |
|
||
| Retail | 1 | $16B |
|
||
| Industrial Distribution | 1 | $10B |
|
||
| Utilities | 1 | $9B |
|
||
Price history
+149.9% since first listed22 events — show timeline
- 2026-06-16 Pending — MARIS as Distributed by MLS Grid
- 2026-06-12 Price Changed $214,900 MARIS as Distributed by MLS Grid
- 2026-05-12 Listed $219,900 MARIS as Distributed by MLS Grid
- 2025-03-04 Delisted — MARIS as Distributed by MLS Grid
- 2025-02-21 Price Changed $220,000 MARIS as Distributed by MLS Grid
- 2025-01-24 Listed $225,000 MARIS as Distributed by MLS Grid
- 2024-11-26 Relisted — MARIS as Distributed by MLS Grid
- 2024-11-23 Delisted — MARIS as Distributed by MLS Grid
- 2024-11-16 Price Changed $219,900 MARIS as Distributed by MLS Grid
- 2024-10-19 Price Changed $229,900 MARIS as Distributed by MLS Grid
- 2024-09-20 Price Changed $235,000 MARIS as Distributed by MLS Grid
- 2024-08-26 Listed $245,000 MARIS as Distributed by MLS Grid
- 2022-05-26 Sold (Public Records) $208,000 Public Records
- 2022-05-18 Sold (MLS) — MARIS as Distributed by MLS Grid
- 2022-02-18 Pending — MARIS as Distributed by MLS Grid
- 2022-02-08 Listed $196,000 MARIS as Distributed by MLS Grid
- 2021-08-05 Sold (Public Records) $178,800 Public Records
- 2019-11-15 Sold (MLS) — MARIS as Distributed by MLS Grid
- 2019-11-14 Pending — MARIS as Distributed by MLS Grid
- 2019-11-13 Relisted — MARIS as Distributed by MLS Grid
- 2019-10-19 Pending — MARIS as Distributed by MLS Grid
- 2019-10-14 Listed $86,000 MARIS as Distributed by MLS Grid
Property tax history
+4.7%/yrLatest (2022): $2,817 · +5.6% YoY. Source: county tax records.
Cash-flow waterfall
monthlySold comps — $/sqft
last 12 mo · ≤1 miLoading sold comps…