 Triplex
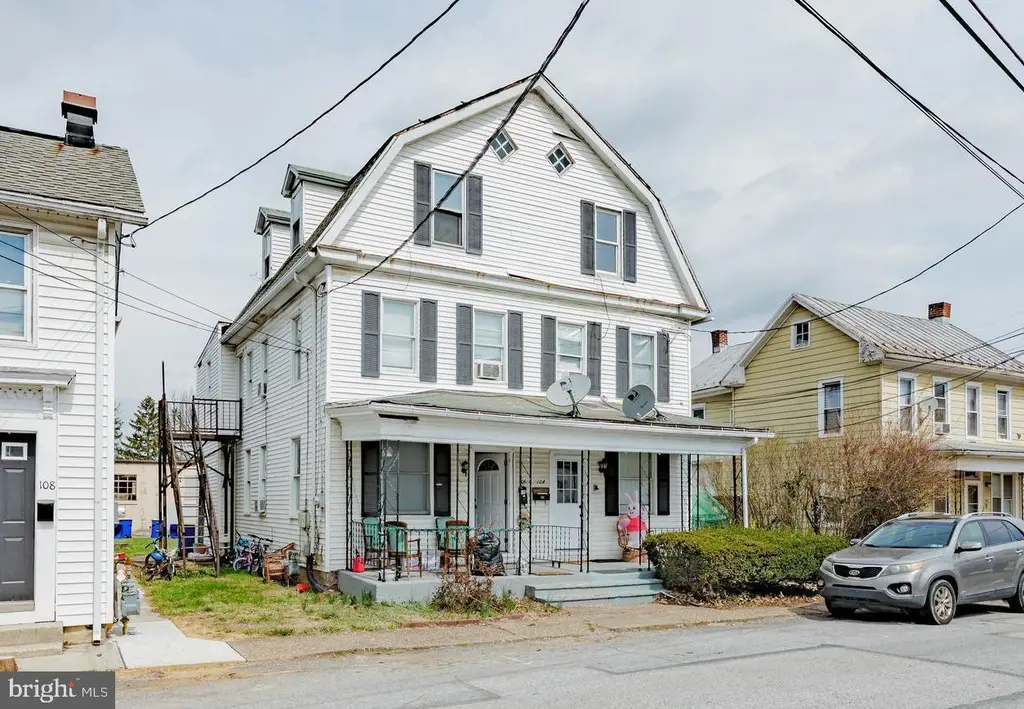
104-106 W Green St · Mechanicsburg, PA
Flood risk 1/10 · Minimal
- FEMA flood zone
- X (unshaded)
- Chance of flooding over 30 yrs
- 0.0%
- Est. flood insurance / yr
- $507 – $1,088
Fire risk 1/10 · Minimal
- Est. fire insurance / yr
- $511 – $949
Heat risk 5/10 · Moderate
- Hot days now (above 100°F)
- 7 days/yr
- Hot days in 30 yrs
- 16 days/yr
Wind risk 3/10 · Minor
- Chance of severe wind over 30 yrs
- 4.0%
Air-quality risk 3/10 · Minor
- Unhealthy air days now
- 1 days/yr
- Unhealthy air days in 30 yrs
- 4 days/yr
Risk factors via First Street. Map © Google.
Why this score? — see what drove the D grade
The composite is a weighted blend of 9 inputs, each scored 0–100. Each bar is that input's sub-score; the figure is the points it added to the 100-point composite (weight × sub-score).
- Cash flow +19.9/30.0
- DSCR +6.3/10.0
- 1% rule +4.8/10.0
- Schools +4.3/10.0
- Livability +3.9/5.0
- Rent growth +3.0/5.0
- Condition / age +2.5/5.0
- ARV discount +0.2/15.0
- Appreciation +0.0/10.0
$450,000
🖨 Deal sheet 📄 Offer letter ✓ Due diligence
Multi-family units
County records classify this as Multi-Family (2-4 Unit). Listing-text estimate: 3 units. confirmed
Listing remarks
Fully leased 3-unit investment property located in the heart of Mechanicsburg Borough. Tenants are responsible for all utilities, providing an efficient operating structure for ownership. This is an excellent opportunity to acquire a well-performing multifamily asset with stable rental income and add a strong investment to your portfolio. Submit your offer today, this opportunity will not last long.
Key facts
- 4,792 sq ft lot
- Built 1920
- Listed 14 days
Property features AI
Finance
- Financial info: Land assessed separately from improvements; Improvement assessed value noted; Taxes and assessment year available
Exterior
- Parking: On-street parking
- Utilities: Public water; Public sewer; Electric service
- Home design: Semi-detached structure; Fee simple ownership
- Construction: Stick-built construction; Block foundation; 3 total units
- Exterior features: No tidal water on the property; Other structures noted above and below grade
Interior
- Bedrooms: One single-room unit; Two three-bedroom units
- Heating & cooling: Baseboard electric heating; Window air conditioning units; Electric hot water
- Interior features: Assessor as source for living area and finished area measurements
Neighborhood map
What this means for you Summary
Snapshot
- This is a 3 × 2-bed/?-bath units multifamily listed at $450k.
Deal economics
- At list price, monthly cash flow is $544 ($7k/yr) — positive. Per door: $181/mo.
- The deal already cash-flows at list — no discount required.
- To meet the 1% rule (rent ≥ 1% of price), the offer needs to be $442k (1.8% below list).
- Recommended offer: $442k (1.8% below list) — sets the bar for 1% rule.
- Cap rate 7.7% vs local median 2.7% in Mechanicsburg — top-decile yield for the area; either an underpriced asset or a hidden risk that comps aren't pricing in. Stress-test before assuming the spread holds.
Location & tenants
- Location reads 77/100 on livability (#372 in PA, #3,259 nationally) — a middle-class / working-renter tenant base. Strengths: crime A+, cost of living A+, housing A+; Watch: amenities F, commute F.
- Mechanicsburg Area SD (suburban): math 38% / reading 60% proficiency, ranked #175 of 539 in PA (top 32%) — families likely to look elsewhere, expect single-tenant / working-renter base with shorter leases.
- Zoned schools: Mechanicsburg Area Shs (math 72% / reading 24%, grade D, #153 of 437 statewide, top 37%, 1,377 students, 33% FRL).
- Market conditions: Rents rising (+1.9%/yr); 287 active listings in the ZIP; solid renter incomes; 1,052 units permitted in Cumberland County in 2024 (310 in 5+ unit buildings).
- At $4,420/mo this rent would consume 54% of the median local household income ($99k/yr) (locally 888% of renters already pay >50% of income on rent) — very limited rent-growth headroom before tenants either downsize or default.
Forward outlook
- Local home prices are declining (-3.0%/yr); year-one equity from $3k of loan paydown is wiped out by about $14k of value loss. Plan a longer hold.
- Cumberland County population projected at +17% by 2050 — long-run rental-demand tailwind backs the buy-and-hold thesis.
Negotiation context
- Only 14 days on market — expect competitive offers; lowballing is unlikely to land.
- Current owner paid $245k; list at $450k implies a 84% gain — meaningful room to come down on a strong offer.
Risks & watch-outs
- Watch-outs: built in 1920 — expect roof / HVAC / electrical / plumbing capex.
- Climate carrying-cost: extreme-heat days projected 7→16/yr by 2055 (HVAC capex compounding) — expect insurance premiums to compound above CPI over the hold.
Questions for the listing agent
- Can we see the unit-by-unit rent roll, current vacancy, and any below-market leases? What's the average tenancy length?
- What capital expenditures (roof, boiler, parking lot, exteriors) have been made in the last 5 years, and what's planned in the next 2?
- Built in 1920 — when were the roof, HVAC, electrical panel, plumbing, and water heater last replaced?
- Is there a deadline driving the sale (1031 exchange, divorce, estate, relocation)? That informs how much negotiation room exists.
- Schools are A-rated — typically a magnet for longer-tenancy family renters. What's the average tenant stay here, and is there a school-zone premium baked into asking?
- The area grade is low — what's the realistic commute time and amenity access for the typical tenant pool here? Any planned neighborhood developments (good or bad) we should know about?
- What's the average days-on-market for RENTAL listings here right now (not sales)? A rising rental-DOM trend means longer vacancies and softer asking-rent achievability than the comps imply.
- What's the recent tenant-quality profile in this submarket — average credit score on applications, eviction rate, late-payment / NSF rate, and stable-employment percentage? A property-management company in the area should have these aggregated.
- How much new apartment / multifamily construction is in the pipeline within 1–3 miles? Heavy new supply (>2% of stock underway) typically softens rents 12–24 months out; light construction supports rent growth.
Investment metrics
- 1% rule
- 0.98% ✗
- Cap rate
- 7.74%
- Cash-on-cash
- 5.18%
- DSCR
- 1.23
- GRM
- 8.5
CMA / ARV
- ARV (on-the-fly)
- $387,198
- Comps found
- 1
Show comp detail 1 sale within ~0.75 mi
| Address | Dist | Beds/Ba | Sqft | Sold | Price | $/sf | Match |
|---|---|---|---|---|---|---|---|
| 434 W Main St | 0.40mi | 6/3.0 (-1) | 2,972 (-3%) | 16mo | $375,000 | $126 | 58 |
Match score weights: distance 35% · size 25% · config 20% · recency 20%. Top-matched comps best support the ARV.
Projected returns pro-forma
-3.0% appreciation · 1.89% rent growth · sell at horizon
- IRR
- -9.5%
- Equity multiple
- 0.66×
- Total profit
- $-43,196
- Equity at exit
- $67,096
- IRR
- -1.6%
- Equity multiple
- 0.90×
- Total profit
- $-12,737
- Equity at exit
- $38,908
Cash invested: $126,000 (down + closing). Projections, not guarantees.
Landlord ↔ Tenant lean methodology
- Overall (STATE)
- 62 Landlord-Friendly
- State Pennsylvania
- 62 Landlord-Friendly · EVEN
- County
- — inherits STATE
- City
- — inherits STATE
ZIP-level market 17055
- Rents YoY
- 1.9%
- Active inventory
- 287
- Price-to-rent
- 25.5×
Monthly cashflow live
- Estimated rent
- $4,420 high interval (Pro) →
- Mortgage (P&I)
- −$2,360
- Tax from tax record
- −$401 /mo · $4,807/yr
- Insurance
- −$188
- HOA
- −$0
- Vacancy / Maint / Mgmt
- −$928
- Net cashflow
- $544
Break-even live
3-unit breakdown (identical units grouped — click to expand)
| Units | Beds | Baths | Est. rent |
|---|---|---|---|
| 3× units | 2 | — | $4,419 |
| #1 | 2 | — | $1,473 |
| #2 | 2 | — | $1,473 |
| #3 | 2 | — | $1,473 |
| Total (3 units) | $4,420 | ||
UW: 25.0% down · 7.5% · 30yr · 1.5% tax · 5.0% vac · 8.0% maint · 8.0% mgmt
Financing live
Cash to close
- Down payment
- $112,500
- Closing costs
- $13,500
- Reserves months
- —
- Total cash needed
- —
Loan-product check · same deal, 3 products live
Conventional
25% down · 7.5% · 30yr
- Down + closing
- —
- Monthly P&I
- —
- Monthly cashflow
- —
- DSCR
- —
- Eligible?
- —
Personal DTI + credit; lowest rate.
DSCR
20% down · 8.5% · 30yr
- Down + closing
- —
- Monthly P&I
- —
- Monthly cashflow
- —
- DSCR
- —
- Eligible?
- —
No personal income docs; deal must DSCR.
Hard money
10% down · 12.0% · 12mo
- Down + closing
- —
- Monthly P&I
- —
- Monthly cashflow
- —
- DSCR
- —
- Eligible?
- —
Short-term bridge; refi at stabilization.
Listing history 11 events
-
2026-06-18days on market $450,000 Active 14 DOM
-
2026-06-17days on market $450,000 Active 13 DOM
-
2026-06-16days on market $450,000 Active 12 DOM
-
2026-06-15days on market $450,000 Active 11 DOM
-
2026-06-14days on market $450,000 Active 9 DOM
-
2026-06-10days on market $450,000 Active 6 DOM
-
2026-06-09days on market $450,000 Active 5 DOM
-
2026-06-08days on market $450,000 Active 4 DOM
-
2026-06-07statusdays on market $450,000 Active 3 DOM
-
2026-06-03remarks 402-char remark
-
2026-06-03$450,000 Coming Soon 1 DOM
ⓘ Source: listings_history table (triggers on properties + properties_extension) + one-shot
backfill from property_details.listing_events for pre-trigger history.
Tax reassessment forecast PA · Partial reset (capped growth)
- Current annual tax
- $4,807 · $401/mo
- Projected year-2 tax
- $5,959 · $497/mo
- Expected delta
- +$1,151/yr (+$96/mo · 24.0%)
ⓘ Screening estimate from a state-policy table — verify with the county assessor before closing.
Climate risk First Street
- Flood 1/10 Low FEMA zone X (unshaded) · 0% chance over 30 yrs
- Wildfire 1/10 Low
- Heat 5/10 Major 7 d/yr ≥100°F today · 16 d/yr by 30 yrs out
- Wind 3/10 Moderate 4% chance of damaging wind over 30 yrs
- Air quality 3/10 Moderate 1 unhealthy d/yr today · 4 by 30 yrs out
Nearby sold comps map
Loading sold comps map…
Walkable amenities ~0.75 mi
Loading nearby amenities…
Taxation est. · year 1
- Rental income
- $53,040
- − Mortgage interest
- −$25,207
- − Property taxes
- −$4,807
- − Insurance
- −$2,250
- − Repairs & maintenance
- −$4,243
- − Management
- −$4,243
- − Depreciation
- −$13,091
- Taxable loss
- −$801
- Est. tax savings @ 24.0%
- +$192
- After-tax cash flow
- $6,719/yr
For passive investors: Depreciation is non-cash, so a rental often shows a tax loss while cash-flowing — sheltering income. Rental losses are passive: they offset passive income freely, and up to $25,000/yr can offset ordinary (W-2) income if you actively participate and your MAGI is under $100k (phasing out to $0 by $150k); unused losses carry forward. On sale, claimed depreciation is recaptured at up to 25%, and gains may owe capital-gains tax (a 1031 exchange can defer both). Figures are a year-1 estimate at your 24.0% rate — not tax advice; consult a CPA.
Schools (NCES district)
- District
- Mechanicsburg Area SD
- NCES district ID
- 4215030
- Math proficiency
- 38% ▼ -16.00%
- Reading proficiency
- 60% ▼ -12.00%
- Median HH income
- $60,986
- Composite
- 42.92/100
- National rank
- #3118
- State rank
- #175 of 539 in PA
Livability — Mechanicsburg
- Score
- 77/100
- State rank
- #372
- US rank
- #3259
Category grades
Schools grade is shown separately in the Schools card above.
Census & demographics
- Census place
- Mechanicsburg, PA
- County
- Cumberland County · 257,673 people
- City population
- 85,577
- Metro
- Harrisburg-Carlisle, PA
- Population (ZIP)
- 42,006
- Household income
- $99,077
- Rent vs Own
- Severe rent burden
- 888.0
Population outlook (Cumberland County) Hauer SSP2
- Today (2025)
- 267,950 people
- By 2030
- 278,105 · +3.8%
- By 2040
- 296,552 · +10.7%
- By 2050
- 312,937 · +16.8%
- By 2075
- 349,233 · +30.3%
- By 2100
- 361,875 · +35.1%
Race, ethnicity, and origin ACS 2023
- Neighborhood character
- Predominantly White (85%)
- Race & ethnicity
- White 85% Two or more races 6% Hispanic / Latino 4% Black 3% Asian 3%
- Common ancestry
- Romanian 4% Slovak 3% Lithuanian 2%
- Foreign-born
- 5% · Canada, China
- Languages at home
- 94% English-only · Other Indo-European 2% Spanish 1%
Political lean MEDSL · Cumberland
- 2024 margin
- Lean R (+9.4) · D 44.6% · R 54.1% · Other 1.3%
- 2008→2024 swing
- +4.2pp toward D · 2008: -13.6pp · 2024: -9.4pp
- All cycles
- 2024: R+9.4 2020: R+10.6 2016: R+18.6 2012: R+18.5 2008: R+13.6
Not yet ingested
- Civics
- —
Market trends
- HPI YoY
- ▼ -202.92%
- Current HPI
- 254.7596
- Rent YoY
- ▲ 1.89%
- Metro
- Harrisburg-Carlisle, PA
- State GDP YoY
- ▲ 1.68%
- F500 in state
- 34
Industry mix (Fortune 500 HQ in PA)
| Industry | F500 HQs | Revenue |
|---|---|---|
| Healthcare | 2 | $309B |
|
||
| Insurance | 2 | $27B |
|
||
| Telecommunications / Media | 1 | $124B |
|
||
| Industrial Distribution | 1 | $22B |
|
||
| Financial Services | 1 | $20B |
|
||
| Chemicals / Materials | 1 | $18B |
|
||
Price history
+83.7% since first listed2 events — show timeline
- 2026-06-02 Coming Soon $450,000 BRIGHT MLS
- 2023-06-28 Sold (Public Records) $245,000 Public Records
Property tax history
+2.6%/yrLatest (2026): $4,807 · +3.1% YoY. Source: county tax records.
Cash-flow waterfall
monthlySold comps — $/sqft
last 12 mo · ≤1 miLoading sold comps…